. 2019 Jul 1;218(7):2215-2231.
doi: 10.1083/jcb.201805002. Epub 2019 May 29.

RAB6 and microtubules restrict protein secretion to focal adhesions

Affiliations

RAB6 and microtubules restrict protein secretion to focal adhesions

Lou Fourriere et al. J Cell Biol. .

Abstract

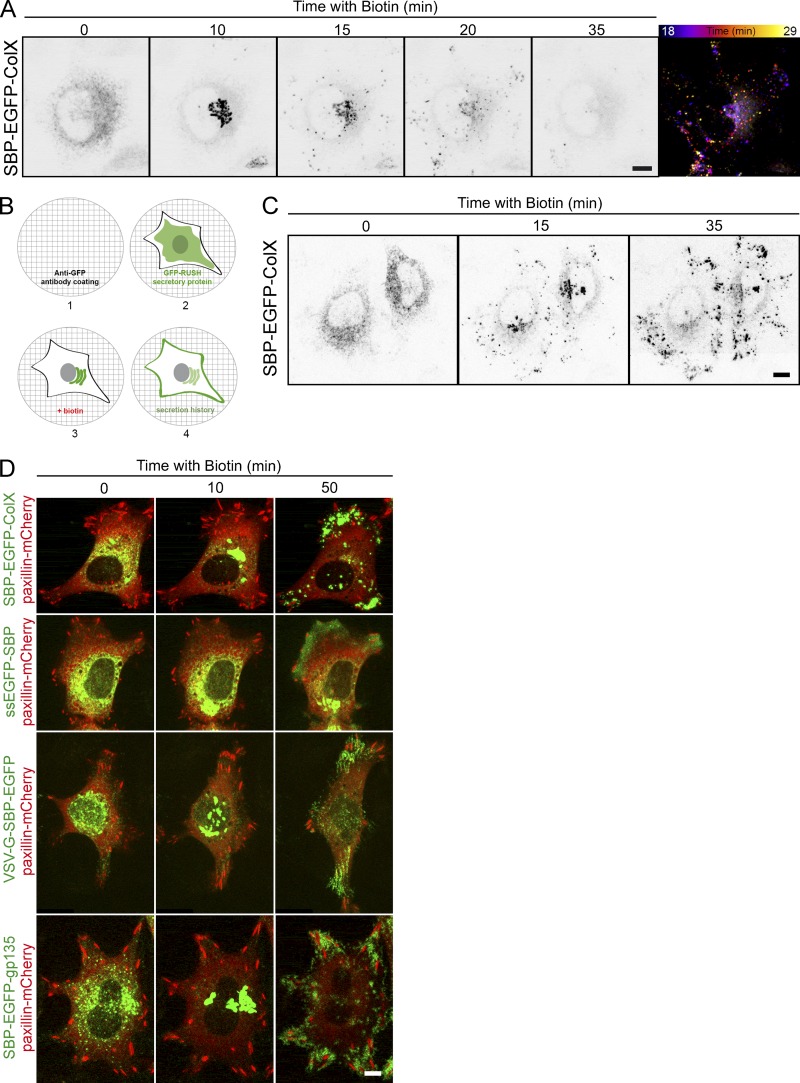
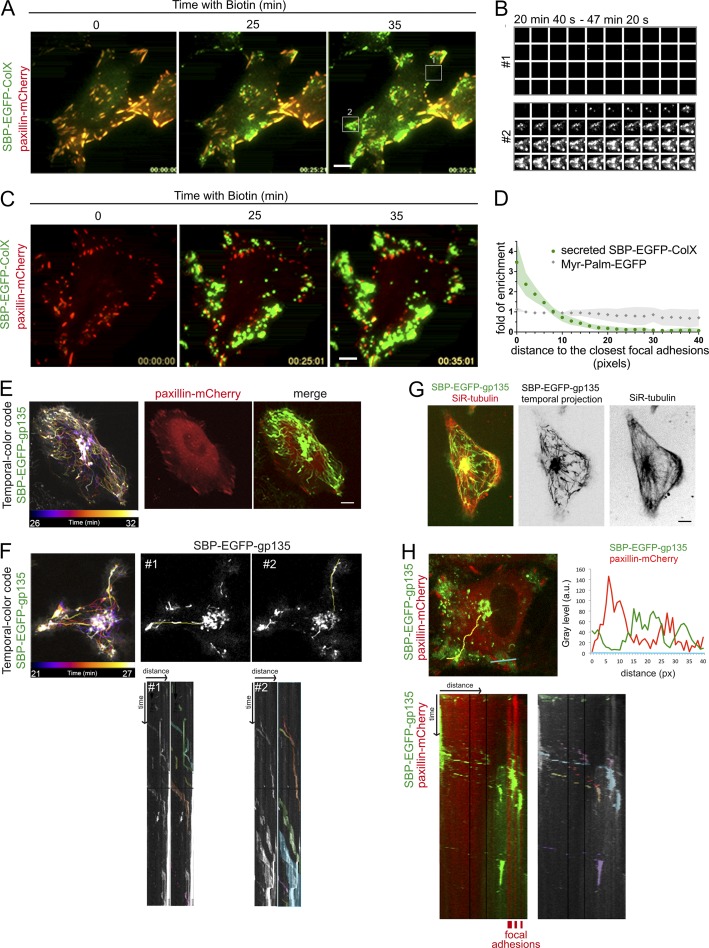
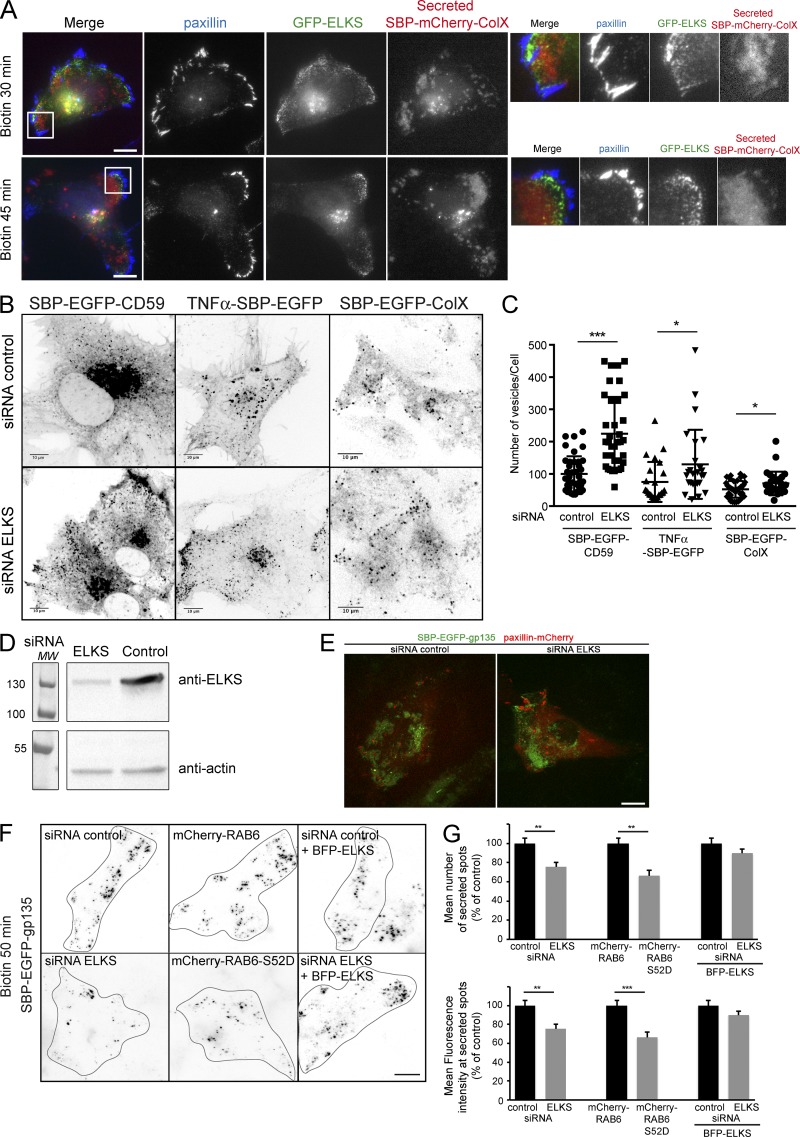
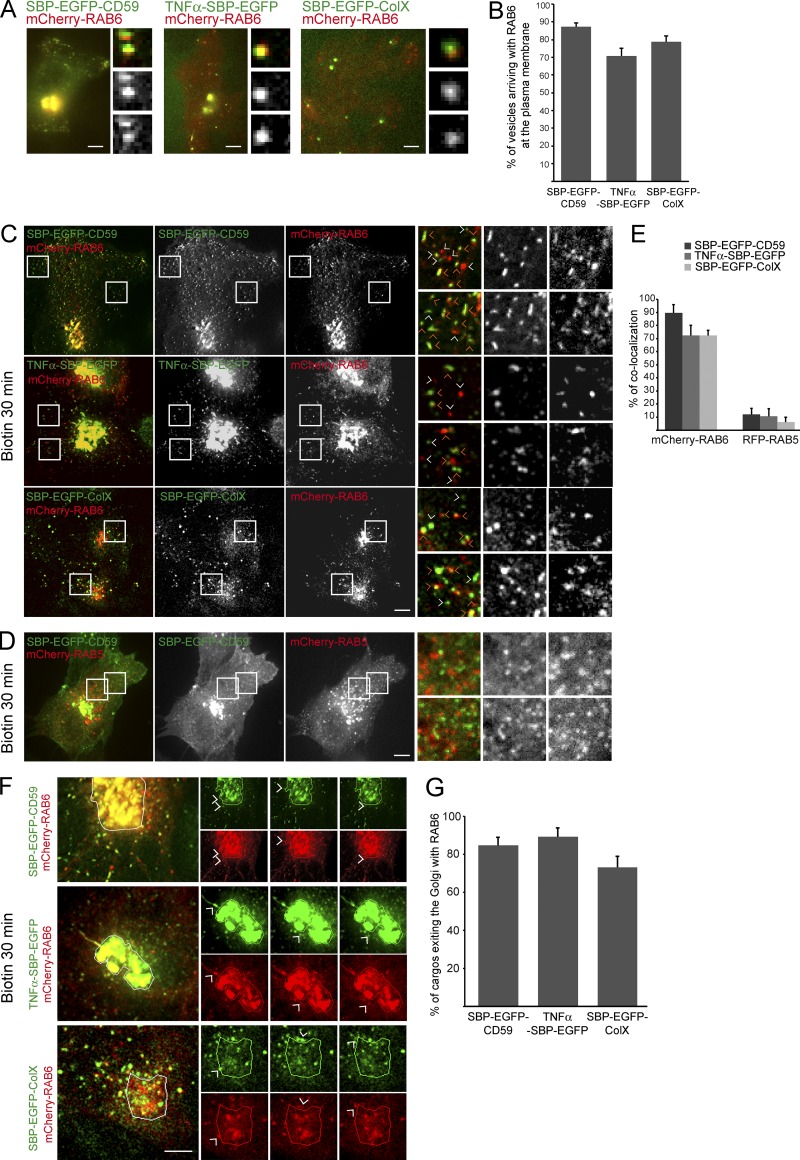
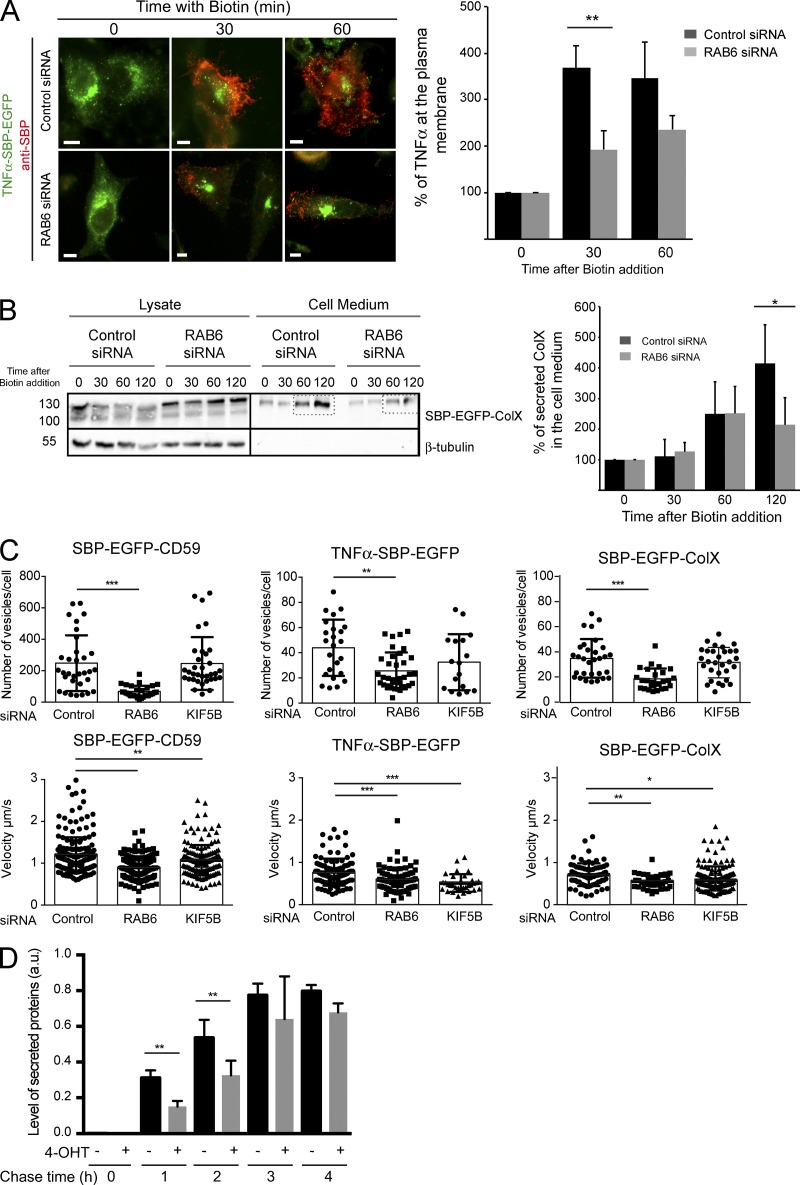
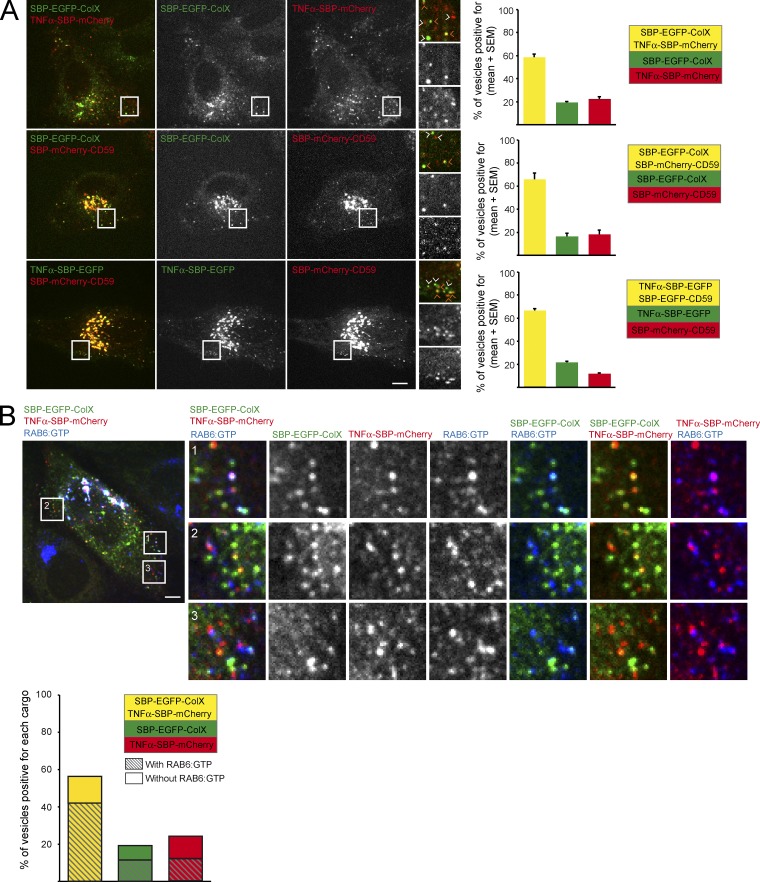
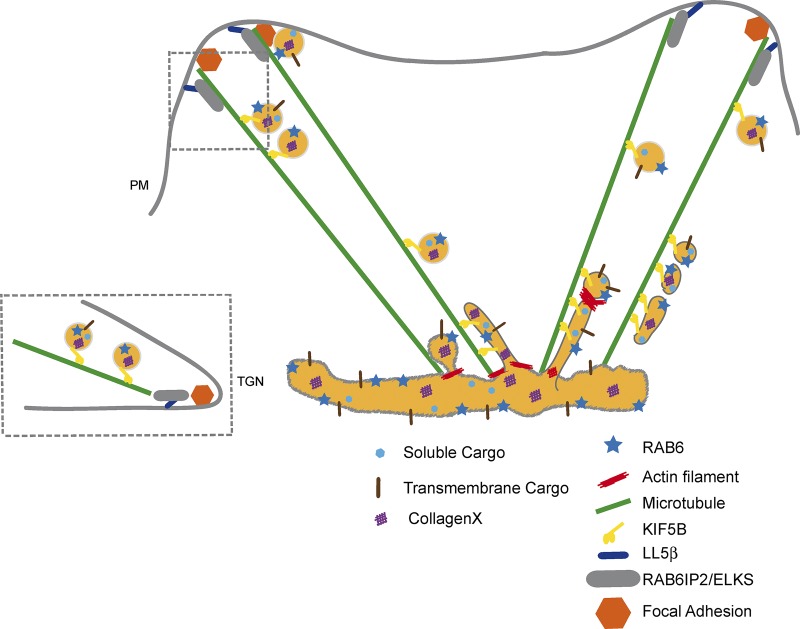
To ensure their homeostasis and sustain differentiated functions, cells continuously transport diverse cargos to various cell compartments and in particular to the cell surface. Secreted proteins are transported along intracellular routes from the endoplasmic reticulum through the Golgi complex before reaching the plasma membrane along microtubule tracks. Using a synchronized secretion assay, we report here that exocytosis does not occur randomly at the cell surface but on localized hotspots juxtaposed to focal adhesions. Although microtubules are involved, the RAB6-dependent machinery plays an essential role. We observed that, irrespective of the transported cargos, most post-Golgi carriers are positive for RAB6 and that its inactivation leads to a broad reduction of protein secretion. RAB6 may thus be a general regulator of post-Golgi secretion.


Figures

Figure 1.
Figure 1.
Local exocytosis close to adhesion sites of the cells. (A) HeLa cells stably expressing SBP-EGFP-ColX were incubated with biotin for the indicated time (min). Real-time pictures were acquired using a spinning disk microscope at the indicated times. Temporal projection (right image) was performed for the SBP-EGFP-ColX signal between 18 and 29 min of trafficking. (B) Description of the SPI assay. (1) A coverslip is coated with an anti-GFP antibody. (2) The GFP-RUSH cell line is seeded on the coverslip. (3) Addition of biotin allows the trafficking of the GFP-RUSH cargo. (4) Interactions between the anti-GFP and the GFP of the cargo (transmembrane or secreted) allow the capture of the cargo and provide a picture of the history of the secretion. (C) Trafficking of SBP-EGFP-ColX with an anti-GFP coating (SPI assay). HeLa cells stably expressing SBP-EGFP-ColX were incubated with biotin for the indicated time. Real-time images were acquired using a spinning disk microscope at the indicated times. (D) HeLa cells were transfected with SBP-EGFP-ColX, ssEGFP-SBP, VSV-G-SBP-EGFP, or SBP-EGFP-gp135, and paxillin-mCherry. Coverslips were coated with an anti-GFP coating (SPI assay). Cells were observed by time-lapse imaging using a spinning disk microscope, and pictures were acquired at the indicated times. Scale bars, 10 µm.
Figure 2.
Figure 2.
Exocytosis is directed between FAs. (A) HeLa cells were transfected with SBP-EGFP-ColX and paxillin-mCherry. Real-time pictures were acquired using a TIRF microscope at the indicated times. The TIRF angle was chosen based on the paxillin-mCherry signal. Biotin was added at time 0. (B) Fixed images of areas 1 and 2 (see A) taken every 40 s between 20 min 40 s and 47 min 20 s of ColX trafficking. Area 1 is a control condition without ColX signal at the plasma membrane. Area 2 shows secretion in close proximity to FAs. (C) Coverslips were coated with an anti-GFP antibody (SPI assay). Real-time images were acquired using a TIRF microscope at the indicated times. The TIRF angle was determined based on the paxillin-mCherry signal. Biotin was added at time 0. (D) Distance of secreted SBP-EGFP-ColX (green) or myristoylated and palmitoylated (MyrPalm)-EGFP (gray) signal from the closest FAs was measured. The distance of each pixel from the whole cell area from the closest FA was also measured. Ratio of enrichment compared with the distance of pixels of the region of interest to the closest FAs was calculated (n = 585 FAs, 10 cells for secreted SBP-EGFP-ColX and n = 319 FAs, 11 cells for Myr-Palm-EGFP). (E–H) HeLa cells were transfected with SBP-EGFP-gp135 (F and G) or SBP-EGFP-gp135 and paxillin-mCherry (E and H). Coverslips were coated with an anti-GFP antibody (SPI assay; H). Microtubules were stained with SiR-tubulin (G). Cells were observed by time-lapse imaging using a spinning disk microscope and images were acquired at the indicated times. Biotin was added at time 0. After 20 min of incubation with biotin, SBP-EGFP-gp135 localizes in the Golgi apparatus, and fast acquisition imaging was performed. Between 26 and 32 min (E) or 21 and 27 min (F), a temporal projection of EGFP-gp135 signal was performed using Fiji software and is represented with a temporal-color code (left). In F–H, kymographs (time space plots) were performed on the indicated yellow lines using Fiji software. In H, intensity profiles of SBP-EGFP-gp135 (in green) and paxillin-mCherry (in red) were performed using Fiji software at the indicated blue line. To help the interpretation of the kymographs, the passage of distinct post-Golgi carriers has been colorized. px, pixels. Scale bars, 10 µm.
Figure 3.
Figure 3.
ELKS- and RAB6-dependent arrival of secreted cargos at exocytosis hotspots. (A) HeLa cells were transfected with SBP-mCherry-ColX and GFP-ELKS. After 30- or 45-min incubation with biotin, cells were processed for immunofluorescence and stained with an anti-paxillin antibody. Coverslips were coated with an anti-GFP antibody (SPI assay). Higher magnifications of the images are shown on the right. (B) HeLa cells expressing SBP-EGFP-CD59, TNFα-SBP-EGFP, and SBP-EGFP-ColX were treated for 3 d with control or ELKS siRNAs. Cells were incubated for 60–90 min with biotin to allow cargo release from the ER and its arrival to the plasma membrane. Representative images taken from videos. (C) The number of vesicles per cell were quantified using ImageJ (mean ± SEM, n = 23–39 cells). *, P < 0.05; ***, P < 10−4 (Student’s t test). Cells were treated as indicated in B. Scale bars, 10 µm. (D) HeLa cells were treated with control or ELKS siRNA and processed for Western blotting. ELKS signal was revealed using an anti-ELKS antibody. Actin signal was used as a loading control. (E) HeLa cells were treated with control or ELKS siRNA and then cotransfected with SBP-EGFP-gp135 and paxillin-mCherry. Cells were seeded on anti-GFP–coated coverslips (SPI), and trafficking of SBP-EGFP-gp135 was monitored by spinning disk microscope upon addition of biotin. (F) HeLa cells were treated with control or ELKS siRNA and then transfected with SBP-EGFP-gp135. For rescue experiments, cells were cotransfected with BFP-ELKS. Cells were seeded on anti-GFP–coated coverslips (SPI). After a 50-min treatment with biotin, cells were fixed. Representative images are displayed. (G) The number of secreted spots as well as their intensity was quantified using ImageJ or Fiji software (mean ± SEM, n = 39–60 cells). Cells were treated as indicated in F. **, P < 10−2; ***, P < 10−4 (Student’s t test). Scale bars, 10 µm.
Figure 4.
Figure 4.
RAB6 associates with post-Golgi carriers containing CD59, TNFα, or ColX. (A) HeLa cells coexpressing mCherry-RAB6 together with SBP-EGFP-CD59, TNFα-SBP-EGFP, and SBP-EGFP-ColX were incubated for 45 min with biotin and imaged using 3D-TIRF. Representative images taken from the videos are displayed. (B) Quantification of the percentage of RAB6-positive vesicles arriving at the plasma membrane and containing SBP-EGFP-CD59, TNFα-SBP-EGFP, or SBP-EGFP-ColX. Cells were treated as indicated in A (mean ± SEM, n = 217–325 vesicles from 14–18 cells). (C) RPE1-SBP-EGFP-CD59, HeLa-SBP-EGFP-ColX (stably expressing cells or transiently transfected cells), and HeLa-TNFα-SBP-EGFP cells coexpressing mCherry-RAB6 were incubated for 30 min with biotin to allow cargo release from the ER. Cells were imaged using a time-lapse spinning-disk confocal microscope. Representative images taken from videos are displayed. Orange arrowheads point at colocalized vesicles. White arrowheads point at non-colocalized vesicles. (D) HeLa cells coexpressing SBP-EGFP-CD59 and RFP-RAB5A were incubated for 30 min with biotin to allow cargo release from the ER. Cells were imaged using a time-lapse spinning-disk confocal microscope. Representative images taken from videos are displayed. (E) Quantification of the colocalization between mCherry-RAB6 or m-Cherry-RAB5 and each type of cargo (mean ± SEM, n = 9–24 cells). (F) HeLa cells coexpressing mCherry-RAB6 and SBP-EGFP-CD59, TNFα-SBP-EGFP, or SBP-EGFP-ColX were incubated for 15–20 min with biotin and imaged using time-lapse video-microscopy. Representative images of vesicles positive for SBP-EGFP-CD59, TNFα-SBP-EGFP, or SBP-EGFP-ColX and mCherry-RAB6 exiting the Golgi complex together are displayed. Higher magnification of the images taken from time-lapse videos are on the right. (G) Quantification of the percentage of EGFP-SBP-CD59–positive vesicles exiting the Golgi complex with RAB6 (mean ± SEM, n = 13–18 cells). Scale bars, 10 µm.
Figure 5.
Figure 5.
RAB6 and KIF5B are required for the proper secretion SBP-EGFP-CD59, TNFα-SBP-EGFP, and SBP-EGFP-ColX at the plasma membrane; RAB6 depletion delays total protein secretion. (A) Left: HeLa-TNFα-SBP-EGFP, treated or not with RAB6 siRNAs, were incubated for 30 or 60 min with biotin to allow cargo release. The amount of secreted TNFα was determined on images acquired on cells using the SPI assay. Representative images of cells expressing TNFα-SBP-EGFP (green) and stained with anti-SBP (red) are displayed. Right: Quantification of the amount of TNFα present at the plasma membrane in cells treated as above (mean ± SEM, n = 67–111 cells). **, P < 10−2 (Student’s t test). Scale bars, 5 µm. (B) Left: HeLa-SBP-EGFP-ColX treated or not with RAB6 siRNAs were incubated for 30, 60, or 120 min with biotin to allow cargo release from the ER. The amount of secreted cargo was revealed by Western blotting using an anti-GFP antibody. β-tubulin was used as a loading control and as a nonsecreted protein. Representative immunoblots are displayed. Right: Quantification of the amount of ColX present at the plasma membrane in cells treated as indicated above (mean ± SEM, n = 3). *, P < 0.05 (Student’s t test). (C) HeLa cells expressing SBP-EGFP-CD59, TNFα-SBP-EGFP, and SBP-EGFP-ColX were treated for 3 d with control, RAB6, or KIF5B siRNAs. Cells were incubated for 30 min with biotin to allow cargo release from the ER. Cells were imaged using a time-lapse spinning disk confocal microscope. Vesicle velocity (µm/s) and the number of vesicles per cell were quantified using ImageJ (mean ± SEM, n = 17–35 cells). *, P < 0.05; **, P < 0.005; ***, P < 10−4 (Student’s t test). (D) The SUnSET assay was used to determine the effect of RAB6 depletion on total protein secretion. MEFs prepared from RAB6 loxP/Ko Rosa26CreERT2-TG embryos (described in Bardin et al. [2015]; named after MEF RAB6lox/lox) were treated with ethanol or with 4-OHT for 96 h to induce RAB6 depletion. Cells were then incubated with puromycin and chased in puromycin-free medium for 0, 1, 2, 4, or 5.5 h. Total protein content in cell lysis or supernatant was labeled with an anti-puromycin antibody. Puromycin intensity in the supernatant and the whole cell lysis was quantified using Image Lab software (Bio-Rad; mean ± SEM, n = 4). **, P < 0.05 (Student’s t test). Representative immunoblot is displayed in Fig. S5. a.u., arbitrary units.
Figure 6.
Figure 6.
RAB6 is not involved in sorting of cargos at the exit of Golgi complex. (A) HeLa cells coexpressing SBP-EGFP-ColX and TNFα-SPB-mCherry, SBP-EGFP-ColX and SBP-mCherry-CD59, or TNFα-SBP-EGFP and SBP-mCherry-CD59 were incubated for 35 min with biotin to allow cargo release from the ER and then imaged using time-lapse video microscopy. Representative images taken from videos are shown (higher magnification on the right). Orange arrowheads point at colocalized vesicles; white arrowheads point at non-colocalized vesicles. Right: Quantification for each pair of cargos of the percentage of vesicles positive both cargos (yellow), EGFP (green), or mCherry (red; mean ± SEM, n = 197–501 vesicles from 11–20 cells). (B) Staining of endogenous RAB6:GTP (blue) in cells coexpressing SBP-EGFP-ColX (green) and TNFα-SBP-mCherry (red) and incubated for 30 min with biotin to visualize post-Golgi carriers. Higher magnifications are shown on the right. Quantification of the percentage of vesicles containing both SBP-EGFP-ColX and TNFα-SPB-mCherry (yellow), only SBP-EGFP-ColX (green), or only TNFα-SPB-mCherry (red). Dashed bars indicate the percentage of vesicles positive for RAB6 (mean ± SEM, n = 24–128 vesicles). Scale bars, 5 µm.
Figure 7.
Figure 7.
Proposed model to explain the role of RAB6 in post-Golgi secretory pathway. All RAB6 effectors associated to post-Golgi secretion, myosin II, KIF5B, and ELKS/RAB6IP2, are involved in the secretion of various cargos. The different events can be envisioned as follows. RAB6 is present on CD59-, TNFα-, and ColX-containing vesicles exiting the Golgi complex. Myosin II is implicated in the fission of these vesicles from Golgi membranes (Miserey-Lenkei et al., 2010). Vesicles are transported to the plasma membrane in a KIF5B-dependent manner (Grigoriev et al., 2007; Miserey-Lenkei et al., 2010), and ELKS ensures their docking to exocytic hotspots close to FAs (Grigoriev et al., 2007, 2011).

References

    1. Akhmanova A., and Steinmetz M.O.. 2008. Tracking the ends: a dynamic protein network controls the fate of microtubule tips. Nat. Rev. Mol. Cell Biol. 9:309–322. 10.1038/nrm2369 - DOI - PubMed
    1. Bance B., Seetharaman S., Leduc C., Boeda B., and Etienne-Manneville S.. 2019. Microtubule acetylation but not detyrosination promotes focal adhesion dynamics and cell migration. J. Cell Sci. 132:jcs225805 10.1242/jcs.225805 - DOI - PubMed
    1. Bardin S., Miserey-Lenkei S., Hurbain I., Garcia-Castillo D., Raposo G., and Goud B.. 2015. Phenotypic characterisation of RAB6A knockout mouse embryonic fibroblasts. Biol. Cell. 107:427–439. 10.1111/boc.201400083 - DOI - PubMed
    1. Boncompain G., and Perez F.. 2013. Fluorescence-based analysis of trafficking in mammalian cells. Methods Cell Biol. 118:179–194. 10.1016/B978-0-12-417164-0.00011-2 - DOI - PubMed
    1. Boncompain G., Divoux S., Gareil N., de Forges H., Lescure A., Latreche L., Mercanti V., Jollivet F., Raposo G., and Perez F.. 2012. Synchronization of secretory protein traffic in populations of cells. Nat. Methods. 9:493–498. 10.1038/nmeth.1928 - DOI - PubMed

Publication types