. 2019 May 29;11(494):eaau9087.
doi: 10.1126/scitranslmed.aau9087.

Reprogrammed marrow adipocytes contribute to myeloma-induced bone disease

Affiliations

Reprogrammed marrow adipocytes contribute to myeloma-induced bone disease

Huan Liu et al. Sci Transl Med. .

Abstract

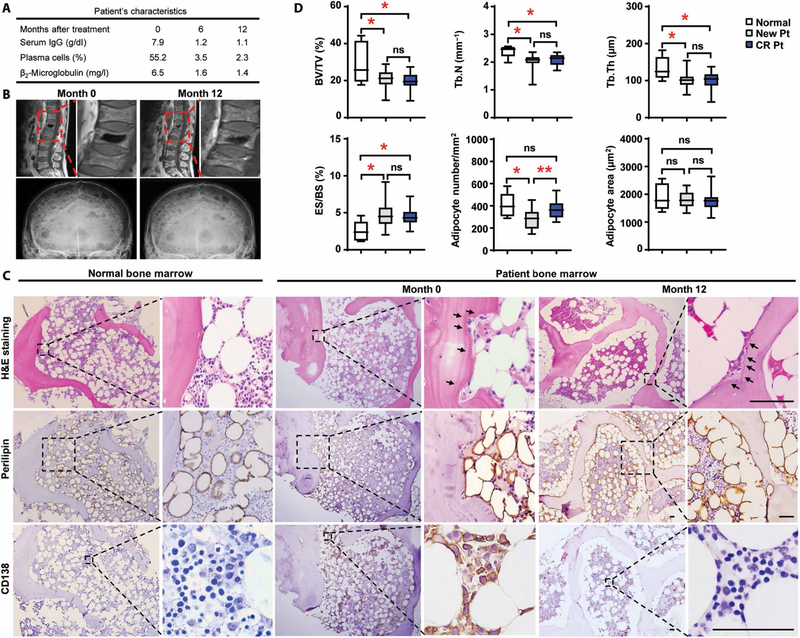
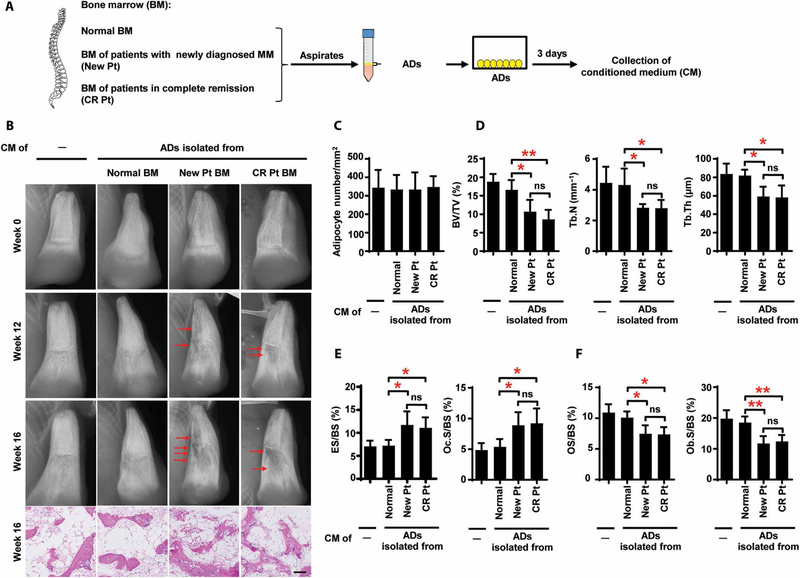
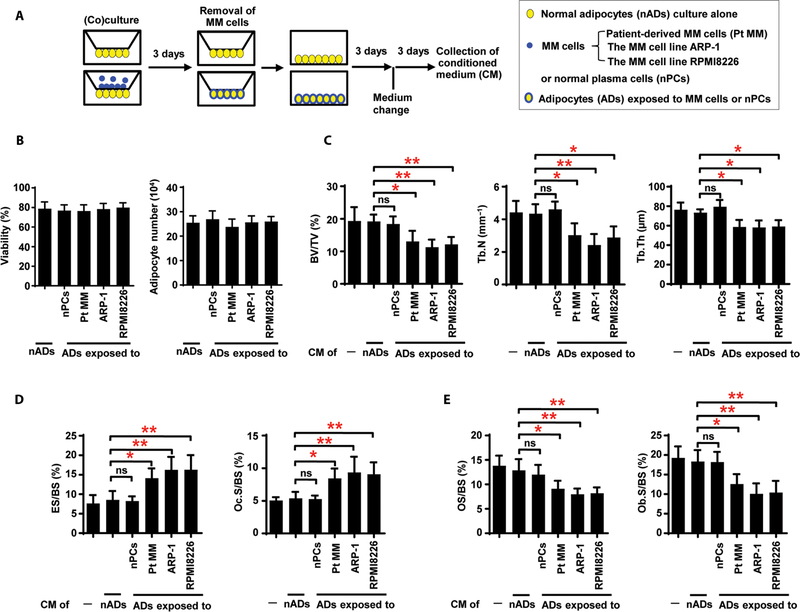
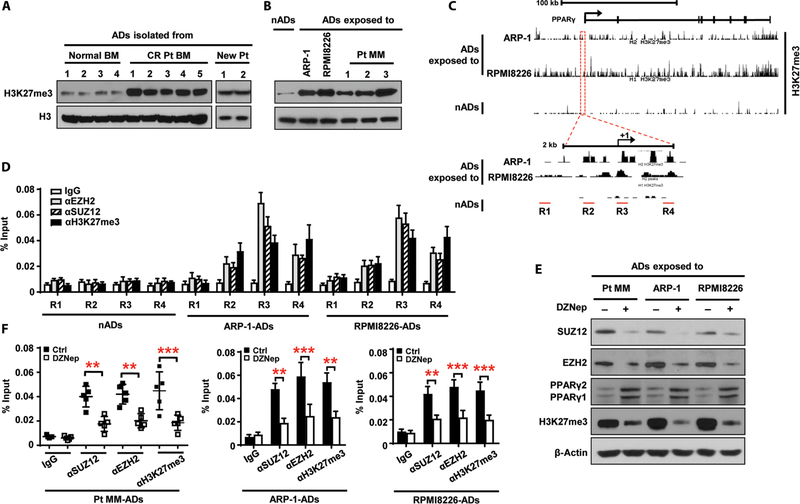
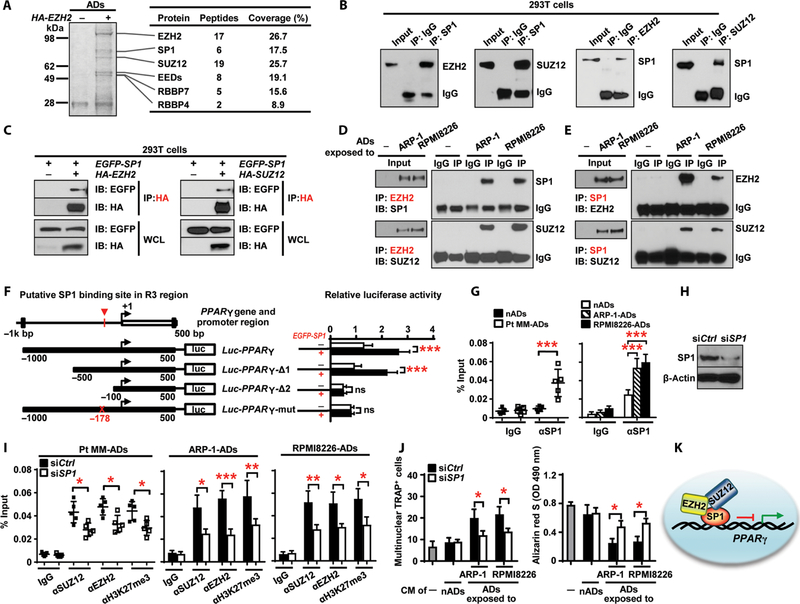
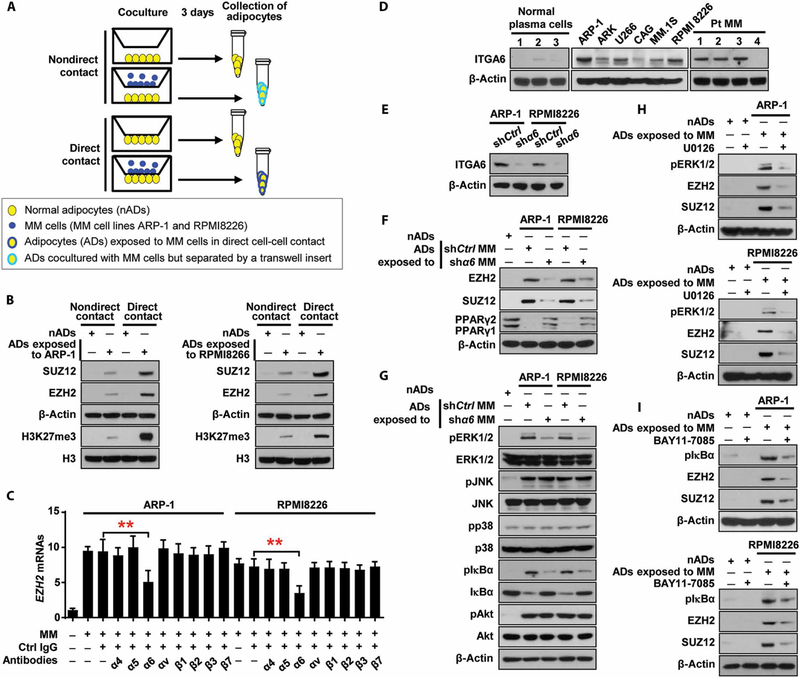
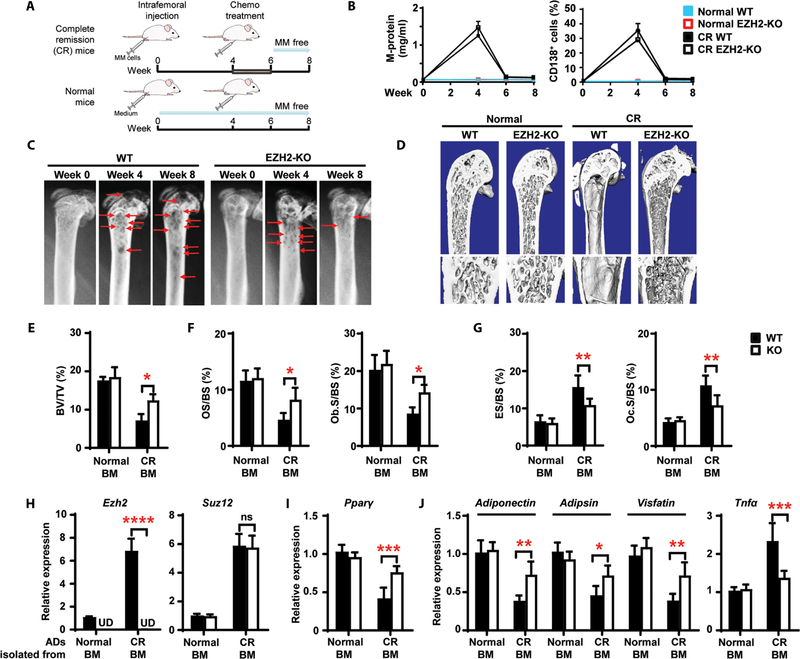
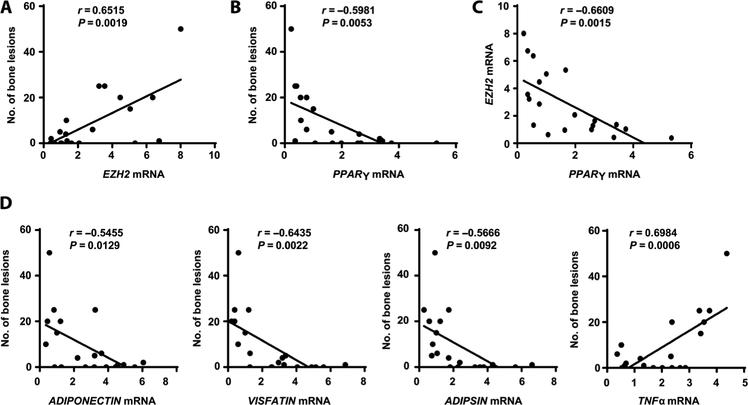
Osteolytic lesions in multiple myeloma are caused by osteoclast-mediated bone resorption and reduced bone formation. A unique feature of myeloma is a failure of bone healing after successful treatment. We observed adipocytes on trabecular bone near the resorbed area in successfully treated patients. Normal marrow adipocytes, when cocultured with myeloma cells, were reprogrammed and produced adipokines that activate osteoclastogenesis and suppress osteoblastogenesis. These adipocytes have reduced expression of peroxisome proliferator-activated receptor γ (PPARγ) mediated by recruitment of polycomb repressive complex 2 (PRC2), which modifies PPARγ promoter methylation at trimethyl lysine-27 histone H3. We confirmed the importance of methylation in the PPARγ promoter by demonstrating that adipocyte-specific knockout of EZH2, a member of the PRC2, prevents adipocyte reprogramming and reverses bone changes in a mouse model. We validated the strong correlation between the frequency of bone lesions and the expression of EZH2 in marrow adipocytes from patients in remission. These results define a role for adipocytes in genesis of myeloma-associated bone disease and that reversal of adipocyte reprogramming has therapeutic implications.


Conflict of interest statement

Competing interests: The authors declare that they have no competing interests.

Figures

Fig. 1.
Fig. 1.. Association of marrow adipocytes with bone lesion in patients with myeloma in remission.
(A to C) Samples were obtained from a patient in complete remission on the date of the diagnosis and at follow-up visits after chemotherapy. (A) Characterization of disease signs, serum immunoglobulin G (IgG) and β2-microglobulin values, and the frequency of marrow-infiltrated plasma cells in the patient with myeloma before (month 0) and after (months 6 and 12) treatment. (B) Representative images of magnetic resonance imaging scanning for lytic lesions in the spine (upper panels) and skull (lower panels). (C) Representative images of hematoxylin and eosin (H&E)–stained sections of normal BM or the BM from the patient with myeloma showing histological changes and images of immunohistochemical staining for perilipin (a lipid droplet marker) or CD138 (a myeloma marker) expression. Arrows, lytic areas. Scale bars, 50 μm. Each experiment was repeated three times. (D) Percentages of BV/TV, Tb.N, Tb.Th, and ES/BS; numbers of adipocytes per mm2 of tissue; and size of adipocytes (μm2) in the sections of normal BM (n = 6) and the BM of patients with newly diagnosed myeloma (New Pt) (n = 17) or patients in remission (CR Pt) (n = 17). ns, not significant; *P < 0.05; **P < 0.01. P values were determined using one-way analysis of variance (ANOVA).
Fig. 2.
Fig. 2.. Resorption of bone by marrow adipocytes isolated from patients with myeloma in vivo.
(A) Schematic for collection of the CM from cultures of adipocytes (ADs) isolated from BM. (B) Representative x-rays and images of H&E staining of bone chips from SCID-hu mice injected with the CM. Mice that received unconditioned medium served as controls. Red arrows, bone lesion. (C) Summarized quantification of adipocytes. Analysis of the bone chips using bone histomorphometry shows the percentages of BV/TV, Tb.N, and Tb.Th (D); the percentages of ES/BS and Oc.S/BS (E); and the percentages of OS/BS and Ob.S/BS (F). The data are averages ± SD (five mice per group, three replicate studies). *P < 0.05; **P < 0.01. P values were determined using one-way ANOVA.
Fig. 3.
Fig. 3.. Induction of bone resorption by adipocytes exposed to myeloma cells.
(A) Schematic for collection of adipocyte CM. Normal adipocytes (nADs) derived from healthy human MSCs were cocultured without or with normal plasma cells (nPCs) or myeloma cells. MM, multiple myeloma. (B) Viability and number of adipocytes in culture alone or cocultured with normal plasma cells or myeloma cells. (C to E) Bone histomorphometric analysis of the bone chips from SCID-hu mice injected with the CM shows the percentages of BV/TV, Tb.N, and Tb.Th (C); the percentages of ES/BS and Oc.S/BS (D); and the percentages of OS/BS and Ob.S/BS (E) in the implanted bone chips. The data are averages ± SD (five mice per group, three replicate studies). *P < 0.05; **P < 0.01. P values were determined using one way ANOVA.
Fig. 4.
Fig. 4.. Up-regulation of histone methylation in the PPARγ gene in myeloma-associated adipocytes.
(A and B) Western blots showing the expression of H3K27me3 in adipocytes isolated from normal BM (n = 4), the BM of patients in complete remission (CR Pt; n = 5), and the BM of patients with newly diagnosed myeloma (New Pt; n = 2) (A) and in normal adipocytes and adipocytes exposed to ARP-1, RPMI8226, or patient-derived myeloma cells (Pt MM; n = 3) (B). The expression of H3 protein served as loading controls. (C) Binding profile of ChIP-seq results for H3K27me3 in normal adipocytes and adipocytes exposed to myeloma cells in the PPARγ gene located in chromosome 3. Lower panel, enlarged view. R1 to R4, subregions covering promoter region and transcriptional starting site of the PPARγ gene. (D) ChIP assay showing the enrichment of EZH2, SUZ12, and H3K27me3 in normal adipocytes and adipocytes exposed to myeloma cells. (E) Western blots showing the expression of EZH2, SUZ12, PPARγ, and H3K27me3 in adipocytes exposed to myeloma cells with or without 1 μM 3-deazaneplanocin A (DZNep) treatment. β-Actin served as a loading control. (F) ChIP assay showing EZH2, SUZ12, and H3K27me3 enrichment in adipocytes exposed to Pt MM (n = 5), ARP-1, or RPMI8226 cells with or without DZNep. Data are averages ± SD. Each experiment was repeated three times. **P < 0.01; ***P < 0.001. All P values were determined using one-way ANOVA.
Fig. 5.
Fig. 5.. SP1 bridges the interaction between the PRC2 complex and PPARγ promoter.
(A) Analysis of immunoprecipitates of HA-EZH2 in adipocytes transfected with an HA-EZH2 plasmid using Coomassie blue staining and mass spectrometry. The proteins identified are indicated on the right. (B) Coimmunoprecipitation of EZH2 or SUZ12 with SP1 in HEK293T cells cotransfected with SP1 and either EZH2 or SUZ12 plasmid. (C) Pull-down of HA-EZH2 or HA-SUZ12 with EGFP-SP1 in HEK293T cells. WCL, whole-cell lysate. (D and E) Coimmunoprecipitation of EZH2 (D) or SP1 (E) in normal adipocytes or adipocytes exposed to myeloma cells. Data are representative of trip-licate blots. (F) Schematic of the PPARγ promoter luciferase reporter. Solid boxes, promoter region of PPARγ; red crosses, mutations of four nucleotides. The luciferase activity of Luc-PPARγ constructs was set to 1. (G) ChIP assay showing SP1 enrichment around −178 bp of the PPARγ promoter in normal adipocytes and adipocytes exposed to myeloma cells. (H) Western blotting showing the expression of SP1 in adipocytes transfected with SP1 siRNAs (siSP1). Nontargeted siRNA (siCtrl)–expressing adipocytes served as controls. (I) ChIP assay showing enrichment of SUZ12, EZH2, and H3K27me3 on PPARγ promoter in siCtrl and siSP1 adipocytes cocultured with Pt MM (n = 5), ARP-1, or RPMI8226 cells. (J) Formation of TRAP+ cells from preOCs and Alizarin red S staining for osteoblast differentiation from MSCs, cultured with the CM of normal adipocytes or myeloma-associated adipocytes. The cultures without the CM served as controls. OD, optical density. (K) Schematic of the recruitment of PRC2 complex by SP1 to the PPARγ promoter. Data are averages ± SD. Each experiment was repeated three times. *P < 0.05; **P < 0.01; ***P < 0.001. All P values were determined using one-way ANOVA.
Fig. 6.
Fig. 6.. Myeloma cell α6 enhances PRC2 expression through the ERK1/2 and NF-κB signaling pathways in adipocytes.
(A) Schematic of coculture systems. (B) Western blots showing the expression of EZH2 and SUZ12 in normal adipocytes or adipocytes exposed to myeloma cells through direct or nondirect contact manner. (C) Expression of EZH2 mRNAs in the adipocytes directly contacted with myeloma cells in the presence of blocking antibodies against integrins. (D) Western blots showing the expression of integrin α6 (ITGA6) in normal plasma cells isolated from normal BM (n = 3), primary myeloma cells isolated from patients (n = 4), and myeloma cell lines (n = 6). (E) Expression of ITGA6 in nonspecific or α 6 shRNA–expressing myeloma cells. (F and G) Western blots showing the expression of EZH2, SUZ12, and PPARγ (F) and the expression of nonphosphorylated or phosphorylated (p) kinases in the adipocytes cocultured with nonspecific or α6 shRNA–expressing myeloma cells for 24 hours (G). (H and I) Expression of pERK1/2, pIκBα, EZH2, and SUZ12 in the adipocytes treated without or with U0126 (H) or BAY11–7085 (I). The expression of β-actin served as loading controls. Data are averages ± SD. Each experiment was repeated three times. **P < 0.01. All P values were determined using one-way ANOVA.
Fig. 7.
Fig. 7.. Knockout of EZH2 in adipocytes heals resorbed bone in a mouse model of myeloma in remission.
Wild-type (WT) and adipocyte Ezh2-knockout (KO) mice were intrafemorally injected with the murine myeloma cell line Vk*MYC (1 × 10⁶ cells per mouse). After 4 weeks, bortezomib (1 mg/kg) and melphalan (2 mg/kg) were injected intraperitoneally into the mice thrice weekly for 2 weeks. Shown are the experimental schematic (A), the concentrations of M-protein in mouse sera, the percentages of marrow-infiltrated CD138+ myeloma cells (B), representative x-rays (C) of femurs from complete remission (CR) mice, and representative microcomputed tomography images of mouse femurs at week 8 (D). Red arrows, lytic lesions. (E to G) Percentages of BV/TV (E), OS/BS and Ob.S/BS (F), and ES/BS and Oc.S/BS (G) at week 8. (H to J) Relative mRNA expression for Ezh2 and Suz12 (H), Pparγ (I), and the adipokines Adiponectin, Adipsin, Visfatin, and Tnfα (J) in marrow adipocytes at week 8. Data are means ± SD (n = 5 mice per group, three replicate studies). UD, undetectable. *P < 0.05; **P < 0.01; ***P < 0.001; ****P < 0.0001. P values were determined using one-way ANOVA.
Fig. 8.
Fig. 8.. Association of PRC2 expression in marrow adipocytes with bone lesions in patients in remission.
Adipocytes were isolated from BM aspirates from 20 patients in remission, randomly selected, some with and some without bone lesions, to provide a representative sample of all patients in remission. Analysis of the number of bone lesions was performed by radiologists who were blinded to the molecular analysis results. Similarly, the laboratory person who performed the molecular analysis was blinded to the bone lesion results. Shown are the correlation coefficients for the numbers of bone lesions in the patients in remission and the mRNAs of EZH2 (A) and PPAR (B) and the correlation coefficient for the expression of EZH2 and PPARγ mRNA (C) in adipocytes isolated from patients’ BM. (D) Correlation coefficients for the numbers of bone lesions in the patients in remission and the expression of ADIPONECTIN, ADIPSIN, VISFATIN, and TNFα mRNA in patients’ BM adipocytes. The correlations were evaluated using Pearson coefficient. r, correlation coefficient. P values were determined using the Pearson correlation coefficient. Each point represents the analysis of a representative sample from the aggregate of adipocytes from one patient sample.

Comment in

References

    1. Palumbo A, Anderson K, Multiple myeloma. N. Engl. J. Med 364, 1046–1060 (2011). - PubMed
    1. Zangari M, Suva LJ, The effects of proteasome inhibitors on bone remodeling in multiple myeloma. Bone 86, 131–138 (2016). - PMC - PubMed
    1. Bruzzaniti A, Baron R, Molecular regulation of osteoclast activity. Rev. Endocr. Metab. Disord 7, 123–139 (2006). - PubMed
    1. Liu H, Liu Z, Du J, He J, Lin P, Amini B, Starbuck MW, Novane N, Shah JJ, Davis RE, Hou J, Gagel RF, Yang J, Thymidine phosphorylase exerts complex effects on bone resorption and formation in myeloma. Sci. Transl. Med 8, 353ra113 (2016). - PMC - PubMed
    1. Tian E, Zhan F, Walker R, Rasmussen E, Ma Y, Barlogie B, Shaughnessy JD Jr., The role of the Wnt-signaling antagonist DKK1 in the development of osteolytic lesions in multiple myeloma. N. Engl. J. Med 349, 2483–2494 (2003). - PubMed

Publication types

MeSH terms