. 2019 May 29;10(1):2356.
doi: 10.1038/s41467-019-10241-w.

Atypical function of a centrosomal module in WNT signalling drives contextual cancer cell motility

Affiliations

Atypical function of a centrosomal module in WNT signalling drives contextual cancer cell motility

Yi Luo et al. Nat Commun. .

Erratum in

Abstract

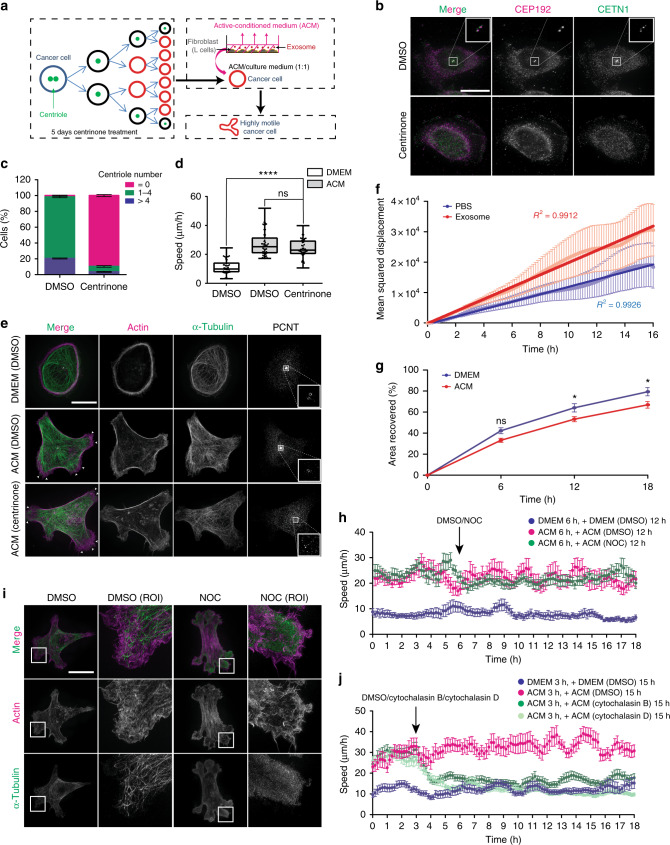
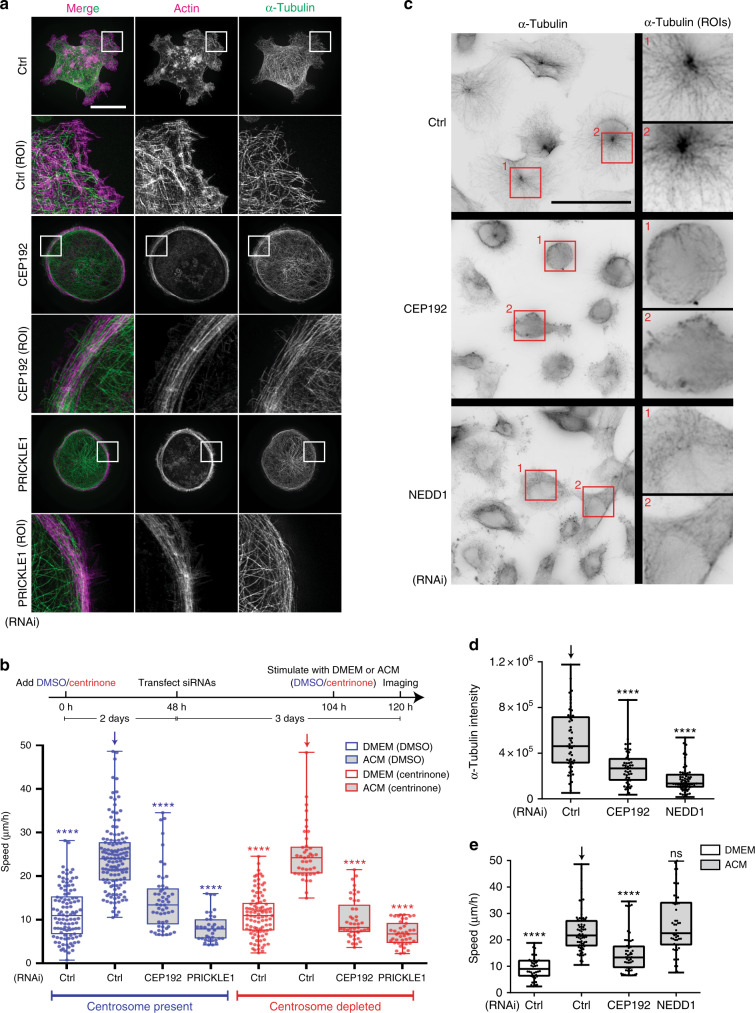
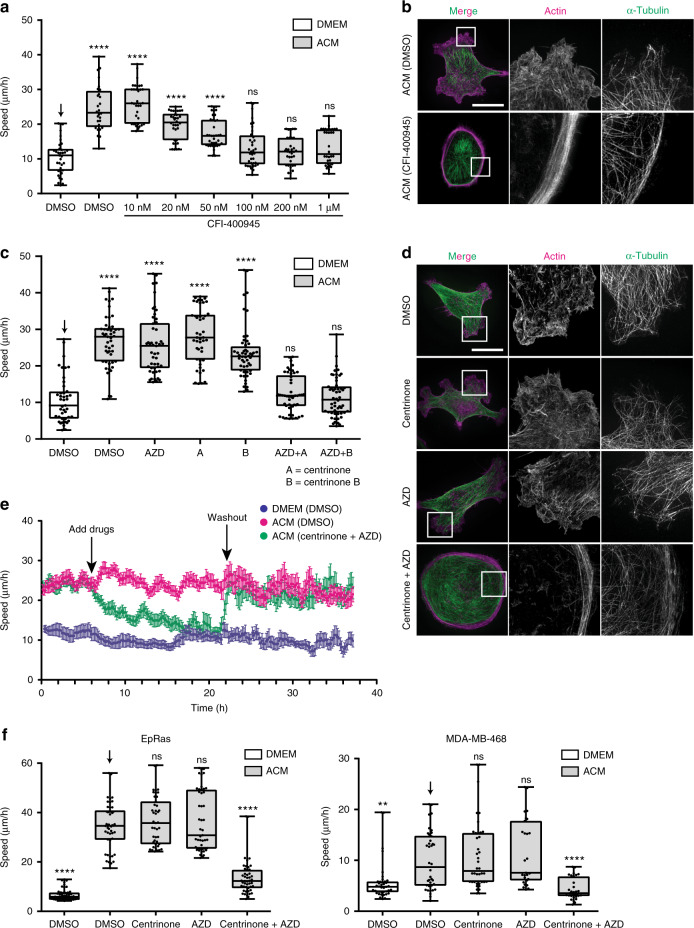
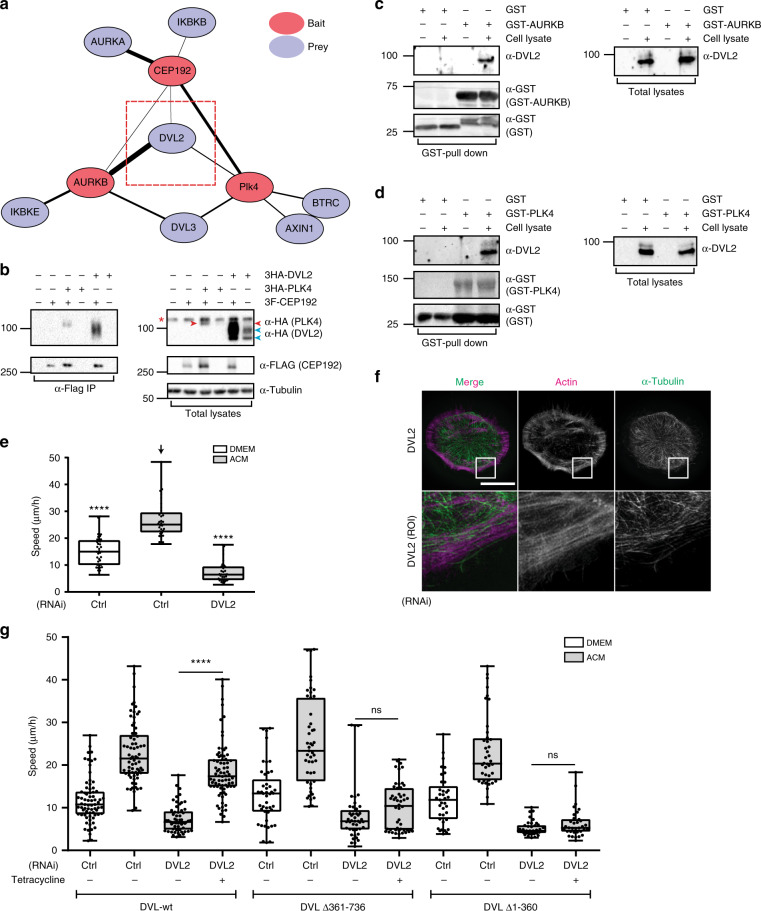
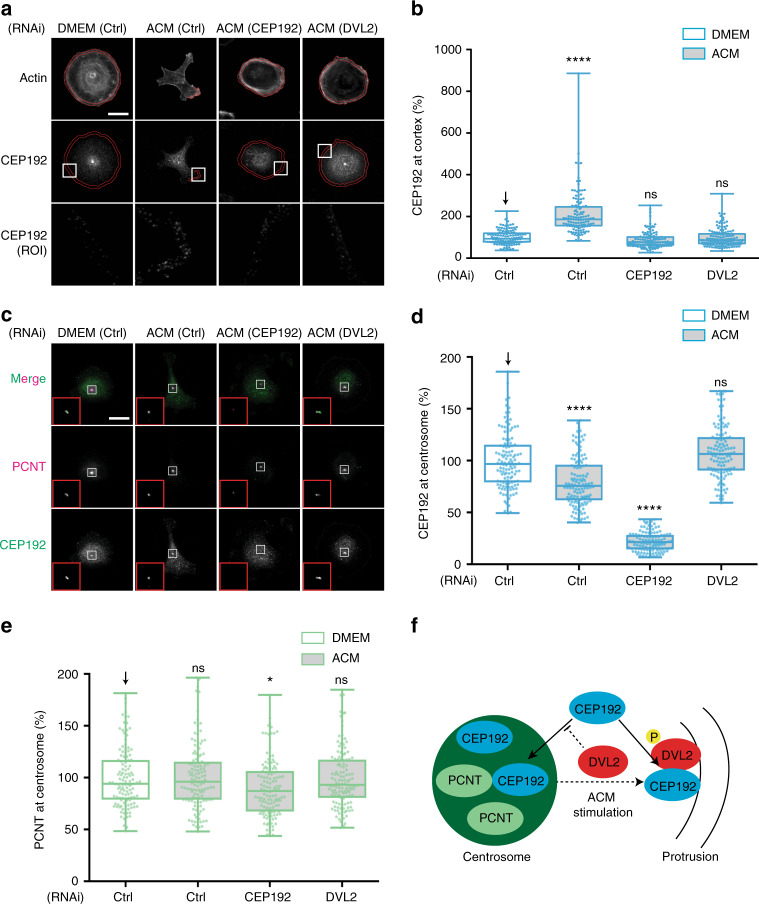
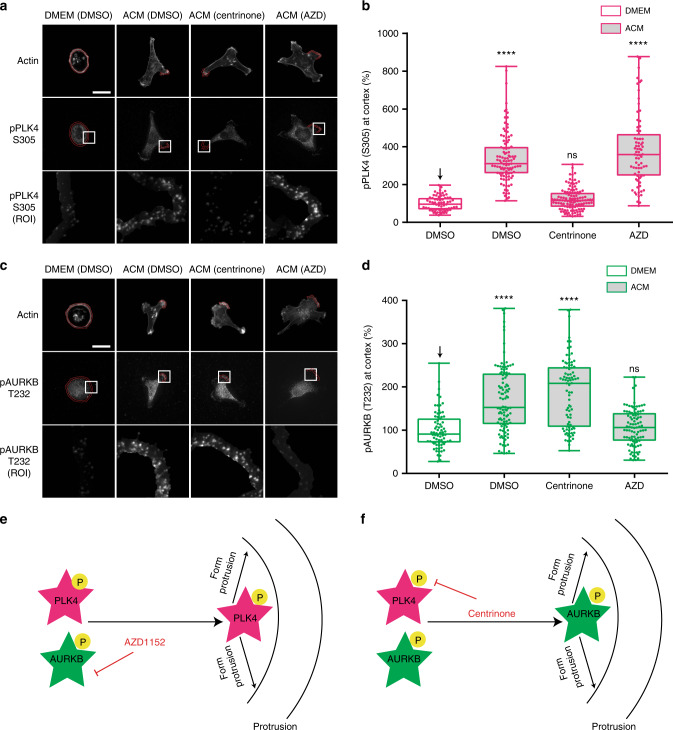
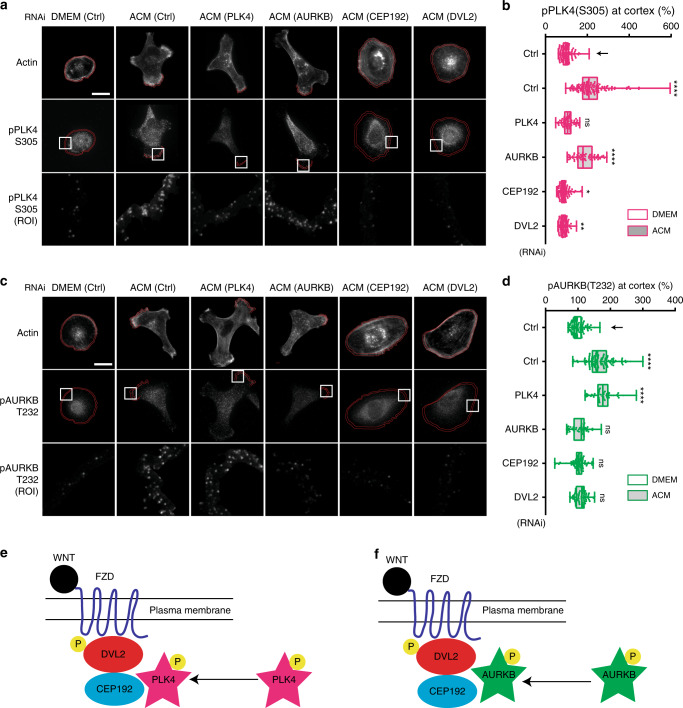
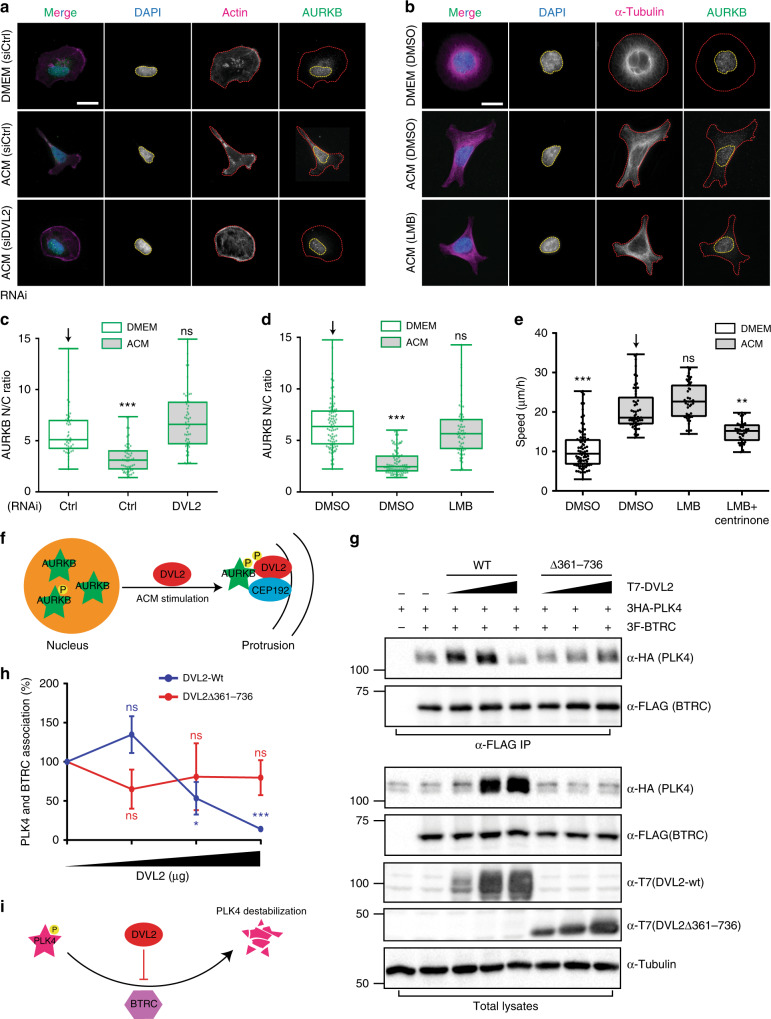
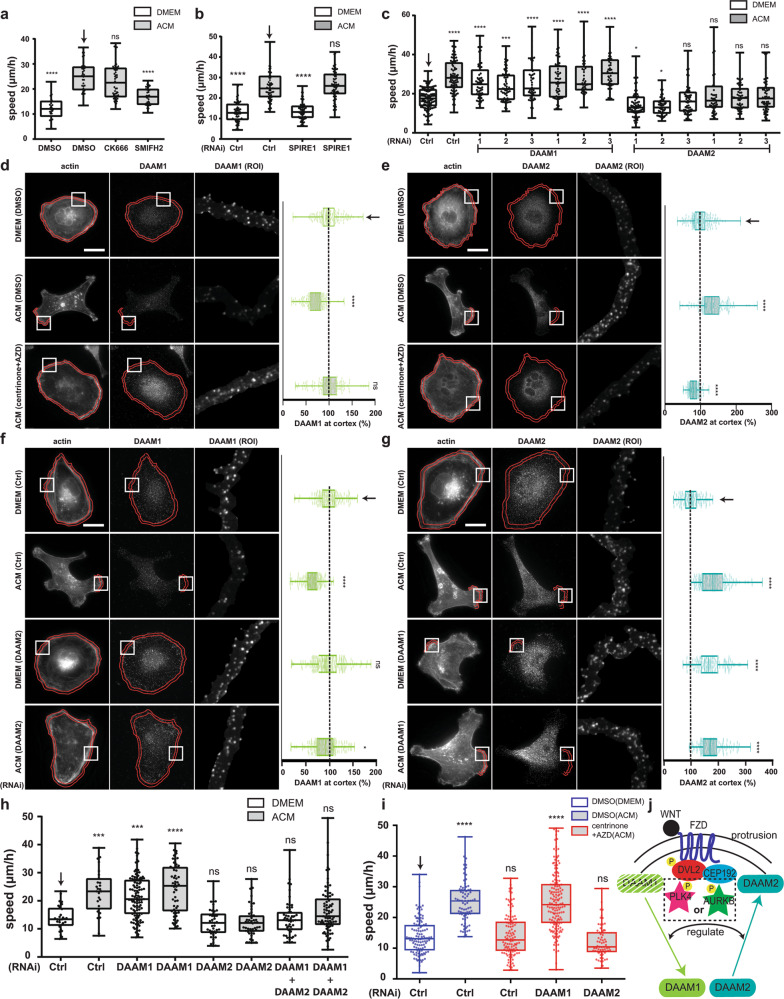
Centrosomes control cell motility, polarity and migration that is thought to be mediated by their microtubule-organizing capacity. Here we demonstrate that WNT signalling drives a distinct form of non-directional cell motility that requires a key centrosome module, but not microtubules or centrosomes. Upon exosome mobilization of PCP-proteins, we show that DVL2 orchestrates recruitment of a CEP192-PLK4/AURKB complex to the cell cortex where PLK4/AURKB act redundantly to drive protrusive activity and cell motility. This is mediated by coordination of formin-dependent actin remodelling through displacement of cortically localized DAAM1 for DAAM2. Furthermore, abnormal expression of PLK4, AURKB and DAAM1 is associated with poor outcomes in breast and bladder cancers. Thus, a centrosomal module plays an atypical function in WNT signalling and actin nucleation that is critical for cancer cell motility and is associated with more aggressive cancers. These studies have broad implications in how contextual signalling controls distinct modes of cell migration.


Conflict of interest statement

The authors declare no competing interests.

Figures

Fig. 1
Fig. 1
Exosomes stimulate actin-based non-directional migration in a centrosome and MT-independent manner. a Experimental schematic. MDA-MB-231 cells were treated with centrinone for 5 days to induce centrosome loss during division. Centrosome-less cells were treated with ACM. The protrusive activity and motility of individual cells were imaged and tracked. b MDA-MB-231 cells were treated with DMSO or centrinone for 5 days. CETN1 (centrioles) and CEP192 (centrosomes) staining is shown. Bar = 20 µm. c Percentage of cells from (b) with > 4 centrioles, 1 ≤ centrioles ≤ 4 and 0 centrioles (n = 3 independent experiments analysing at least 100 cells per each replicate). d MDA-MB-231 cells were treated with DMSO or centrinone for 5 days, followed by overnight incubation with the DMEM or ACM. Cell motility was measured as described in Methods and plotted as box and whiskers. Boxes represent median and 25th to 75th percentiles, whiskers the minimum and maximum values with each individual cell value superimposed. The data were compared with one-way ANOVA Kruskal–Wallis test and post-tested with Dunn’s multiple comparison test. Arrow indicates the control bar used for comparison (****p < 0.0001; n = 4, at least 50 cells were tracked per condition). e MDA-MB-231 cells from (d) were stained for α-tubulin, actin (phalloidin) and centrosomes (PCNT). Arrowhead indicates cell protrusion. Bar = 20 µm, inset box 3.88 × 3.88 μm (n = 3). f Mean-squared displacement (MSD) of cells stimulated with PBS (light blue) or purified exosomes (light red). Linear regression analysis of MSD was preformed (dark blue line is PBS, dark red line is purified exosomes). MSD R2 = 1 indicates a total random movement (n = 3, at least 40 cells were tracked per condition). g Quantitative data from wound-healing assay on MDA-MB-231 cells treated overnight with DMEM or ACM are shown in Supplementary Fig. 1e. Graph shows mean area recovered. The data were analysed with two-way ANOVA post-tested with Bonferroni test (*p < 0.05; n = 3, at least 30 regions were measured per condition). h MDA-MB-231 cells were stimulated with DMEM or ACM overnight. Cell motility was tracked for 6 h. Then, the same cells were further tracked after being treated with DMSO or Nocodazole for 12 h. Running average speed was plotted (n = 3, at least 40 cells were tracked per condition). i MDA-MB-231 cells were stimulated with ACM overnight. DMSO or NOC were added for the last 2 h of stimulation. Actin (red) and α-tubulin (green) staining are shown. Region of interest (ROI) shows the enlarged area of the selected cell protrusion. Bar = 20 µm (n = 3) j MDA-MB-231 cells were stimulated with DMEM or ACM overnight. Cell motility was tracked for 3 h, then cells were treated with DMSO, cytochalasin B or cytochalasin D and further tracked for 15 h. Running average speed was plotted (n = 3, at least 40 cells were tracked per condition). The data from c, f, g, h and j are plotted as mean ± s.e.m.
Fig. 2
Fig. 2
Non-centrosomal pool of CEP192 controls ACM-induced motility. a MDA-MB-231 cells were transfected with Control (Ctrl), CEP192 or PRICKLE1 siRNAs for 72 h and then stimulated with ACM overnight. Cells were then stained for α-tubulin and actin. Region of Interest (ROI) panels show the enlarged box area at the cell cortex or protrusions. Bar = 20 µm (n = 3). b MDA-MB-231 cells were treated with DMSO or centrinone for 5 days. Two days after drug addition, cells were transfected with the indicated siRNAs and further incubated for 3 days. Cells were then treated with DMEM or ACM overnight at the end of the 5-day incubation and time-lapse images were taken to track cell motility (****p < 0.0001; n = 3, at least 50 cells were measured per condition). c MDA-MB-231 cells were transfected with siRNAs for 72 h. Next, cells were put on ice for 30 min, followed by recovery at 37 oC for 20 s. Cells were then fixed and stained for PCNT and α-tubulin. ROI panels show enlarged area at microtubule-organising centre (MTOC). Bar = 50 µm. d α-tubulin intensity at MTOC (mask defined by PCNT signal) in cells from (c) was measured from three independent experiments. (****p < 0.0001; n = 3, at least 50 cells were measured per condition). e Cell motility was measured as average speed in MDA-MB-231 cells transfected for 72 h with the indicated siRNAs and then treated with DMEM or ACM overnight (****p < 0.001; n = 3, at least 50 cells were tracked per condition). All the data were plotted as box and whiskers. Boxes represent median and 25th to 75th percentiles, whiskers the minimum and maximum values with each individual cell value superimposed. The data were compared with one-way ANOVA Kruskal–Wallis test and post-tested with Dunn’s multiple comparison test. Arrow indicates the control bar used for comparison
Fig. 3
Fig. 3
PLK4 and AURKB/C redundantly modulate ACM-induced cancer cell motility. a MDA-MB-231 cells were treated with DMSO or different concentrations of CFI-400945 (PLK4 and AURKB/C inhibitor), in the presence of DMEM or ACM (****p < 0.0001; n = 3, at least 50 cells were tracked per condition). b MDA-MB-231 cells were treated with DMSO or 100 nM CFI-400945 in the presence of ACM stimulation. Cells were stained for α-tubulin and actin, and enlarged images showed a cortical region of the cell. Bar = 20 µm (n = 3). c MDA-MB-231 cells were treated with centrinone, centrinone B (PLK4 inhibitors), AZD (AURKB/C inhibitor) or their combination, in the presence of DMEM or ACM overnight (***p < 0.0001; n = 3, at least 50 cells were tracked per condition). d Cells from (c) were stained for α-tubulin and actin, and cortical regions were enlarged on right side panels. Bar = 20 µm. e Cells were incubated with DMEM or ACM overnight. At 6 h of taking time-lapse images, DMSO or inhibitors were added to cells and incubation continued for 14 h more, then DMSO or inhibitors were washed out and cells were further incubated in DMEM or ACM for another 16 h. Running average speed was plotted as mean ± s.e.m. (n = 4, at least 50 cells were tracked per condition) f Breast cancer cell lines EpRas and MDA-MB-468 were treated with DMEM or ACM in the presence of DMSO or inhibitors (**p < 0.01, ****p < 0.0001; n = 3, at least 40 cells were tracked per condition). All the data were plotted as box and whiskers. Boxes represent median and 25th to 75th percentiles, whiskers the minimum and maximum values with each individual cell value superimposed. The data were compared with one-way ANOVA Kruskal–Wallis test and post-tested with Dunn’s multiple comparison test. Arrow indicates the control bar used for comparison
Fig. 4
Fig. 4
Dishevelled 2 controls ACM-induced cancer cell motility by binding to PLK4, AURKB and CEP192. a Network graph for selected protein interactions identified from a LUMIER screen testing CEP192, PLK4 and AURKs against a collection of 3 Flag-tagged WNT-PCP and centrosomal factors. Edge width reflects the normalised LUMIER intensity ratio that indicates interaction strength (n = 2). b HEK293T cells were co-transfected with 3Flag-CEP192 and 3HA-PLK4 (positive control) or 3HA-DVL2 as indicated. Cell lysates were immunoprecipitated with anti-Flag antibody and 3HA-DVL2 or 3HA-PLK4 were detected by western blotting. Red arrowhead indicates band corresponding to 3HA-PLK4, blue arrowheads indicate 3HA-DVL2 bands (non-phosphorylated and phosphorylated forms), red star on the left side indicates non-specific band (n = 3). c, d GST, GST-AURKB (c) and GST-PLK4 (d) were bacterially expressed, purified and incubated with or without cell lysates from MDA-MB-231 cells. GST pull down was performed and endogenous DVL2 was detected by western blotting. (n = 4 for each). e MDA-MB-231 cells were treated with control or DVL2 siRNAs for 72 h and then stimulated with DMEM or ACM overnight. Cell motility was measured as described in Methods and analysed with one-way ANOVA Kruskal–Wallis test and post-tested with Dunn’s multiple comparison test. Arrow indicates the control bar used for comparison (****p < 0.0001; n = 3, at least 40 cells were tracked per condition). f Cells from (e) were stained with actin and α-tubulin. Enlarged box areas of cortical regions are shown as ROIs in lower panels. Bar = 20 µm (n = 3). g MDA-MB-231 cells stably expressing tetracycline inducible C-terminally HA-tagged DVL2-wt, DVL2-N terminus (Δ361–736) or DVL2-C terminus (Δ1–360) were transfected with control or DVL2 siRNA. After 72 h, cells were treated with or without tetracycline in the presence of DMEM or ACM as indicated. Cell motility was measured as described in Methods and analysed by Mann–Whitney U test two-tailed (****p < 0.0001; n = 3, at least 50 cells were tracked per condition). All the data are plotted as box and whiskers. Boxes represent median and 25th to 75th percentiles, whiskers the minimum and maximum values with each individual cell value superimposed
Fig. 5
Fig. 5
DVL2 orchestrates the recruitment of CEP192 at protrusions. a, c MDA-MB-231 cells were transfected with control, CEP192 or DVL2 siRNAs for 72 h, and then stimulated overnight with DMEM or ACM. Cells were stained for (a) CEP192 and actin, or (c) CEP192 and PCNT. Bar = 20 µm. b, d, e Intensity of CEP192 at cell cortex (b), at centrosome (d), and PCNT signal at centrosome (e) was measured as described in Methods and plotted as box and whiskers. Boxes represent median and 25th to 75th percentiles, whiskers the minimum and maximum values with each individual value superimposed. The data were compared with one-way ANOVA Kruskal–Wallis test and post-tested with Dunn’s multiple comparison test. Arrow indicates the control bar used for comparison. (*p < 0.05, ****p < 0.0001; n = 3, at least 60 cells were measured per condition). Light blue is CEP192, light green is PCNT. f Model for regulation of centrosomal and cortical CEP192 pools by DVL2
Fig. 6
Fig. 6
PLK4 and AURKB accumulation at cell protrusions depends on their specific activity. a, c MDA-MB-231 cells were stimulated with DMEM or ACM in the presence of DMSO, centrinone or AZD. Cells were stained for actin and (a) phospho-PLK4 (S305), or (c) phospho-AURKB (T232). Bar = 20 µm. b, d Intensity at cortical region for (b) phospho-PLK4 (S305), or (d) phospho-AURKB (T232) from cells in (a) and (c) was measured. The data was analysed as described in Methods and plotted as box and-whiskers. Boxes represent median and 25th to 75th percentiles, whiskers the minimum and maximum values with each individual value superimposed. The data were compared with one-way ANOVA Kruskal–Wallis test and post-tested with Dunn’s multiple comparison test. Arrow indicates the control bar used for comparison (****p < 0.0001; n = 3, at least 60 cells were measured per condition). Magenta is phospho-PLK4, dark green is phospho-AURKB. Models for phospho-PLK4 (S305) (e) and phospho-AURKB (T232) (f) localisation at the cell cortex to promote protrusion formation that occurs independently from the other kinase activity
Fig. 7
Fig. 7
DVL2 and CEP192 orchestrate the recruitment of PLK4 and AURKB at cell protrusions. a, c MDA-MB-231 cells transfected with control, PLK4, AURKB, CEP192 or DVL2 siRNAs were stimulated overnight with DMEM or ACM. Cells were stained for actin and (a) phospho-PLK4 (S305), or (c) phospho-AURKB (T232). Bar = 20 µm. b, d Intensity of (b) phospho-PLK4 (S305), or (d) phospho-AURKB (T232) at cortical regions was measured from cells in (a) and (c), and plotted as box and whiskers. Boxes represent median and 25th to 75th percentiles, whiskers the minimum and maximum values with each individual value superimposed. The data are compared with one-way ANOVA Kruskal–Wallis test and post-tested with Dunn’s multiple comparison test. Arrow indicates the control bar used for comparison (*p < 0.05, **p < 0.01, ****p < 0. 0001; n = 3, at least 60 cells were measured per condition). Magenta is phospho-PLK4, dark green is phospho-AURKB. Models for (e) phospho-PLK4 (S305) and (f) phospho-AURKB (T232) recruitment and localisation at the cell cortex to promote protrusion formation via DVL2 and CEP192
Fig. 8
Fig. 8
DVL2 facilitates AURKB export from the nucleus and PLK4 stabilisation. a MDA-MB-231 cells were treated with control or DVL2 siRNAs for 72 h, and then stimulated overnight with DMEM or ACM. Cells were stained for actin, AURKB and nucleus (DAPI). Bar = 20 µm. b MDA-MB-231 cells were stimulated overnight with DMEM or ACM in the presence of DMSO or Leptomycin (LMB), a nuclear export inhibitor. Cells were stained with α-tubulin, AURKB and DAPI. Bar = 20 µm. c, d Quantification of the nuclear to cytoplasmic (N/C) ratio of AURKB from cells in (a) and (b), respectively. The data were plotted as described in Methods (***p < 0. 001; n = 3, at least 60 cells were measured per condition). e Cells were stimulated overnight with DMEM or ACM in the presence of DMSO, LMB or LMB + centrinone. Cell motility was measured as described in Methods (**p < 0.01, ***p < 0.001; n = 3, at least 40 cells were tracked per condition). f Model for DVL2 regulation of the nuclear and cytoplasmic/cortical pools of AURKB. g HEK293T cells were transfected with 3HA-PLK4, 3 Flag-BTRC and increasing amounts of T7-DVL2-wt or T7-DVL2 (Δ361–736) mutant. Co-immunoprecipitation was performed using anti-Flag antibody. h Quantification of the binding between PLK4 and BTRC in the presence of increasing amounts of DVL2 is shown as average signal ratio of HA-PLK4/3F-BTRC in immunoprecipitates. Data were analysed with two-way ANOVA post-tested with Bonferroni test (n = 4, error bars are ± s.e.m.). i Model for DVL2-mediated PLK4 stabilisation. The data from c, d and e were plotted as box and whiskers. Boxes represent median and 25th to 75th percentiles, whiskers the minimum and maximum values with each individual cell value superimposed. Data were compared with one-way ANOVA Kruskal–Wallis test and post-tested with Dunn’s multiple comparison test. Arrow indicates the control bar used for comparison
Fig. 9
Fig. 9
PLK4 and AURKB regulate cell motility through DAAMs. a MDA-MB-231 cells were stimulated overnight with DMEM or ACM in the presence of DMSO, CK666 (ARP2/3 inhibitor) or SMIFH2 (formin inhibitor). b Cells were transfected with control or SPIRE1 (actin nucleator) siRNAs for 72 h and then treated overnight with DMEM or ACM. Cell motility from cells in (a) and (b) was measured as described (****p < 0.0001; n = 3, at least 50 cells were tracked per condition). c Cells were transfected with control, DAAM1 or DAAM2 individual siRNA oligos for 72 h and then stimulated overnight with DMEM or ACM as indicated. Cell motility was measured as described in Methods (*p < 0.05, ***p < 0.001, ****p < 0.0001; n = 3, at least 50 cells were tracked per condition). d, e MDA-MB-231 cells were stimulated with DMEM or ACM in the presence of DMSO or centrinone + AZD as indicated. Cells were stained for actin and (d) DAAM1, or (e) DAAM2. Bar = 20 µm. Right side box and whiskers plots show the quantification of average signal intensity at the cell cortex, which was measured as described in Methods. Light green is DAAM1, teal is DAAM2 (****p < 0.0001; n = 3, at least 60 cells were measured per condition). f, g Cells were transfected with control, DAAM2 or DAAM1 siRNAs for 72 h, and then stimulated overnight with DMEM or ACM as indicated. Cells were stained for actin and (f) DAAM1, or (g) DAAM2. Bar = 20 µm. Right side plots show the average signal intensity at cortical region for DAAM1 (light green) or DAAM2 (teal), which was measured and plotted as described in Methods (*p < 0.05, ****p < 0.0001; n = 3, at least 60 cells were measured per condition). h MDA-MB-231 cells were transfected with control, DAAM1, DAAM2 siRNAs or the indicated combinations for 72 h and then stimulated overnight with DMEM or ACM. Cell motility was measured as described (***p < 0.001, ****p < 0.0001; n = 3, at least 60 cells were measured per condition). i MDA-MB-231 cells were transfected with control, DAAM1 or DAAM2 siRNAs for 72 h and then stimulated overnight with DMEM or ACM in the presence of DMSO or centrinone + AZD. Cell motility was measured as described (***p < 0.001; n = 3, at least 60 cells were tracked per condition). j Model for DAAM1 and DAAM2 localisation switch at cell cortex upon ACM treatment regulated by PLK4 and AURKB. All the data were plotted as box and whiskers. Boxes represent median and 25th to 75th percentiles, whiskers the minimum and maximum values with each individual cell value superimposed. The data were compared with one-way ANOVA Kruskal–Wallis test and post-tested with Dunn’s multiple comparison test. Arrow indicates the control bar used for comparison

Similar articles

Cited by

References

    1. Friedl, P. & Alexander, S. Cancer invasion and the microenvironment: plasticity and reciprocity. Cell147, 992–1009 (2011). - PubMed
    1. Yilmaz, M. & Christofori, G. Mechanisms of motility in metastasizing cells. Mol. Cancer Res8, 629–642 (2010). - PubMed
    1. Ridley, A. Life at the leading edge. Cell145, 1012–1022 (2011). - PubMed
    1. Goode, B. & Eck, M. Mechanism and function of formins in the control of actin assembly. Annu Rev. Biochem76, 593–627 (2007). - PubMed
    1. Yamaguchi, H. & Condeelis, J. Regulation of the actin cytoskeleton in cancer cell migration and invasion. Biochim Biophys. Acta1773, 642–652 (2007). - PMC - PubMed

Publication types

MeSH terms