Comparative Study
. 2019 May 29;9(1):8025.
doi: 10.1038/s41598-019-44485-9.

Herbo-mineral formulation 'Ashwashila' attenuates rheumatoid arthritis symptoms in collagen-antibody-induced arthritis (CAIA) mice model

Affiliations
Comparative Study

Herbo-mineral formulation 'Ashwashila' attenuates rheumatoid arthritis symptoms in collagen-antibody-induced arthritis (CAIA) mice model

Acharya Balkrishna et al. Sci Rep. .

Abstract

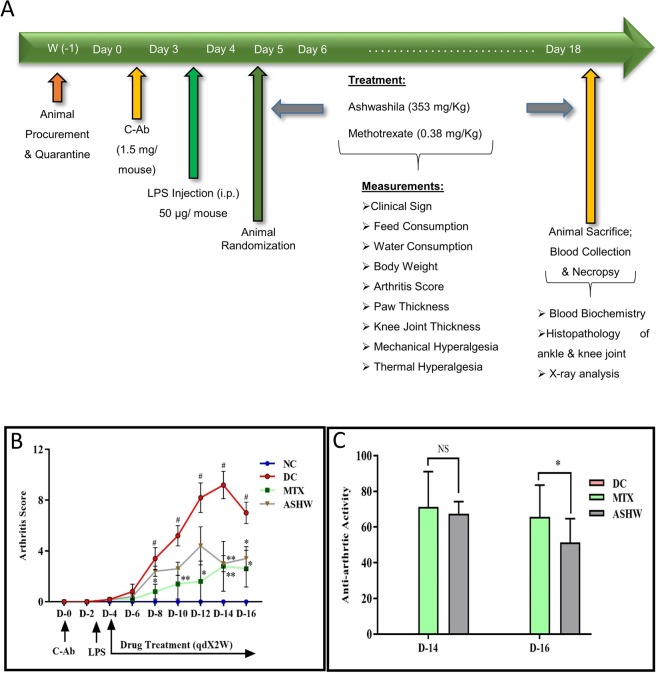
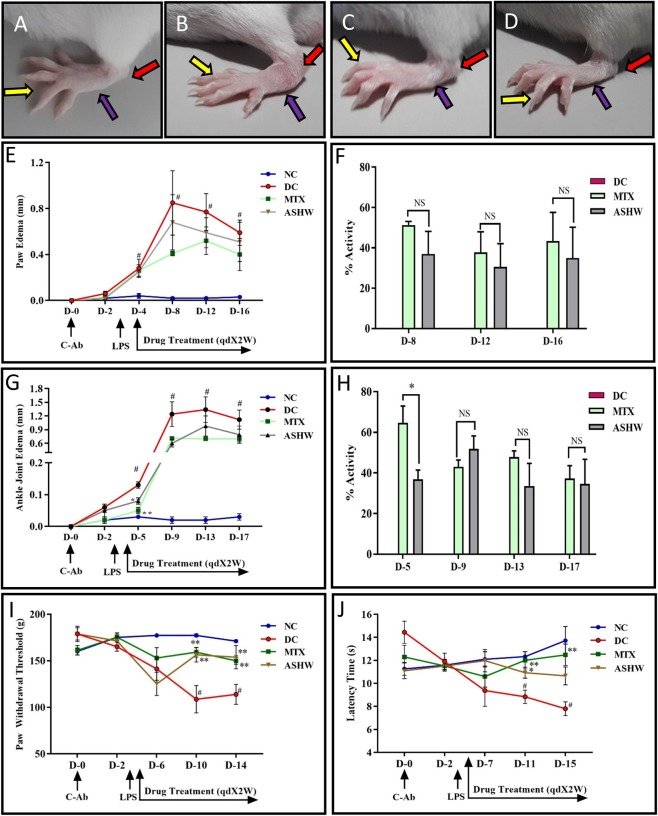
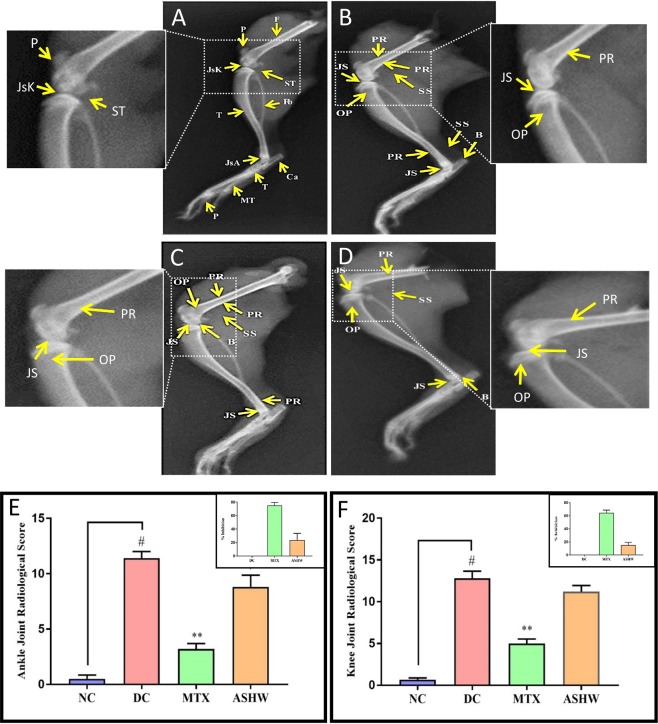
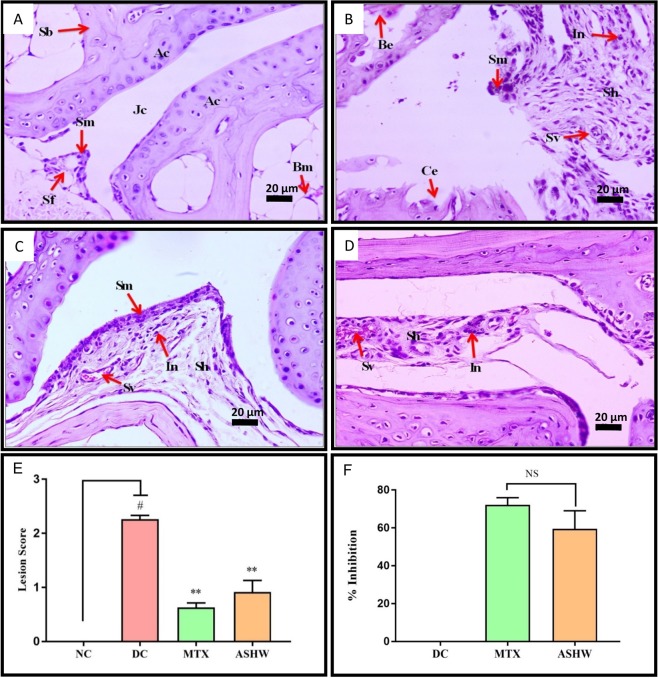
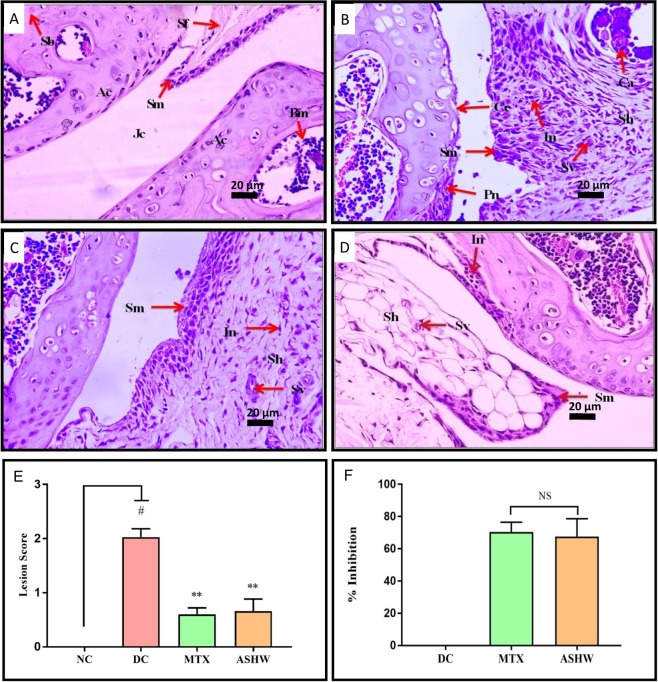
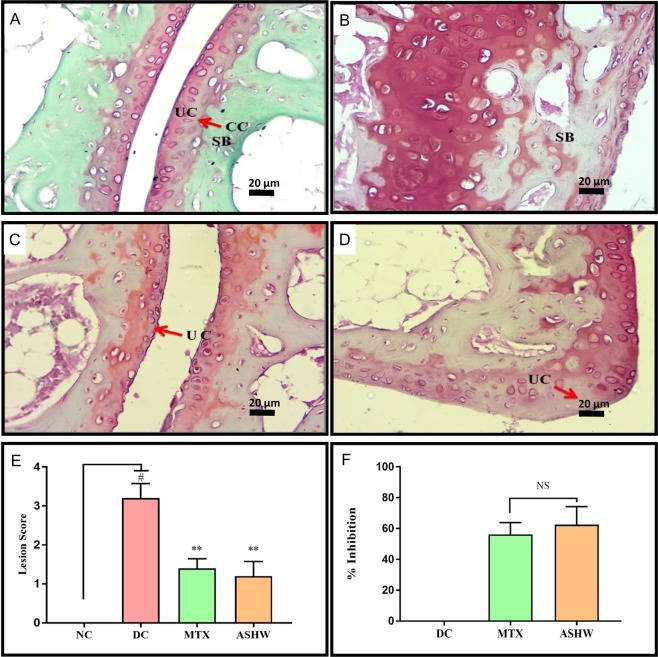
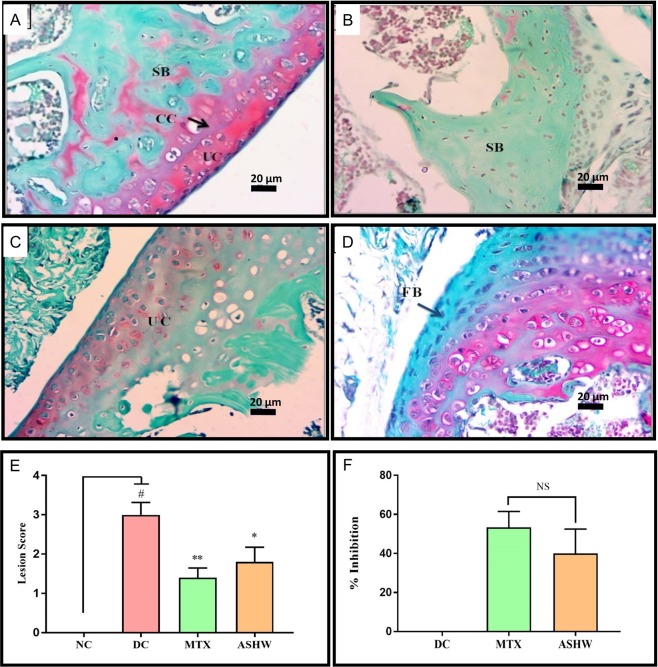
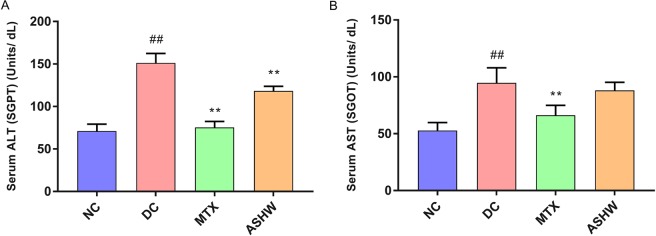
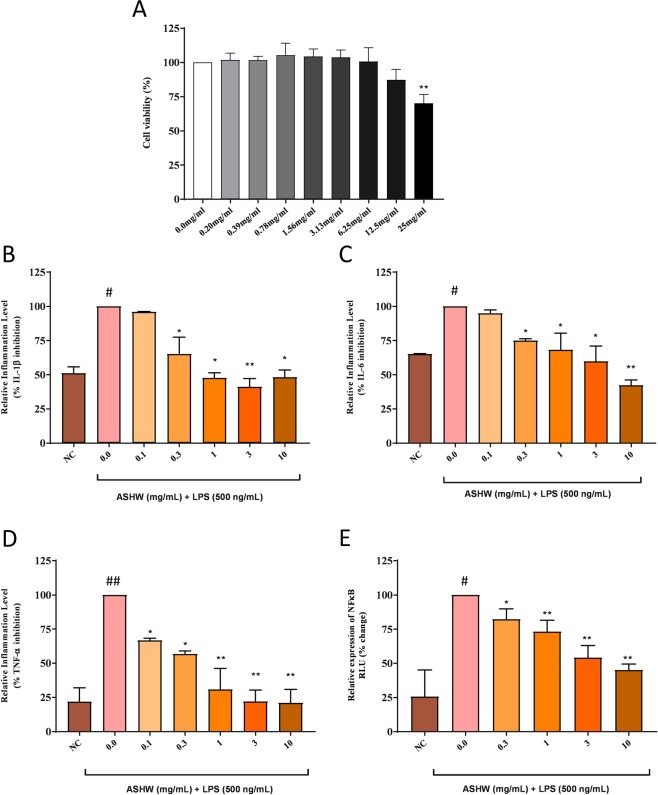
Rheumatoid arthritis (RA) is a chronic inflammatory autoimmune disorder that affects joints of hands and feet and introduces injury in secondary organs such as cardiac tissue. In the present study, we induced RA in male Balb/c mice (CAIA) using collagen-antibody cocktail (C-Ab) and lipopolysaccharide intraperitoneal injections. Induction of RA in the animals was detected through the loss of body weight, food, and water consumption, pedal edema, increased arthritis score of the paw and ankle, increase in radiological and histological lesion score of ankle and knee joints and enhanced pain perception in the C-Ab induced RA animals. Ashwashila is a herbo-mineral medicine from Indian Ayurvedic system. Human equivalent doses of Ashwashila (ASHW) and standard of care, Methotrexate were given to the CAIA animals for two weeks. ASHW treatment significantly reversed the effect of C-Ab with reduced pedal edema, arthritis score, radiological and histological lesion scores in ankle-joint, knee-joint and articular cartilage, reduced pain perception. These effects were comparable with the Methotrexate treatment. In human monocytic (THP-1) cells, ASHW was found to be biocompatible at in-vitro test doses. The anti-arthritis mechanism of action for ASHW was established through the suppression of pro-inflammatory cytokines such as IL-1β, IL-6, TNF-α; and upstream regulator, NF-κB. Taken together, we show the pre-clinical efficacy of ASHW in reducing RA associated symptoms by controlling inflammation and suggest it as a potential therapeutic candidate for rheumatoid arthritis.


Conflict of interest statement

The authors declare no competing interests.

Figures

Figure 1
Figure 1
Study Design and Modulation of Arthritis Score by Ashwashila. (A) Male Balb/c mice of 6–8 weeks’ age were injected intraperitoneally with 1.5 mg/mouse dose of anti-collagen antibody (C-Ab) cocktail and 50 µg/mouse of bacterial lipopolysaccharide (LPS). All the disease and treatment group animals were selected randomly from the C-ab induced arthritis (CAIA) animals. The normal (NC) and disease control (DC) animals were treated with sodium carboxymethyl cellulose (Na-CMC) while the treatment group CAIA mice were treated with 353 mg/kg oral dose of ASHW and 0.38 mg/kg oral dose of MTX given every alternate day for two weeks. Physical and clinical parameters of the animals were measured every day throughout the experimental duration. (B) Arthritis score showed an increase in the CAIA animals indicating the onset of RA. Treatment of the CAIA mice with ASHW and MTX significantly reduced the arthritis score indicating a reduction in pedal swellings. (C) Anti-arthritic activity analysis based on the arthritis score showed similar efficacy for both ASHW and MTX except on day 16. Results represent Mean ± SEM. A one-way analysis of variance (ANOVA) followed by Dunnett’s multiple comparison t-test was used to calculate the statistical difference. Student unpaired t-test was used to calculate the statistical difference in comparison to MTX (p-value * ≤ 0.05; ** ≤ 0.01).
Figure 2
Figure 2
Paw and Ankle Edema Modification by Ashwashila. (A) Normal control (NC) Balb/c mice showing digits (yellow arrow), foot (blue arrow) and ankle (red arrow). (B) Development of digits, foot and ankle edema in collagen antibody-induced arthritis (CAIA) disease control (DC) animal. (C) Reduction in the inflammation of digits, foot and ankle edema in CAIA mice treated with 353 mg/kg dose of Ashwashila (ASHW) every day for two weeks. (D) Reduction in inflammation of digits, foot and ankle edema in CAIA mice treated with 0.38 mg/kg dose of Methotrexate (MTX) every alternate day for two weeks (MTX). (E) Increase in paw edema of the observed in the CAIA animals. Treatment of the CAIA mice with ASHW or MTX induced significant reduction in the paw edema. (F) Percentage (%) activity of the ASHW or MTX treatments in reducing paw edema in the CAIA animals indicated similar efficacy. (G) Increase in ankle-joint edema was observed in the CAIA animals. Treatment with ASHW or MTX significantly reduced the ankle-joint edema in the CAIA animals. (H) Percentage (%) activity of the ASHW or MTX treatments in reducing knee-joint edema in the CAIA animals indicated similar efficacy. (I) Paw withdrawal threshold was measured using Randall Selitto (Mechanical hyperalgesia) parameter. The results showed a significant increase in the paw withdrawal threshold in the CAIA animals. Increase in mechanical hyperalgesia was recovered in the CAIA animals treated with Ashwashila (ASHW) and Methotrexate (MTX). (J) Thermal hyperalgesia test showed reduced in the latency time of CAIA animals followed by significant recovery when treated with ASHW and MTX. Values in the results are Mean ± SEM. A one-way analysis of variance (ANOVA) followed by Dunnett’s multiple comparison t-test was used to calculate the statistical difference. Student unpaired t-test was used to calculate the statistical difference in comparison to MTX (p-value # ≤ 0.05; * ≤ 0.05).
Figure 3
Figure 3
Radiological Analysis of Rheumatoid Arthritis (RA) Diseased and ASHW Treated Mice. X-ray analysis of (A) Normal control (NC) animal pedal region radiological analysis showing Tibia (T), Fibula (Fb), Calcaneum (Ca), Patella (P), Femur (F), Tarsals (T), Metatarsals (MT) and Phalanges (P). Normal joint space with healthy cartilage at knee joint (JsK) and ankle joint (JsA) and periarticular soft tissue (ST). Inset: Magnified normal knee-joint region of NC. (B) Disease control (DC) animal showing periosteal reaction/hypertrophy (PR), bone erosion (B), soft tissue swelling (SS), narrowed joint space (JS) and osteoporosis (OP). Inset: Magnified knee-joint region of the DC animal showing PR, JS and OP. (C) Methotrexate (MTX) treated CAIA animal showing PR, B, SS, JS, and OP. Inset: Magnified knee-joint region of MTX treated animal showing PR, JS, and OP. (D) Ashwashila (ASHW) treated CAIA animal showing PR, B, SS, JS, and OP. Inset: Magnified knee-joint region of the ASHW treated animal showing PR, JS, and OP. (E) Ankle radiological score showed significant damage in the DC animals as compared to the NC animals, and reduced ankle radiological score was following treatment with ASHW or MTX. (F) The knee-joint radiological score showed increased damage in the DC animals at the onset of RA disease and marginal reduction following treatment with ASHW or MTX. Values in the results are Mean ± SEM. A one-way analysis of variance (ANOVA) followed by Dunnett’s multiple comparison t-test was used to calculate the statistical difference. Student unpaired t-test was used to calculate statistical difference in comparison to MTX (p-value # ≤ 0.05; * ≤ 0.05; ** ≤ 0.01).
Figure 4
Figure 4
Histopathological Analysis of Ankle Joint. (A) Normal control animal ankle-joint parts representing articular cartilage (Ac), synovial membrane (Sm), synovial folds (Sm), spongy Bone (Sb), bone marrow cells (Bm), joint cavity (Jc). (B) disease control (DC) animal following treatment C-Ab + LPS showing moderately enlarged synovial membrane (Sm), hyperplastic synovium (Sh), increased synovial vascularity (Sv), inflammation (In), bone erosion (Be), and cartilage erosion (Ce). (C) Treatment of CAIA animal with Ashwashila (ASHW) showed mildly enlarged Sm, Sh and increased Sv. (D) Diseased animals treated with Methotrexate (MTX) showed minimal enlarged Sh, In and increased Sv. (E) Total lesion score measurement indicated increase in inflammatory lesion in the DC animals and reduction following treatment of the animals with ASHW and MTX. (F) Similar efficacy of ASHW and MTX in reducing lesion score in the DC animal as a function of percentage (%) inhibition was determined. Values in the results are Mean ± SEM. A one-way analysis of variance (ANOVA) followed by Dunnett’s multiple comparison t-test was used to calculate the statistical difference. Student unpaired t-test was used to calculate the statistical difference in comparison to MTX (p-value # ≤ 0.05; ** ≤ 0.01).
Figure 5
Figure 5
Histopathological Analysis of Knee Joint. (A) Normal control (NC) animal knee- joint parts representing articular cartilage (Ac), synovial membrane (Sm), synovial folds (Sm), spongy bone (Sb), bone marrow cells (Bm), joint cavity (Jc). (B) Knee-joint in disease control (DC) animal treated with C-Ab + LPS showing moderately enlarged synovial membrane (Sm), hyperplastic synovium (Sh), increased synovial vascularity (Sv), calcinosis (Ca), inflammation (In), pannus formation (Pn) and cartilage erosion (Ce). (C) Treatment of the CAIA animal with Ashwashila (ASHW) showed mildly enlarged Sm, Sh, increased Sv, and inflammation (In). (D) Treatment of the diseased animal with Methotrexate (MTX) showed mildly enlarged Sm, Sh, increased Sv and In. (E) Total lesion score measurement indicated increased inflammatory lesion in the DC animals. Treatment of the diseased animal with ASHW or MTX showed a significant reduction in the lesion score of knee-joints. (F) Anti-arthritic efficacy of ASHW and MTX as percentage (%) inhibition showed similar inhibitory effects. Values in the results are Mean ± SEM. A one-way analysis of variance (ANOVA) followed by Dunnett’s multiple comparison t-test was used to calculate the statistical difference. Student unpaired t-test was used to calculate the statistical difference in comparison to MTX (p-value # ≤ 0.05; ** ≤ 0.01).
Figure 6
Figure 6
Effect of Ashwashila Treatment on Articular Cartilage Erosion of Ankle Joint. (A) Histological analysis of normal control (NC) animal ankle-joint stained with safranin ‘O’ show normal uncalcified cartilage (UC), calcified cartilage (CC), and subchondral bone (SB). (B) Ankle joint in disease control (DC) animal following treatment with C-Ab + LPS showed cartilage degradation extending up to SB. (C) Treatment of the diseased animal with Ashwashila (ASHW) limited the cartilage degradation till the UC region of the ankle-joint. (D) Following treatment of the diseased animals with Methotrexate (MTX) cartilage degradation was limited to UC. (E) Inflammatory lesion development was detected in the DC animals that showed significant reduction following treatment of the animals with ASHW or MTX. (F) Similar efficacy of ASHW and MTX was observed in anti-arthritic activity through reduction in lesion score as a function of percentage (%) inhibition. Values in the results are Mean ± SEM. A one-way analysis of variance (ANOVA) followed by Dunnett’s multiple comparison t-test was used to calculate the statistical difference. Student unpaired t-test was used to calculate the statistical difference in comparison to MTX (p-value # ≤ 0.05; ** ≤ 0.01).
Figure 7
Figure 7
Effect of Ashwashila Treatment on Articular Cartilage Erosion of Knee Joint. (A) Histological analysis of normal control (NC) animal knee-joint stained with safranin ‘O’ show normal uncalcified cartilage (UC), calcified cartilage (CC), and subchondral bone (SB). (B) Knee-joint in disease control (DC) animal following treatment with C-Ab + LPS showed cartilage degradation extending up to SB. (C) Treatment of the diseased animal with Ashwashila (ASHW) limited the cartilage degradation till the UC region of the knee-joint. (D) Treatment of the diseased animal with methotrexate (MTX) showed superficial fibrillation of the articular cartilage (FB) region. (E) Increase in the pro-inflammatory lesion score was determined in the DC animals that showed reduction following treatment of the animals with ASHW or MTX. (F) Similar efficacy of ASHW and MTX in performing anti-arthritic activity was determined through a reduction in lesion score in the treated animals represented as percentage (%) inhibition. Values in the results are Mean ± SEM. A one-way analysis of variance (ANOVA) followed by Dunnett’s multiple comparison t-test was used to calculate the statistical difference. Student unpaired t-test was used to calculate statistical difference in comparison to MTX (p-value # ≤ 0.05; * ≤ 0.05; ** ≤ 0.01).
Figure 8
Figure 8
Liver Health Biomarker Measurement in Blood Serum. (A) Analysis of the liver enzyme Alanine Aminotransferase (ALT), also known as serum glutamate-pyruvate transaminase (SGPT) was done in the blood serum of the mice showed an increase in the disease control animals (DC) indicating the onset of liver damage as compared to the normal control animals (NC). Treatment of the diseased animals with Methotrexate (MTX) and Ashwashila (ASHW) showed a significant reduction in the levels of ALT post-treatment. (B) Analysis of the Aspartate Aminotransferase (AST) also known as serum glutamic-oxaloacetic transaminase (SGOT) enzyme showed a substantial increase in the disease control animals as compared to the healthy control animals. MTX Treatment showed a considerable decrease in the liver toxicity as compared to the DC animals; ASHW treatment showed a minor reduction in the AST levels as compared to the DC animals. Values in the results are Mean ± SEM. A one-way analysis of variance (ANOVA) followed by Dunnett’s multiple comparison t-test was used to calculate the statistical difference. Student unpaired t-test was used to calculate the statistical difference in comparison to MTX (p-value ## and ** ≤ 0.01).
Figure 9
Figure 9
In-vitro Modulation of Pro-Inflammatory Cytokines by Ashwashila. (A) THP-1 cells treated with varying concentration of the Ashwashila (ASHW) between 0–25 mg/mL induced minor toxicity at dose of ≥12.5 mg/mL. ASHW concentrations to cause 20% and 50% inhibitions were found at 18.83 mg/mL and 42.29 mg/mL, respectively. Pro-inflammatory responses in the endotoxin lipopolysaccharide (LPS) treated THP-1 cells showed stimulated release of the pro-inflammatory cytokines (B) IL-1β, (C) IL-6 and (D) TNF-α. Treatment of the THP-1 cells with varying concentrations of the Ashwashila (ASHW) inhibited the production of the pro-inflammatory cytokines in a dose-dependent manner. (E) Luciferase NFκB reporter gene vector transfected THP-1 cells were found to express high quantity of NFκB proteins, when stimulated with LPS. This was reduced in a dose-dependent manner in the cells treated with ASHW up to the tested concentration of 10 mg/mL. Values in the results are Mean ± SEM. A one-way analysis of variance (ANOVA) followed by Dunnett’s multiple comparison t-test was used to calculate the statistical difference. Student unpaired t-test was used to calculate statistical difference in comparison to MTX (p-value # ≤ 0.01; ## ≤ 0.001; * ≤ 0.01; ** ≤ 0.001).

Similar articles

Cited by

References

    1. Smolen JS, et al. Rheumatoid arthritis. Nat Rev Dis Primers. 2018;4:18001. doi: 10.1038/nrdp.2018.1. - DOI - PubMed
    1. Smolen JS, et al. Validity and reliability of the twenty-eight-joint count for the assessment of rheumatoid arthritis activity. Arthritis Rheum. 1995;38:38–43. doi: 10.1002/art.1780380106. - DOI - PubMed
    1. McInnes IB, Schett G. The pathogenesis of rheumatoid arthritis. N Engl J Med. 2011;365:2205–2219. doi: 10.1056/NEJMra1004965. - DOI - PubMed
    1. McInnes IB, Schett G. Cytokines in the pathogenesis of rheumatoid arthritis. Nat Rev Immunol. 2007;7:429–442. doi: 10.1038/nri2094. - DOI - PubMed
    1. Bartok B, Firestein GS. Fibroblast-like synoviocytes: key effector cells in rheumatoid arthritis. Immunol Rev. 2010;233:233–255. doi: 10.1111/j.0105-2896.2009.00859.x. - DOI - PMC - PubMed

Publication types

MeSH terms