. 2019 Jul;571(7763):117-121.
doi: 10.1038/s41586-019-1244-x. Epub 2019 May 29.

Long-term ex vivo haematopoietic-stem-cell expansion allows nonconditioned transplantation

Affiliations

Long-term ex vivo haematopoietic-stem-cell expansion allows nonconditioned transplantation

Adam C Wilkinson et al. Nature. 2019 Jul.

Erratum in

Abstract

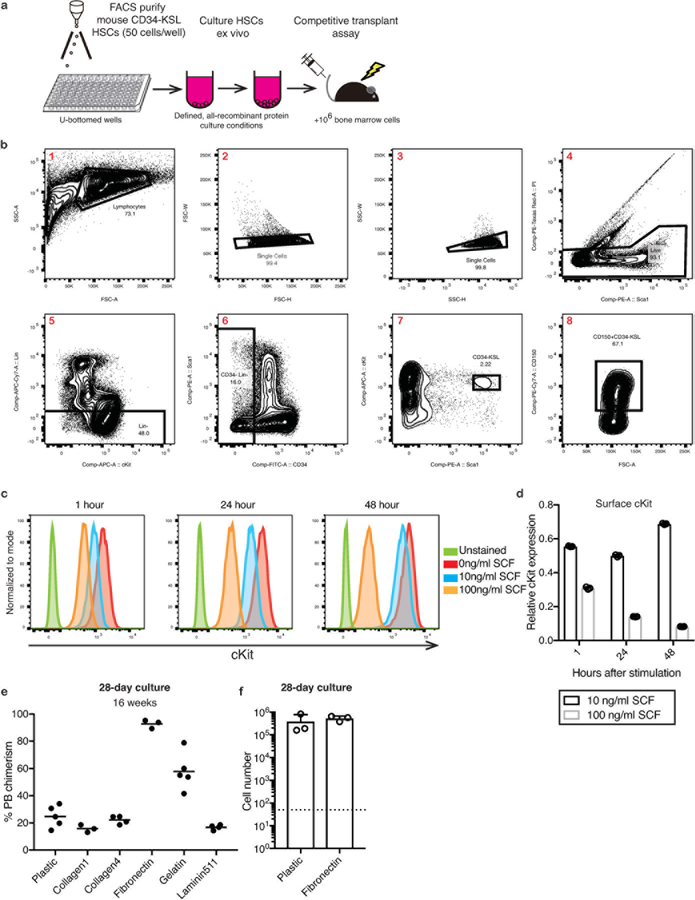
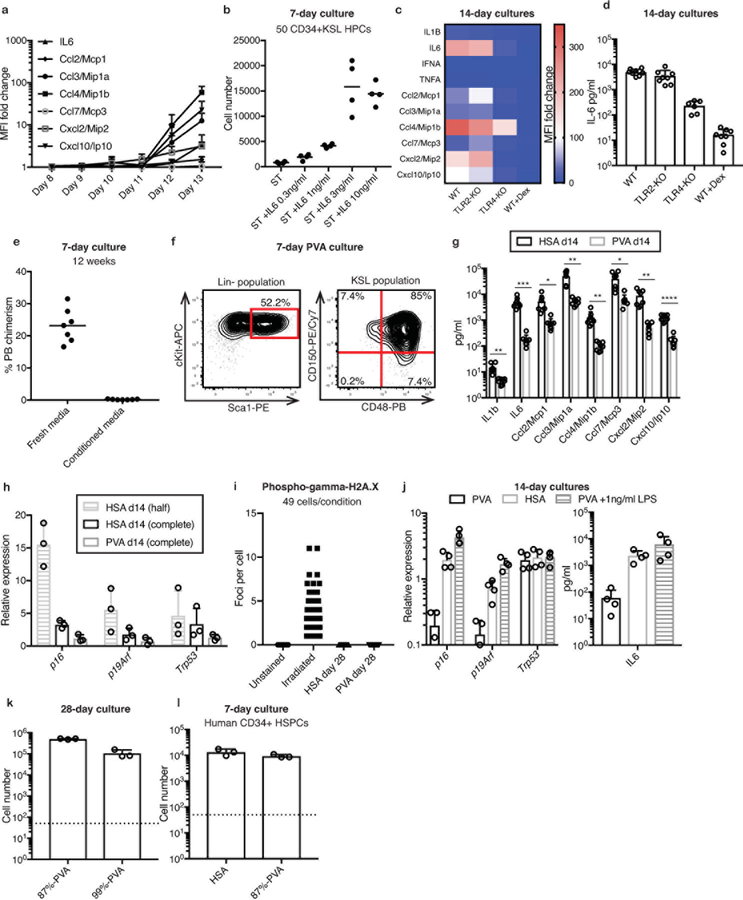
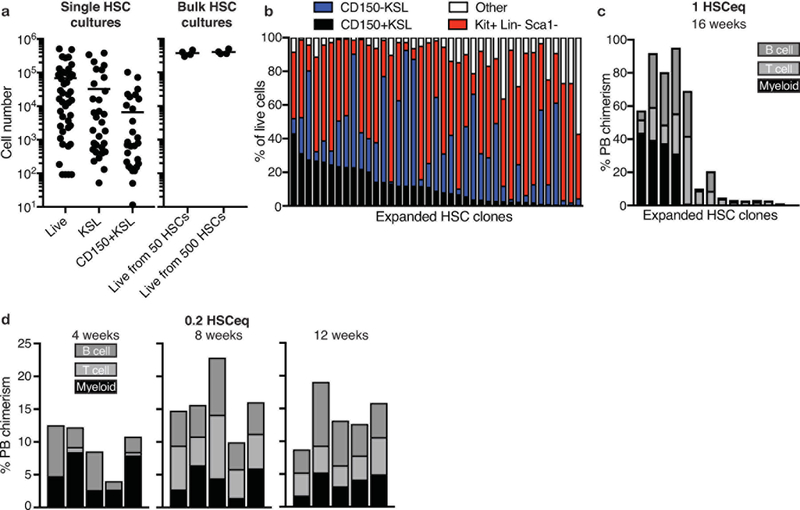
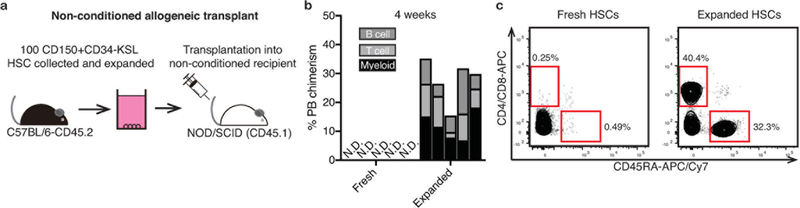
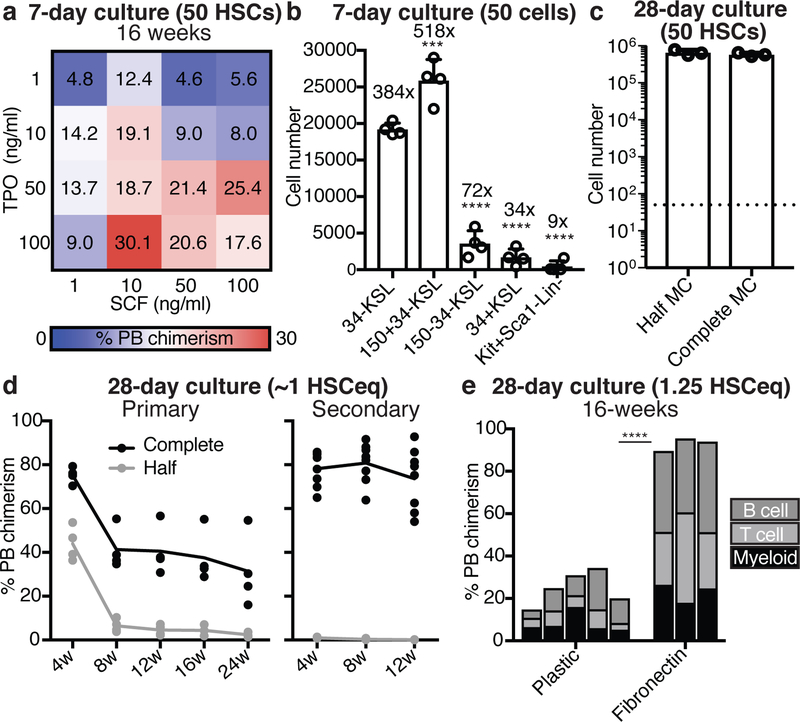
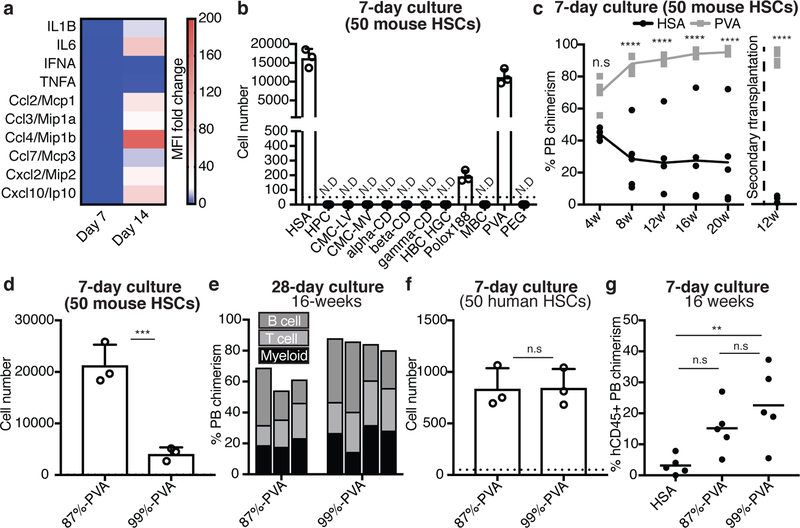
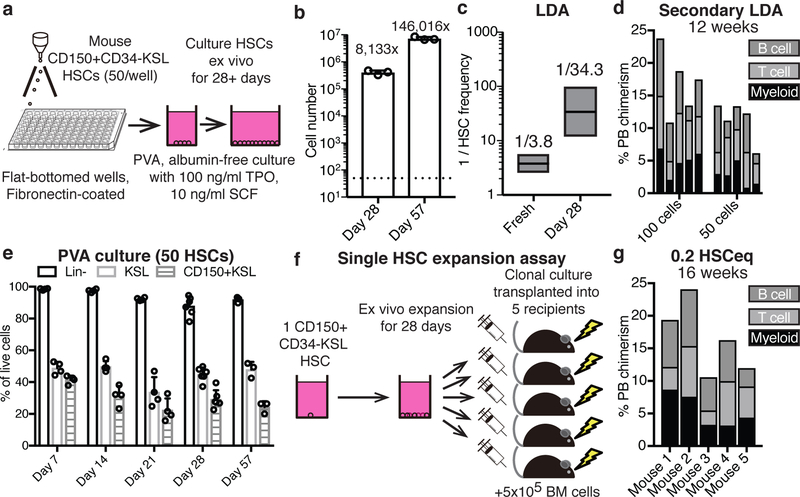
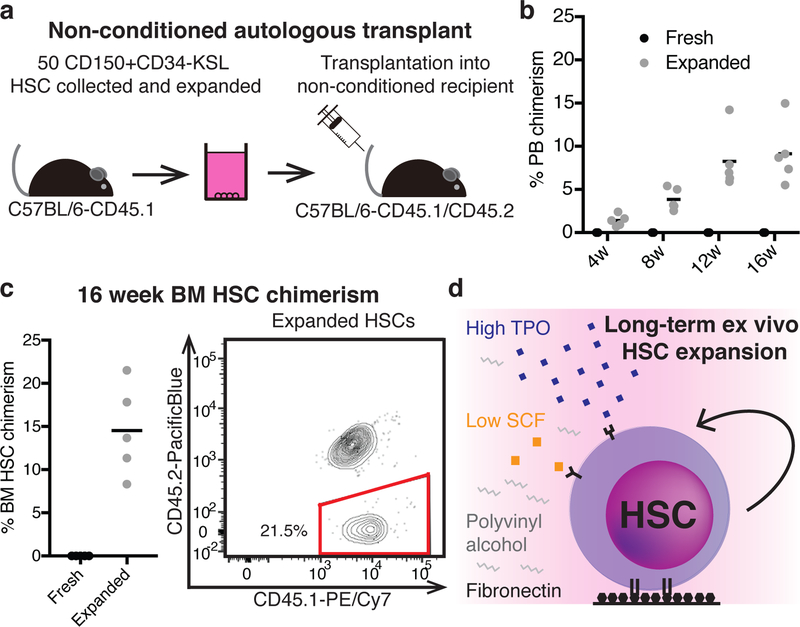
Multipotent self-renewing haematopoietic stem cells (HSCs) regenerate the adult blood system after transplantation1, which is a curative therapy for numerous diseases including immunodeficiencies and leukaemias2. Although substantial effort has been applied to identifying HSC maintenance factors through the characterization of the in vivo bone-marrow HSC microenvironment or niche3-5, stable ex vivo HSC expansion has previously been unattainable6,7. Here we describe the development of a defined, albumin-free culture system that supports the long-term ex vivo expansion of functional mouse HSCs. We used a systematic optimization approach, and found that high levels of thrombopoietin synergize with low levels of stem-cell factor and fibronectin to sustain HSC self-renewal. Serum albumin has long been recognized as a major source of biological contaminants in HSC cultures8; we identify polyvinyl alcohol as a functionally superior replacement for serum albumin that is compatible with good manufacturing practice. These conditions afford between 236- and 899-fold expansions of functional HSCs over 1 month, although analysis of clonally derived cultures suggests that there is considerable heterogeneity in the self-renewal capacity of HSCs ex vivo. Using this system, HSC cultures that are derived from only 50 cells robustly engraft in recipient mice without the normal requirement for toxic pre-conditioning (for example, radiation), which may be relevant for HSC transplantation in humans. These findings therefore have important implications for both basic HSC research and clinical haematology.


Conflict of interest statement

Conflict-of-interest: H.N. is a co-founder and shareholder of ReproCELL. Inc.

Figures

Extended Data Figure 1:
Extended Data Figure 1:. Optimizing conditions for long-term HSC culture
(a) Schematic of the standard HSC culture assay: C57BL/6-CD45.1 BM CD34-cKit+Sca1+Lineage- (CD34-KSL) HSCs were sorted (50 cells/well) into U-bottom 96-well plate wells, see (b) for sorting scheme. HSC growth can be observed during culture by counting or flow cytometry, with media changes made every three days (after initial seven days in culture). After 7–28 days, functional HSC activity was determined using competitive transplantation into irradiated C57BL/6-CD45.2 mice, against 1×10⁶ BM competitor cells from C57BL/6-CD45.1/CD45.2 (F1) mice. Donor chimerism within peripheral blood (PB) myeloid, T cell, and B cell lineages was determined after 4–16 weeks or longer. Where indicated, secondary transplantation assays were performed by transplanting 106 BM cells from primary recipients into irradiated C57BL/6-CD45.2 mice. (b) FACS gating strategy for sorting CD34-KSL cells (gates 1–7) and CD150+CD34-KSL cells (gates 1–8) from cKit-enriched mouse BM. Representative of at least 5 experiments. (c) Flow cytometric histograms for cell surface cKit staining of HSCs following stimulating with 100 ng/ml TPO and either 0, 10, or 100 ng/ml SCF for 1, 24, and 48 hours. Representative of 3 independent cultures. (d) Mean florescence intensity (MFI) of cKit antibody staining on HSCs cultured in 100 ng/ml TPO supplemented with 10 ng/ml or 100 ng/ml SCF, analyzed after 1–72 hours in culture, relative to cultures containing 100 ng/ml TPO without SCF. Mean of 3 independent cultures. Error bars denote s.d. (e) Mean 16-week donor PB chimerism from 1×10⁴ HSC-derived cells following a 28-day culture on plastic (n=5), Collagen1 (n=3), Collagen4 (n=4), Fibronectin (n=3), Gelatin (n=5), or Laminin511 (n=4) culture plates (cultured in 100 ng/ml TPO and 10 ng/ml SCF with complete media changes). Competitive transplantation against 1×10⁶ BM competitors. (f) Number of live cells after culturing 50 CD34-KSL HSCs for 28 days on plastic (tissue culture-treated) plates or fibronectin-coated plates. Mean of 3 independent cultures. Error bars denote s.d.
Extended Data Figure 2:
Extended Data Figure 2:. Identification of PVA-based HSC culture conditions
(a) Fold-change in mean fluorescence intensity (MFI) from cytokine immunoassays performed on HSA-based HSC cultures between day 8 and 13. Media changes performed at day 7 and day 10. Mean of 4 independent cultures with fold-change relative to unconditioned media. Error bars denote s.d. (b) Mean 7-day expansion of 50 CD34+KSL HPCs in 100 ng/ml TPO and 10 ng/ml SCF with or without addition of 0.3 ng/ml-10 ng/ml mouse IL-6 (n=4). (c) Heatmap displaying the MFI fold change from cytokine immunoassays using conditioned media from day-14 HSC cultures. CD34-KSL HSCs were isolated from C57BL/6 WT, TLR2-KO or TLR4-KO mice and cultured in HSA-based cultures. Dexamethasone (+Dex) at 50nM was added where indicated. Mean of 4 independent cultures with fold-change relative to unconditioned media. (d) Concentration of IL-6 observed in 14-day HSA-based cultures of WT HSCs (n=8), TLR2-KO HSCs (n=8), TLR4-KO HSCs (n=6), or WT HSCs +Dex (n=8). Error bars denote s.d. (e) Mean 12-week donor PB chimerism from 7-day cultured HSCs, in fresh media (n=7) or in media composed of 50% media collected from a 12-day HSC culture and 50% fresh media (termed conditioned media; n=7). Competitive transplantation against 1×10⁶ BM competitors. (f) Example flow cytometry plots displaying cKit and Sca1 expression on the Lin- progeny (left), and CD150 and CD48 expression in the KSL population (right) after a seven-day polyvinyl alcohol (PVA)-based HSC culture. Representative of 4 independent cultures. (g) Concentration of various cytokines in day-14 conditioned media from HSA- or PVA-based CD34-KSL HSC cultures. Mean of 8 independent cultures. Error bars denote s.d. Statistical significance was calculated using t-tests. *, **, ***, and **** denote p<0.05, p<0.01, p<0.001, and p<0.0001, respectively. (h) Relative expression of p16Ink4a, p19Arf, and p53 in KSL cells collected from 14-day cultures (HSA-based cultures with half-media changes, HSA-based cultures with complete media changes, and PVA-based cultures with complete media changes), relative to expression in freshly-isolated KSL cells. Mean of 3 independent cultures, with gene expression normalized to Gapdh expression. Error bars denote s.d. (i) Number of phospho-gamma histone 2AX (H2AX) nuclear foci in day-28 KSL cells from HSA-based or PVA-based HSC cultures. Irradiated cells were included as a positive control. 49 cells quantified per condition. (j) Relative expression of p16Ink4a, p19Arf, and p53 in KSL cells collected from 14-day cultures (left): HSA-based cultures, PVA-based cultures, and PVA-based cultures supplemented with 1 ng/ml LPS. Mean of technical quadruplets, with gene expression normalized to Gapdh expression. Concentration of IL-6 observed in these culture conditions (right). Mean of 4 independent cultures. Error bars denote s.d. (k) 28-day expansion of 50 CD150+CD34-KSL HSCs in media containing 87% hydrolyzed PVA (87%-PVA) or >99% hydrolyzed PVA (99%-PVA). 1×10⁴ day 28 cells represents ~1 HSCeq for 87%-PVA and ~5 HSCeq for 99%-PVA. Mean of 3 independent cultures. Error bars denote s.d. (l) 7-day expansion of 50 human CB CD34+ cells in HSA- or PVA-based cultures supplemented with 10 ng/ml human SCF and 100 ng/ml human TPO. Mean of 3 independent cultures. Error bars denote s.d.
Extended Data Figure 3:
Extended Data Figure 3:. Characterization of long-term PVA-based HSC cultures
(a) Mean 4–16-week donor PB chimerism from 28-day PVA-based (CD150+CD34-KSL) HSC cultures using 100 ng/ml TPO and 10 ng/ml SCF in fibronectin-coated wells with complete media changes. Indicated cell numbers transplanted against 2×10⁵ BM cells. Data from two independent transplantation experiments. (b) 16-week multilineage donor PB chimerism for each individual mouse in (a). (c) Expression of p16Ink4a, p19Arf, and p53 in 28-day PVA-cultured KSL cells, relative to expression in freshly-isolated KSL cells. Mean of 3 independent cultures, with gene expression normalized to Gapdh expression. Error bars denote s.d. (d) Sanger sequencing trace of p53 cDNA amplified from KSL cells collected from 28-day PVA-based HSC cultures (n=1). (e) Representative images of beta-galactosidase activity staining of freshly-isolated KSL, KSL isolated from 28-day PVA-based cultures, and bulk 28-day PVA-based cultures. Representative of two biological replicates. (f) Percentage of beta-galactosidase-positive cells in conditions described in (e). Mean of technical triplicates (50–100 cells counted per replicate). Error bars denote s.d.; N.D. denotes not detected. (g) Karyotype of CD45.1+ BM-repopulating progeny of day-28 expanded functional HSCs in PVA-based media at 16-weeks post-transplantation. All chromosomes analyzed were normal in 25 out of 25 cells analyzed (performed by Nihon Gene Research Laboratories Inc.). (h) Frequency of CD11a+, CD34+, CD48+, CD135+, CD201+, and ESAM+ cells within the phenotypic KSL population during ex vivo HSC culture (derived from 50 CD150+CD34-KSL). Mean of 4 independent cultures. Error bars denote s.d. (i) Composition of the lineage marker-positive compartment of day-28 HSC cultures. The lineage antibody cocktail used in this study comprised of CD4, CD8, CD45RA, Ter119, Ly-6C/Ly-6G, and CD127. A non-overlapping FceR1+ cell population was also identified within the culture, and is quantitated relative to the lineage antibody-cocktail positive population. Mean of 4 independent cultures. Error bars denoting s.d. (j) Mean 4–16 week donor PB chimerism from 1×10⁵ cells from a 57-day PVA-based HSC culture using fibronectin-coated plates and supplemented with 100 ng/ml TPO and 10 ng/ml SCF (n=5). Competitive transplantation against 1×10⁶ BM competitors.
Extended Data Figure 4:
Extended Data Figure 4:. Characterization of clonally-derived HSC expansion cultures
(a) Mean number of live cells, KSL cells, and CD150+KSL cells derived from single CD150+CD34-KSL HSCs after 28-days culture (n=48; left), and mean number of live cells from bulk (50 and 500) CD150+CD34-KSL HSC cultures after 28-days (n=4; right). (b) Proportion of phenotypic cell types that constituent day-28 cultures derived from single CD150+CD34-KSL HSCs. Only cultures with >10,000 cells analyzed (39 wells of 84 wells analyzed). (c) 16-week donor PB chimerism of 28-day expanded single CD150+CD34-KSL HSC cultures transplanted into lethally-irradiated recipients against 2×10⁵ BM cells. Each column represents an individual mouse. (d) 4–12-week donor PB chimerism from 1/5th of a 28-day culture derived from a single CD150+CD34-KSL HSC, as describe in Figure 3f,g. Each column represents an individual mouse. Representative data for 3 independent single HSC cultures (out of 10 transplanted).
Extended Data Figure 5:
Extended Data Figure 5:. Nonconditioned transplantation into immunodeficient recipients
(a) Schematic of nonconditioned allogeneic transplantation: 100 CD150+CD34-KSL cells from C57BL/6-CD45.2 mice were expanded for 28-days before being transplanted into non-conditioned immunodeficient NOD/SCID recipients. (b) 4-week donor PB chimerism of 100 fresh HSCs (n=5) or a 28-day HSC culture derived from 100 HSCs (n=5), transplanted as described in (a). Each column represents an individual mouse. N.D. denotes not detected. (c) Example flow cytometric plots displaying T cell (CD4/CD8) and B cell (CD45RA, also known as B220) PB lineages within non-conditioned NOD/SCID mice at 16-weeks post-transplantation (representative of 5 mice), as described in (a).
Figure 1:
Figure 1:. High TPO synergizes with low SCF and fibronectin to enhance HSC expansion
(a) Mean 16-week donor PB chimerism from 50 CD34-KSL HSCs following a 7-day culture in mouse TPO (1–100 ng/ml) and mouse SCF (1–100 ng/ml), as described in Extended Data Figure 1a. Competitive transplantation against 1×10⁶ BM competitors. (b) Cell number derived from 50 CD34-KSL, 50 CD150+CD34-KSL, 50 CD150-CD34-KSL CD34+KSL, or 50 cKit+Sca1-Lin- BM cells after 7-day culture in 100 ng/ml TPO and 10 ng/ml SCF. Statistical significance calculated using ANOVA. *** denotes p=0.004 and **** denotes p<0.0001. Mean ± s.d. of 4 independent cultures. (c) 28-day growth of 50 CD34-KSL HSCs in 100 ng/ml TPO and 10 ng/ml SCF, and with half or complete media changes (MC) every 3-days. Mean ± s.d. of 4 independent cultures. (d) Donor PB chimerism in recipient mice from 1×10⁴ HSC-derived cells (~1 starting HSC equivalent; ~1 HSCeq) following a 28-day culture (started from 50 CD34-KSL), as described in (c). Competitive transplantation against 1×10⁶ BM competitors. Donor PB chimerism at 4–24-week in primary recipients (left) and at 4–12 weeks in secondary recipients (right). (e) 16-week donor PB chimerism from 1×10⁴ HSC-derived cells (1.25 HSCeq) following a 28-day culture (started from 50 CD34-KSL) on plastic (n=5) or fibronectin (n=3) plates cultured in 100 ng/ml TPO and 10 ng/ml SCF with complete media changes. Competitive transplantation against 1×10⁶ BM competitors. Each column represents an individual mouse. Statistical significance calculated using an unpaired two-tailed t-test. **** denotes p<0.0001.
Figure 2:
Figure 2:. Polyvinyl alcohol can replace serum albumin for ex vivo HSC expansion
(a) Heatmap displaying the fold-change in cytokine immunoassay mean fluorescence intensity (MFI) using conditioned media from day 7 and 14 HSC cultures. Mean of 4 independent cultures with fold-change relative to unconditioned media. (b) Cellular expansion of 50 CD34-KSL HSCs after a seven-day culture in serum albumin-free conditions, supplemented with various potential chemically-defined serum albumin replacements (see Methods section for details). Recombinant human serum albumin (HSA) used as a positive control. Mean ± s.d. of 3 independent cultures. N.D. denotes not detected. (c) Mean donor PB chimerism in primary recipients (n=5 per group) and secondary recipients (n=4 per group) from 50 CD34-KSL HSCs following a 7-day culture in HSA-based or PVA-based media, supplemented with 100 ng/ml TPO and 10 ng/ml SCF in U-bottom plates. Competitive transplantation against 1×10⁶ BM competitors in primary recipients. Statistical significance calculated using ANOVA. **** denotes p<0.0001, n.s. denotes not statistically significant. (d) 7-day expansion of 50 CD150+CD34-KSL HSCs in media containing 87%-hydrolyzed PVA (87%-PVA) or >99%-hydrolyzed PVA (99%-PVA). Mean ± s.d. of 3 independent cultures. Statistical significance calculated using t-test. *** denotes p=0.0021. (e) 16-week donor PB chimerism from 1×10⁴ cells from 28-day in 87%-PVA (n=3) and 99%-PVA (n=4) cultures (see Extended Data Figure 2k for 28-day cell counts). Each column represents an individual mouse. (f) 7-day expansion of 50 human umbilical cord blood-derived CD34+CD38-CD90+CD49f+ HSCs in HSA- or PVA-based cultures supplemented with 10 ng/ml human SCF and 100 ng/ml human TPO. Mean ± s.d. of 3 independent cultures. (g) Mean 16-week human CD45+ PB chimerism within sub-lethally irradiated NOG mice (n=5 per group) following transplantation with 7-day cultures derived from 2×10³ CD34+ cells. Statistical significance calculated using ANOVA. ** denotes p=0.0098. n.s. denotes not statistically significant.
Figure 3:
Figure 3:. Long-term ex vivo expansion of functional HSCs
(a) Schematic of the optimized mouse HSC expansion culture: 50 CD150+CD34-KSL HSCs were sorted into flat-bottom fibronectin-coated plate wells containing albumin-free F12 media supplemented with 1 mg/ml PVA, 100 ng/ml TPO, and 10 ng/ml SCF. (b) Mean number of live cells after culturing 50 CD150+CD34-KSL HSCs for 28 days (n=6) or 57 days (n=3) on fibronectin-coated plates in PVA-based culture media. Error bars denote s.d. (c) Box plots representing limiting dilution analysis of fresh CD150+CD34-KSL (total of 138 mice; published previously,) and 28-day HSC cultures (total of 16 mice; see Extended Data Figure 3a) calculated with ELDA software, using a positive cutoff of >1% multilineage PB chimerism at 16-weeks. Box plots denote calculated mean, and upper and lower limits. (d) 12-week donor PB chimerism in secondary recipient mice (n=5 per group), from 100 and 50 donor cells from day-28 PVA cultures (using primary recipients in Extended Data Figure 3b). BM from three primary recipients was pooled and 1×10⁶ cells transplanted into secondary recipients. Each column represents an individual mouse. (e) Mean percentage of phenotypic Lineage-, KSL and CD150+KSL cells during cultures, as described in (a), at day 7 (n=4), day 14 (n=4), day 21 (n=4), day 28 (n=6), and day 57 (n=3). Error bars denote s.d. (f) Schematic of the single HSC expansion assay: single CD150+CD34-KSL HSCs were expanded for 28-days and then transplanted into five lethally-irradiated recipient mice against 5×10⁵ BM competitors. Single HSCs expanded into ~5×10⁵ cells meaning each recipient received ~1×10⁵ cells (0.2 HSCeq). 10 single HSC-derived cultures were transplanted. (g) 16-week donor PB chimerism from 1/5th of a 28-day culture derived from a single CD150+CD34-KSL HSC (n=5), as describe in (f). Each column represents an individual mouse. Representative data for 3 independent single HSC cultures (out of 10 transplanted).
Figure 4:
Figure 4:. Ex vivo expanded HSCs engraft in non-conditioned recipients
(a) Schematic of non-conditioned autologous transplantation: 50 CD150+CD34-KSL cells from C57BL/6-CD45.1 mice were expanded for 28-days before being transplanted into non-conditioned C57BL/6-CD45.1/CD45.2 recipients. (b) Mean 4–16 week donor PB chimerism from 50 fresh HSCs (n=5) or a 28-day culture derived from 50 HSCs (50 HSCeq; n=5), transplanted as described in (a). (c) Mean 16-week donor BM CD34-KSL HSC chimerism (n=5) for the assay described in (a) (left) and an example flow cytometric plot displaying CD45.1 and CD45.2 expression within the BM CD34-KSL compartment of recipient mice (right). (d) Graphical summary of the optimized conditions for expansion of functional mouse HSCs.

Comment in

References

    1. Osawa M, Hanada K, Hamada H, Nakauchi H. Long-term lymphohematopoietic reconstitution by a single CD34-low/negative hematopoietic stem cell. Science 1996;273(5272):242–245. - PubMed
    1. Copelan EA. Hematopoietic stem-cell transplantation. N Engl J Med 2006;354(17):1813–1826. - PubMed
    1. Morrison SJ, Scadden DT. The bone marrow niche for haematopoietic stem cells. Nature 2014;505(7483):327–334. - PMC - PubMed
    1. Boulais PE, Frenette PS. Making sense of hematopoietic stem cell niches. Blood 2015;125(17):2621–2629. - PMC - PubMed
    1. Yamazaki S, Ema H, Karlsson G, et al. Nonmyelinating Schwann cells maintain hematopoietic stem cell hibernation in the bone marrow niche. Cell 2011;147(5):1146–1158. - PubMed

MeSH terms