. 2019 Jun;570(7762):474-479.
doi: 10.1038/s41586-019-1252-x. Epub 2019 May 29.

Growth dynamics in naturally progressing chronic lymphocytic leukaemia

Affiliations

Growth dynamics in naturally progressing chronic lymphocytic leukaemia

Michaela Gruber et al. Nature. 2019 Jun.

Abstract

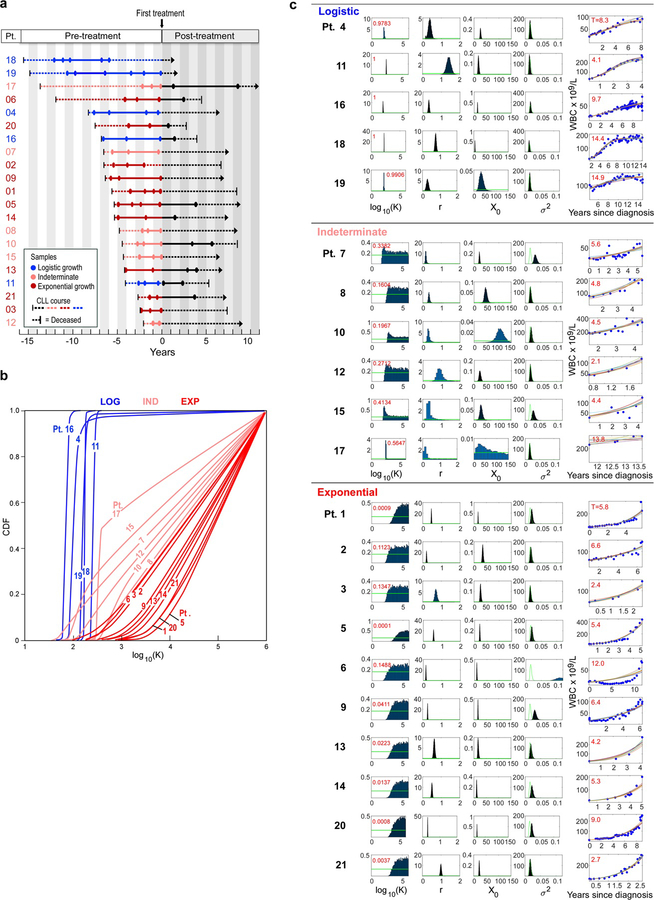
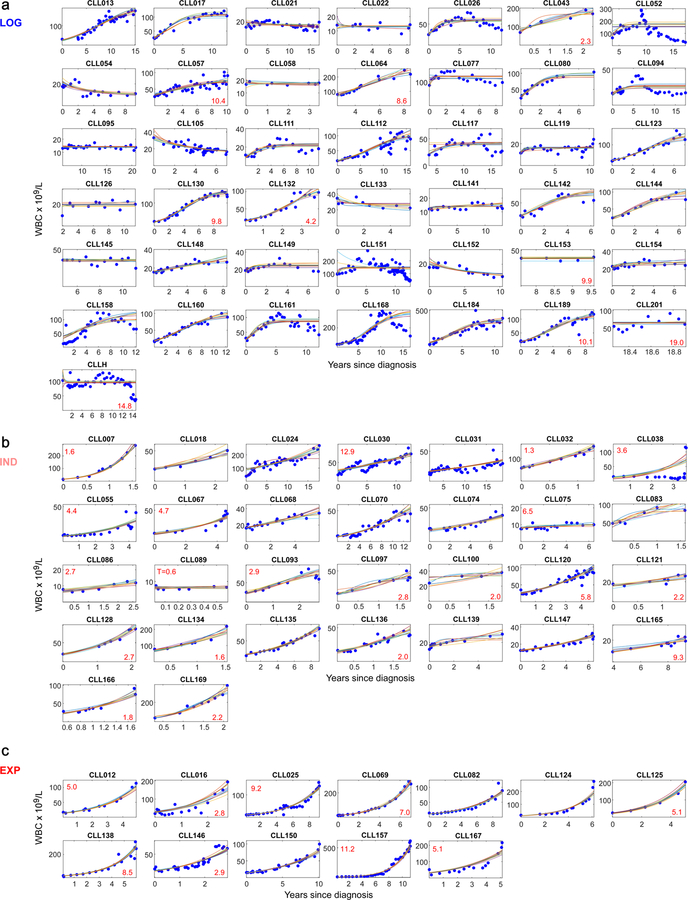
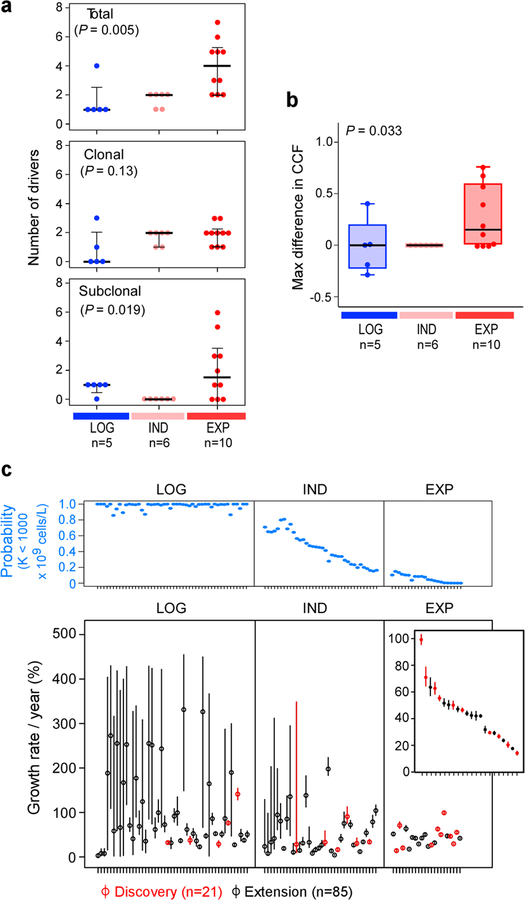
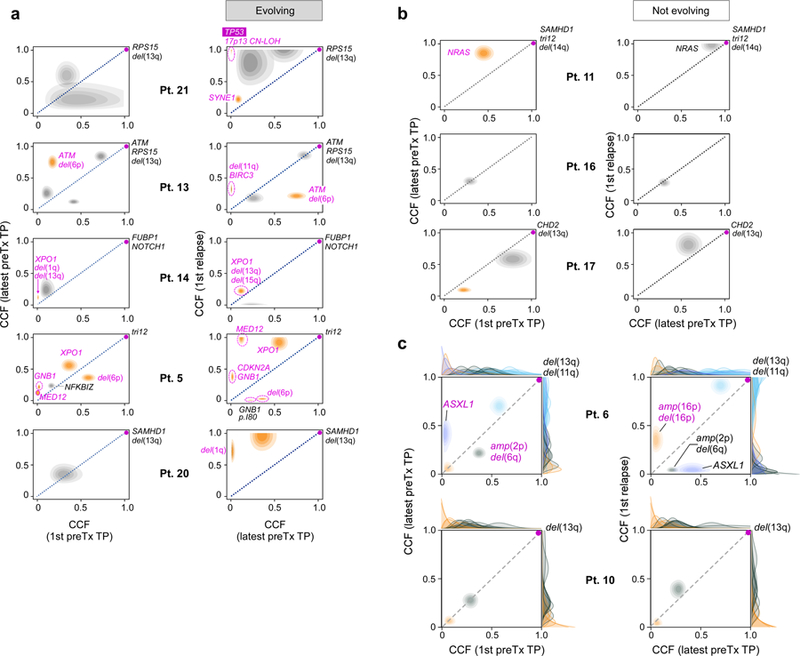
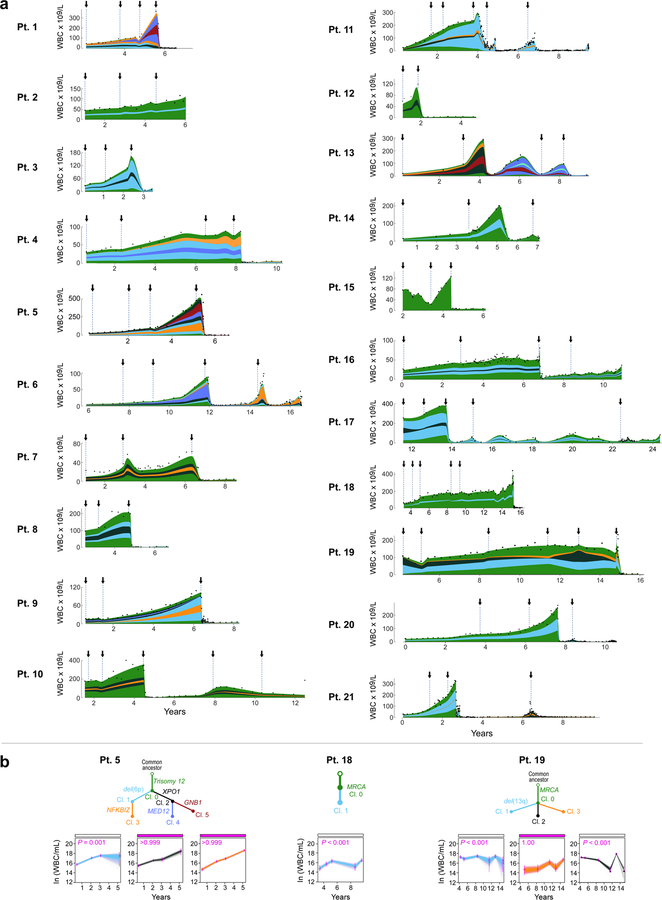
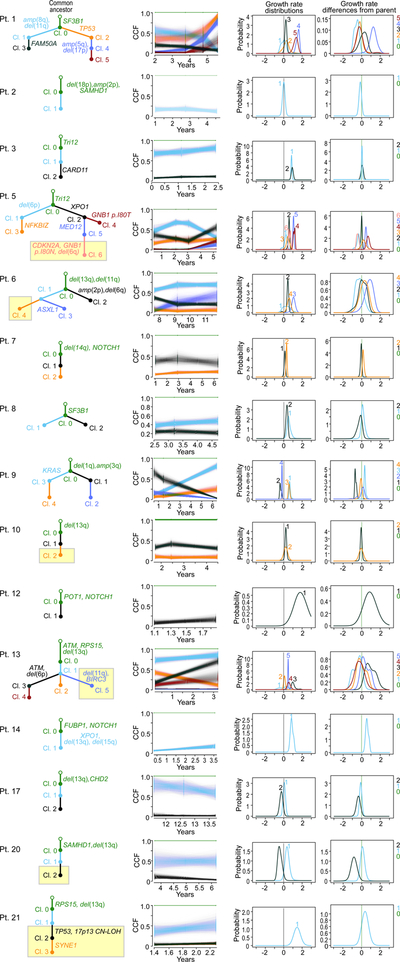
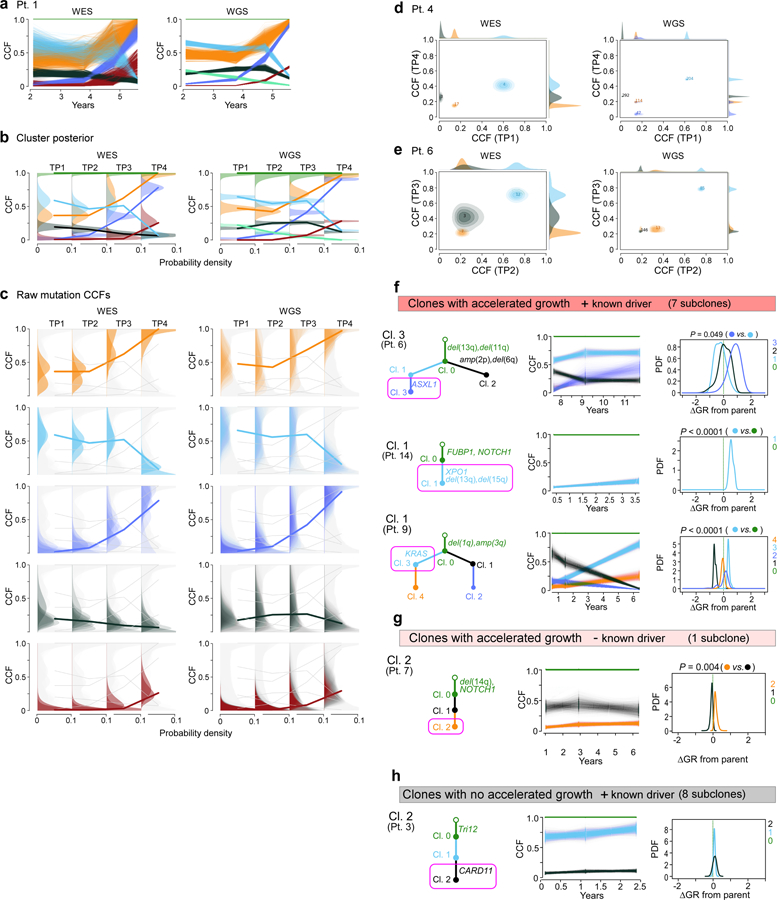
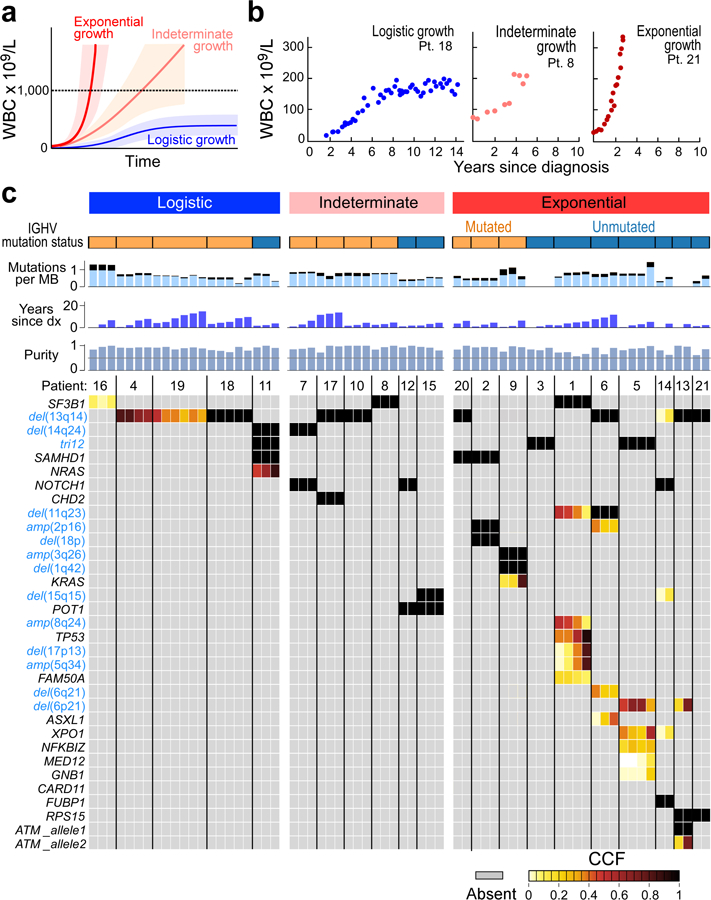
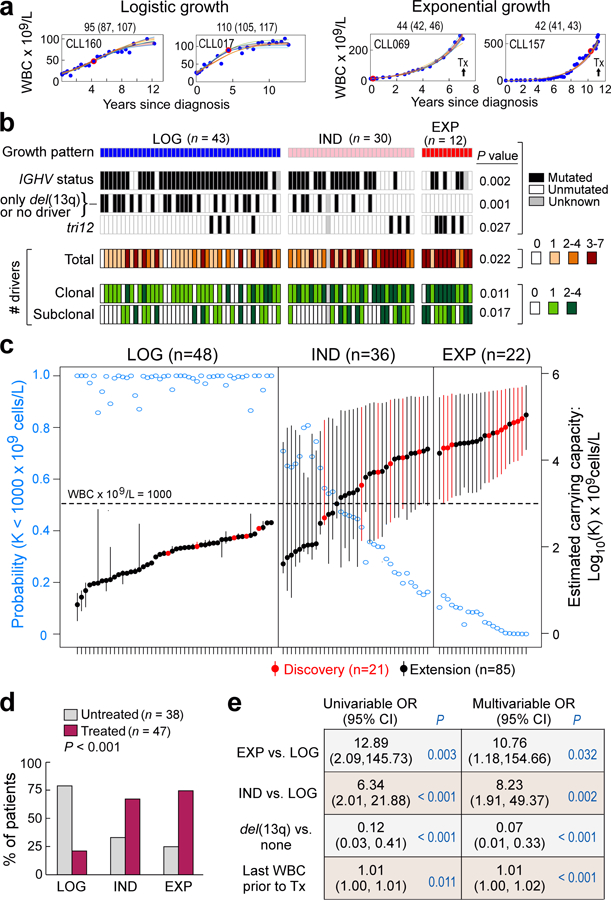
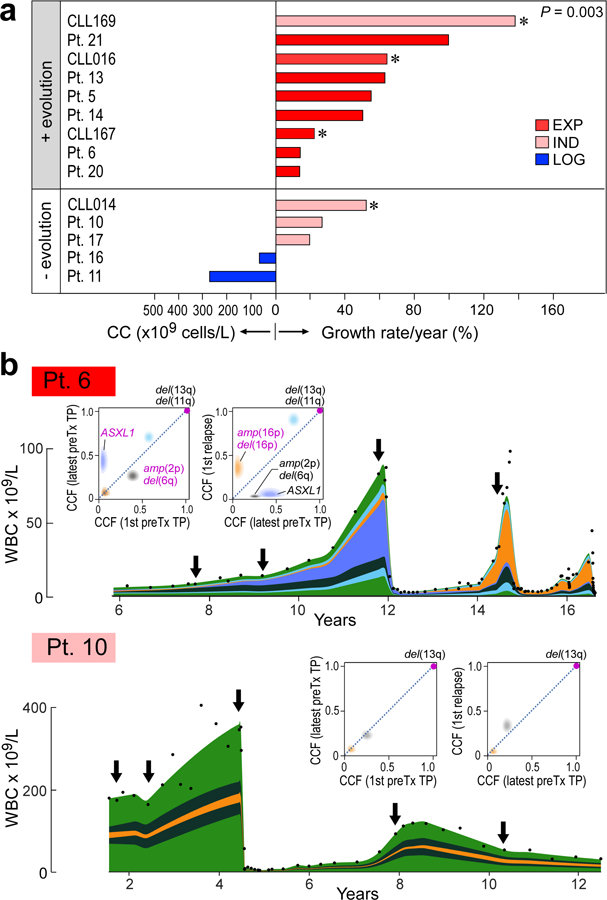
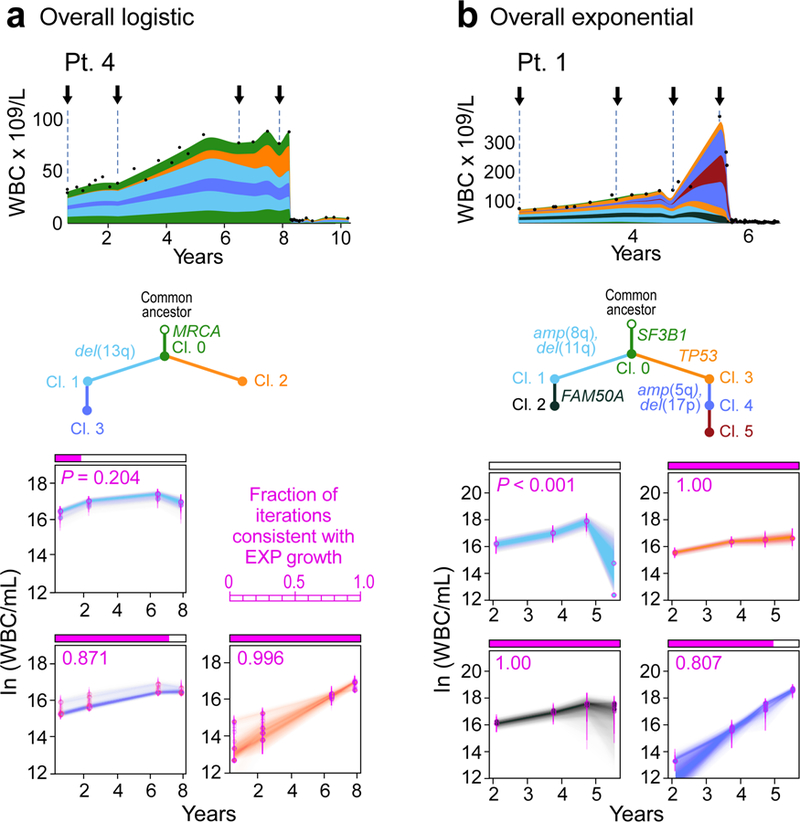
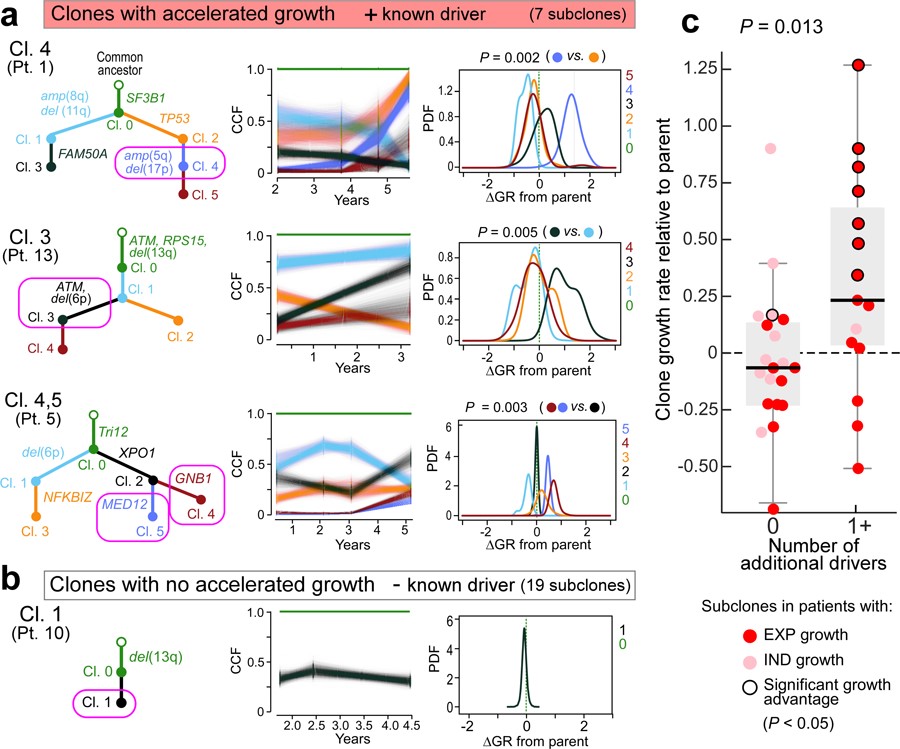
How the genomic features of a patient's cancer relate to individual disease kinetics remains poorly understood. Here we used the indolent growth dynamics of chronic lymphocytic leukaemia (CLL) to analyse the growth rates and corresponding genomic patterns of leukaemia cells from 107 patients with CLL, spanning decades-long disease courses. We found that CLL commonly demonstrates not only exponential expansion but also logistic growth, which is sigmoidal and reaches a certain steady-state level. Each growth pattern was associated with marked differences in genetic composition, the pace of disease progression and the extent of clonal evolution. In a subset of patients, whose serial samples underwent next-generation sequencing, we found that dynamic changes in the disease course of CLL were shaped by the genetic events that were already present in the early slow-growing stages. Finally, by analysing the growth rates of subclones compared with their parental clones, we quantified the growth advantage conferred by putative CLL drivers in vivo.


Conflict of interest statement

Competing interests

C.J.W. is founder of Neon Therapeutics and a member of its scientific advisory board. G.G. receives research funds from IBM and Pharmacyclics. G.G is an inventor of several bioinformatics-related patents, including related to MuTect and ABSOLUTE. C.J.W., D.N. and T.J.K. receive research funding from Pharmacyclics. J.S. is a current employee of Moderna Therapeutics. J.G.G. receives grant funding from funding Janssen, Acerta, Celgene; Honoraria Abbvie, AZ, Celgene, Kite, Janssen, Pharmacyclics, Roche and Novartis. K.R.R. is on Medical Advisory Boards of Pharmacyclics, Roche/Genentech, and Cellectis. J.R.B. is a consultant for Abbvie, Acerta, Beigene, Genentech/Roche, Gilead, Juno/Celgene, Kite, Loxo, Novartis, Pfizer, Pharmacyclics, Sunesis, TG Therapeutics, Verastem; received honoraria from Janssen and Teva; received research funding from Gilead, Loxo, Sun and Verastem; and served on data safety monitoring committees for Morphosys and Invectys. The other authors declare no potential conflicts of interest.

Figures

Extended Data Figure 1
Extended Data Figure 1. Growth kinetics of naturally progressing CLLs from the discovery cohort.
a, Time courses of the discovery CLL cohort (Supplementary Table 1). Circles indicate timepoints of samples analysed by whole-exome sequencing (WES). Dotted lines represent course of CLL from diagnosis (left vertical line) until last follow up (arrows) or death (right vertical line) and solid lines indicate timeframe covered by the analysis of serial samples by WES, coloured by growth pattern. b, Cumulative distribution function (CDF) of posterior probabilities for carrying capacity K obtained from the Bayesian model based on a logistic growth pattern for patients. The growth pattern categorizations of the individual patients are marked. c, Classification of patients based on probability that their carrying capacity K is below 1000 (x 109 white blood cells/L) (red numbers in upper left corner). Also shown are the posterior probabilities for all model parameters (carrying capacity K, growth rate r, white blood cell counts (WBC) at diagnosis X0 and variance of the noise σ2). Far right panels per patient - Leukaemia burden information provided by WBC measurements (blue dots), with ten random fits from the Bayesian model. Red numbers in left upper corners indicate time (years) from diagnosis to first treatment.
Extended Data Figure 2
Extended Data Figure 2. Growth kinetics of CLLs from the extension cohort.
Shown are samples displaying: a, logistic growth (n = 43), b, indeterminate growth (n= 30) or c, exponential growth (n = 12), (information on growth pattern fitting in Supplementary Table 8). Blue dots - WBC measurements, coloured lines – ten random growth model fits (see Methods). Red numbers in lower left corners indicate years from diagnosis to first treatment for patients who progressed to treatment.
Extended Data Figure 3
Extended Data Figure 3. Clonal shifts and growth rates in untreated CLL patients.
a, The increase in numbers of total (upper panel), clonal and subclonal drivers (middle and bottom panels) is associated with overall leukaemia growth patterns (Kruskal-Wallis test). b, A trend towards increased maximal change in the CCF of a driver event is observed between the first and last pre-treatment samples of a given patient based on growth pattern (Kruskal-Wallis). c, Upper panel: Probability for having a carrying capacity K of WBC < 109 cells/L (blue dots) for patients with logistic (LOG), indeterminate (IND) or exponential (EXP) growth patterns. Bottom panel: Growth rates (small circles) together with 70% credible intervals (lines) across the discovery and extension samples, ordered based on probability of logistic growth with samples classified as displaying logistic (LOG) growth, indeterminate growth (IND) or exponential growth.
Extended Data Figure 4
Extended Data Figure 4. Assessment of evolutionary dynamics using sample pairs
Changes of cancer cell fraction (CCF) of subclones represented as two-dimensional pair-wise plots of multi-sample clustering results. Samples at a timepoint (TP) closest to diagnosis (1st) vs the last sample before treatment (preTx) are shown in the left column, samples at last timepoint before and first timepoint after treatment are shown in the right column. Patients are grouped based on those having: a, subclones with significant evolution b, subclones that maintain interclonal balance. Significantly evolving subclones are indicated in orange (Methods), expanding CLL driver mutations are labelled (magenta). c, Examples of genetic evolution from first to last pre-treatment timepoints, and from pre-treatment to relapse samples for Patient 6 (with significant evolution) and Patient 10 (not evolving). Shown are 2D-distributions that reflect the average of the positional distributions of the cluster centres along the MCMC iterations, rather than the final posterior for the cluster centre, which is determined by the normalized product of the pre-clustered distributions of the mutations that were finally assigned to each cluster. Marginal distributions (on the x and y axes) depict the CCF distributions before clustering for each individual mutation. Final cluster assignment is indicated by the colour.
Extended Data Figure 5
Extended Data Figure 5. Detecting subclones and construction of evolutionary phylogenies using simulated data.
a, Bar plots showing the fraction of clustering results on simulated samples that are concordant with the ground truth (or differ by ∆n clusters). Simulations are grouped by low (2) and high (3–8) number of samples per case as well as low (2–9) and high (≥10) number of mutation per subclone. b, Similar CCF accuracy after clustering between simulated WES and WGS data. c, Simulation of a case with 5 samples and 5 subclones present at different CCF levels per sample (black lines- ground truth). The predicted CCF distributions for each cluster are plotted as a function of the number of mutations in the subclone (from 2 to 100). When the number of mutations exceeds ~15–20, the CCF predictions become stable and accurate (low bias and variance). d, Examples of PhylogicNDT BuildTree algorithm results applied to simulated data. Grey shading highlights the correct tree, with percentage of MCMC iterations supporting the trees indicated. e, Analysis of prior selection for clustering and pigeon-hole principle - For a range of priors with varying mean number of clusters, K, the prior for ⍺ is computed, and the Dirichlet Process posteriors for ⍺ and K illustrate how the choice of prior impacts the estimation of K. f, Pigeon-hole principle: for two clusters, A and B (top), the convolution (middle) and difference (bottom) is illustrated. The area above 1.0 CCF of the convolution is consistent with the probability that they are parent-child rather than siblings. The area below 0.0 CCF of the difference represents the probability that cluster B is more prevalent than cluster A.
Extended Data Figure 6
Extended Data Figure 6. Subclonal genetic evolutionary dynamics in the discovery cohort.
a, Subclonal dynamics for each patient in the discovery cohort in relation to tumour load over time in the observed disease course (represented by white blood count [WBC], with dots indicating an available WBC measurement). Arrows—time of sampling with WES. Distinguishable subclones meeting the criteria for confident detection (>10% CCF, in at least one sequenced sample) are coloured. CCFs in time periods between sequenced timepoints were inferred from the closest sequenced sample. b, Subclonal growth patterns of additional patients analogous to Figure 4.
Extended Data Figure 7
Extended Data Figure 7. Subclonal growth rate estimates of patients with non-bounded growth.
For 15 patients with non-bounded growth (EXP and IND) and at least one macroscopic subclone, we show: (i) first column: selected complete phylogenetic trees of subclones; yellow boxes indicate branches that were detectable only in relapse samples. (ii) second column: cluster CCF dynamics over time with 95% credible intervals based on uncertainty of mutation assignment; (iii) third column: pre-treatment growth rates for each generated clone within the most likely phylogeny; (iv) fourth column: relative pre-treatment growth rates of subclones compared to their respective parent subclone.
Extended Data Figure 8
Extended Data Figure 8. Somatic copy number alteration (sCNA) calling from WES, WGS and SNP array data showing highly concordant results
a, results from WES and WGS of CLLs from Patients 1 and 4 and b, in Patient 1 data before and after capture bias correction via tangent normalization and c, in TCGA samples with available paired WES and SNP array data.
Extended Data Figure 9
Extended Data Figure 9. Comparison of PhylogicNDT Clustering results between WES and WGS data.
a, In Patient 1, paired results of WES and WGS data were available for all four timepoints and demonstrate matching cancer cell fractions (CCFs) throughout. CCF posterior distributions for the cluster centres (b) and individual mutations (c) for the corresponding subclones found in WES and WGS data of Patient 1. For Patients 4 and 6, two-dimensional comparisons are illustrated (d, e). Examples for subclones (magenta boxes) with f, significant growth advantage relative to their parent and known driver g, one subclone with significantly accelerated growth but no driver and h, subclones with driver and no growth acceleration.
Figure 1
Figure 1. Growth dynamics and genetic changes in naturally progressing CLL.
a, Schema of diverse growth patterns observable in CLL samples. b, Illustrative patient white blood count (WBC) dynamics over the period between diagnosis and start of treatment. c, Putative CLL drivers detected by analysis of whole-exome sequencing (WES) analysis of pre-treatment serial samples from 21 patients, with assigned growth patterns, IGHV status. Cancer cell fractions (CCF) of mutations are indicated.
Figure 2
Figure 2. Integrative analysis of global CLL growth patterns and genetic attributes in an extension cohort.
a, Examples of logistic (LOG; level of carrying capacity CC) and exponential (EXP; growth rate [% per year)] growth patterns (70% credible intervals provided above each graph). Arrow indicates that patient received treatment. Red dot – time of WES sampling, b, Associations between growth patterns with IGHV status, del(13q) or no driver, trisomy 12 and numbers of total, clonal and subclonal drivers (two-sided Fisher’s exact test). c, Estimated CC (with 70% credible intervals, right axis) for patients with LOG, indeterminate (IND) and EXP growth, defined based on probability of CC posteriors (left axis), from discovery (red) and extension (black) cohorts, n indicates number of independent patients. d, Patients with EXP growth were more likely to require treatment (two-sided Fisher’s exact test). e, Exact logistic regression modelling of need for treatment related to growth pattern for 79 patients having WES of a pre-treatment sample and FISH data, odds ratio (OR) provided with 95% confidence intervals (Extended Data Table 1).
Figure 3
Figure 3. Treatment-associated evolution in relation to leukaemia growth patterns.
a, Pre-treatment growth pattern for 10 patients of the discovery cohort and 4 previously reported patients (asterisked) are related to presence (upper group) or absence (bottom group) of clonal evolution upon relapse (two-sided Fisher’s exact test). b, Examples of integrated WBC dynamics (black dots indicate measurements) and genetic evolution between diagnosis and relapse for exponential growth and evolving subclones (Patient 6), or indeterminate growth and inter-clonal balance (Patient 10). Colours indicate subclones. Arrows indicate timing of samples. Insets—2D visualizations of changes in CCF across timepoints (TP).
Figure 4
Figure 4. Subclonal growth patterns in untreated CLLs.
Subclonal CLL growth patterns, estimated using PhylogicNDT, in overall logistic growth (a) and overall exponential growth (b). P-values represent significance of rejecting the null hypothesis of exponential growth, based on the proportion of Markov Chain Monte Carlo (MCMC) iterations (magenta). The natural logarithms of numbers of cells in each clone (WBC/mL) are plotted against years from diagnosis. Error bars and trajectories represent uncertainties estimated by the MCMC. Analysis of Patients 5, 18 and 19 in Extended Data Figure 6b, and associated WGS analysis in Extended Data Figures 8–9.
Figure 5
Figure 5. Selective growth advantage of subclones in CLL.
Examples for subclones (magenta circles) with a, significant growth advantage relative to their parent and known drivers and b, a subclone without driver and no growth acceleration. Results from PhylogicNDT analysis include: most likely phylogenetic tree (left); permutations of sSNVs during tree construction yielding posterior CCFs of the clusters (with 95% credible intervals) (middle); and growth rates relative to parental clones (right). Significance of differential growth rate (ΔGR>0) was estimated based on the MCMC. c, Linear mixed model for difference between clones without (n=20) and with (n=15) putative CLL drivers. Black outline - significant growth advantage. Horizontal black line indicates median values, with whiskers extending to minimum and maximum values on the boxplots.

References

    1. Wodarz D & Komarova NL Dynamics of cancer : mathematical foundations of oncology (World Scientific, 2014).
    1. Burger JA et al. Clonal evolution in patients with chronic lymphocytic leukaemia developing resistance to BTK inhibition. Nat Commun 7, 11589, doi:10.1038/ncomms11589 (2016). - DOI - PMC - PubMed
    1. Diaz LA Jr. et al. The molecular evolution of acquired resistance to targeted EGFR blockade in colorectal cancers. Nature 486, 537–540, doi:10.1038/nature11219 (2012). - DOI - PMC - PubMed
    1. Norton L A Gompertzian model of human breast cancer growth. Cancer Res 48, 7067–7071 (1988). - PubMed
    1. Spratt JA, von Fournier D, Spratt JS & Weber EE Decelerating growth and human breast cancer. Cancer 71, 2013–2019 (1993). - PubMed

Publication types

MeSH terms