. 2019 Jun;25(6):1012-1021.
doi: 10.1038/s41591-019-0450-2. Epub 2019 May 29.

The vaginal microbiome and preterm birth

Affiliations

The vaginal microbiome and preterm birth

Jennifer M Fettweis et al. Nat Med. 2019 Jun.

Abstract

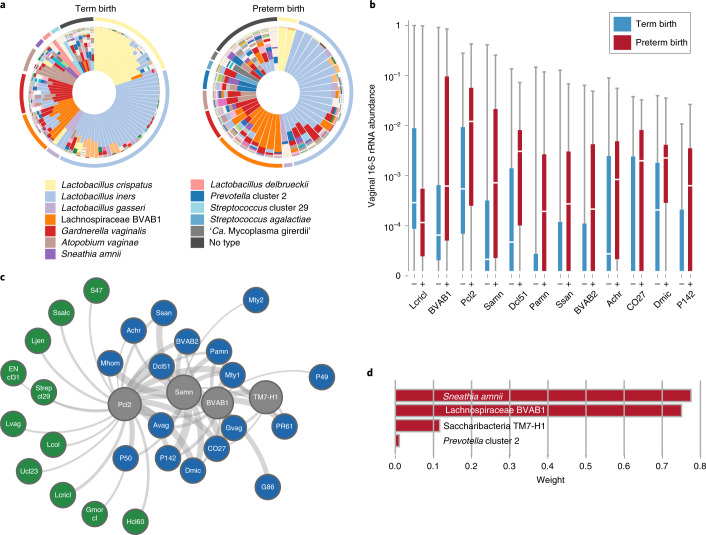
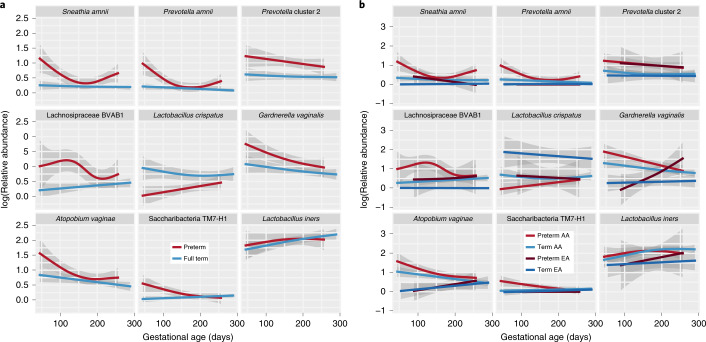
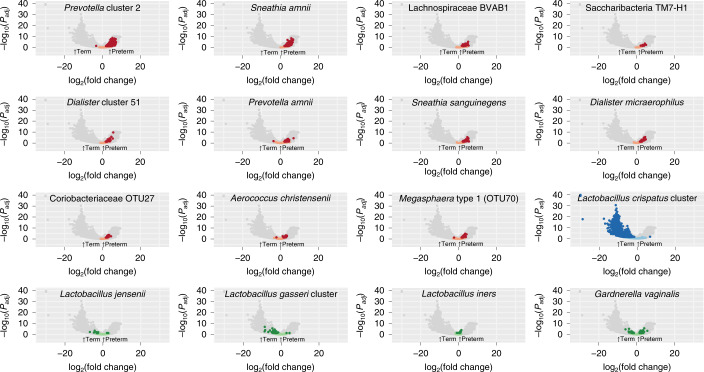
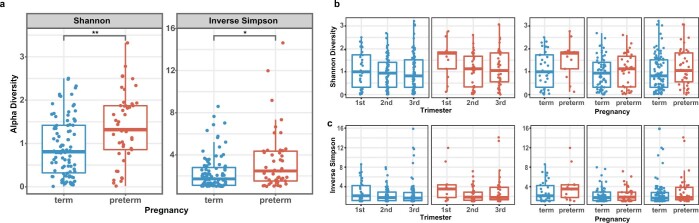
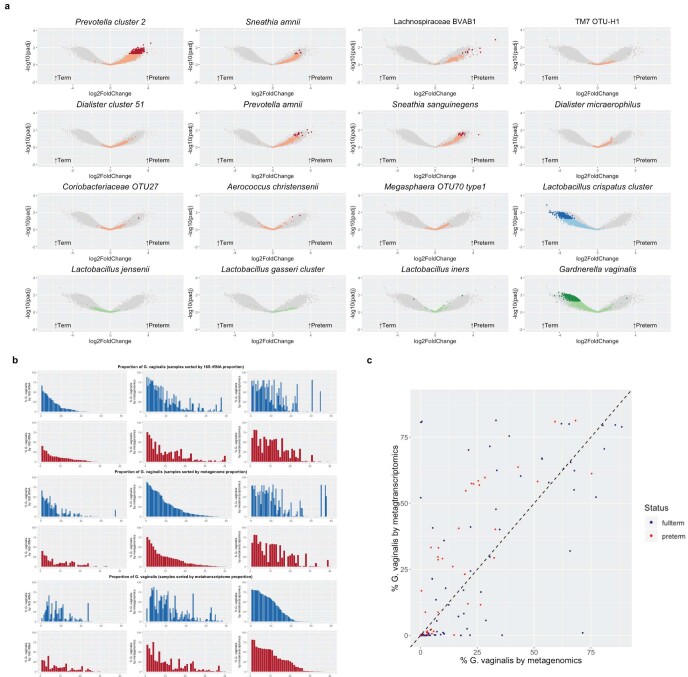
The incidence of preterm birth exceeds 10% worldwide. There are significant disparities in the frequency of preterm birth among populations within countries, and women of African ancestry disproportionately bear the burden of risk in the United States. In the present study, we report a community resource that includes 'omics' data from approximately 12,000 samples as part of the integrative Human Microbiome Project. Longitudinal analyses of 16S ribosomal RNA, metagenomic, metatranscriptomic and cytokine profiles from 45 preterm and 90 term birth controls identified harbingers of preterm birth in this cohort of women predominantly of African ancestry. Women who delivered preterm exhibited significantly lower vaginal levels of Lactobacillus crispatus and higher levels of BVAB1, Sneathia amnii, TM7-H1, a group of Prevotella species and nine additional taxa. The first representative genomes of BVAB1 and TM7-H1 are described. Preterm-birth-associated taxa were correlated with proinflammatory cytokines in vaginal fluid. These findings highlight new opportunities for assessment of the risk of preterm birth.


Conflict of interest statement

J.K. and Y.C.T. are full-time employees at Pacific Biosciences, a company developing single-molecule sequencing technologies. No other authors report any competing interests.

Figures

Fig. 1
Fig. 1. MOMS-PI resources.
a, An overview of the study designs for the MOMS-PI PTB study (45 spontaneous preterm (sPTB) cases and 90 term controls) and the MOMS-PI TB study (90 women who delivered at term or early term and their neonates). Both cohorts were selected from the phase 1 RAMS Registry cohort (n = 627). b, Omics data were generated from samples from the MOMS-PI PTB and MOMS-PI TB studies and 384 additional pregnancies from the overall MOMS-PI cohort. Samples from the 12 women who were selected for both the MOMS-PI PTB study and the MOMS-PI TB study are depicted under both studies. Omics data types include 16S rRNA amplicon sequencing, metagenomic sequencing (MGS), metatranscriptomic sequencing (MTS), host cytokine assays and lipidomics. c, A total of 206,437 samples were collected at more than 7,000 visits from 1,572 pregnancies in the MOMS-PI study, and are archived in the RAMS Registry.
Fig. 2
Fig. 2. Bacterial taxa associated with spontaneous PTB.
a, Vagitypes of 90 women who delivered at term (≥39 weeks of gestation), and 45 women who delivered prematurely (<37 weeks of gestation) showing 13 community states, or vagitypes. b, Abundance of taxa significantly different in PTB (n = 45) and TB (n = 90) cohorts. These taxa have P <0.05 for the Mann–Whitney U-test (two-sided) for difference in proportional abundance between the cohorts, corrected using the Benjamini–Hochberg procedure with an FDR of 5%. TB is indicated in blue as (–) and PTB in red as (+). Boxes show the median and interquartile range; whiskers extend from minimum to maximum values within each cohort. c, Network analysis of four taxa highly associated with PTBs. Negative correlations are shown in green, positive correlations in blue and predictive taxa in gray. Edge weights represent the strength of correlation. See Supplementary Table 3 for abbreviations. d, Predictive linear model for PTBs that produces a score based on weighted log(abundances) of four taxa in vaginal 16S rRNA profiles in the 6- to 24-week gestational age range. Taxa abbreviations: Lcricl, L. crispatus cluster; BVAB1, Lachnospiraceae BVAB1; Pcl2, Prevotella cluster 2; Samn, S. amnii; Dcl51, Dialister cluster 51; Pamn, P. amnii; BVAB2, Clostridiales BVAB2; CO27, Coriobacteriaceae OTU27; Dmic, Dialister micraerophilus; P142, Parvimonas OTU142.
Fig. 3
Fig. 3. Longitudinal GAMM of vaginal microbiome composition during pregnancy.
The model incorporates BMI, vaginal pH, pregnancy outcome (PTB, TB), a smoother for gestational age and a random subject effect to longitudinally model log-transformed relative abundances of vaginally relevant taxa (see Methods). Each figure plots log-transformed abundances of taxa throughout pregnancy. a, Plots comparing the PTB case (n = 41) and TB cohorts (n = 90). b, Comparison of the results from preterm and full-term women of African and European ancestry (that is, EA PTB, n = 7; AA PTB, n = 31; EA TB, n = 13; AA TB, n = 73). Confidence intervals (98%) are shown.
Fig. 4
Fig. 4. Volcano plot depicting transcripts that differ greatly between term and preterm cohorts in metatranscriptomics data for taxa of interest.
Analysis was performed by mapping reads from PTB (n = 41) and TB (n = 81) samples to a custom database of genomes representing 56 taxa. Comparative analysis was performed with DESeq2 using a global scaling approach. Genes in candidate PTB taxa identified in 16S rRNA analyses that differ significantly at Padj < 0.05 with a two-sided Wald test, as implemented in DESeq2 with a Benjamini–Hochberg FDR correction, are shown in red and those that were not statistically significant are shown in pink. Genes are also shown for the L. crispatus cluster (associated with TB in the 16S rRNA analyses), with genes that differ significantly (Padj < 0.05) in transcript levels shown in dark blue and those that do not in light blue. Four other common and abundant taxa (L. jensenii, L. gasseri cluster, L. iners and G. vaginalis) are shown, with dark green dots denoting genes that differ significantly (Padj < 0.05) between cohorts and light green dots denoting those that were not statistically significant.
Fig. 5
Fig. 5. Sparse canonical correlation analysis.
a,b, Cytokine abundance in vaginal samples from women who experienced TB (n = 90) (a) or PTB (n = 41) (b) were subjected to an integrative sCCA using log-transformed cytokine levels and log-transformed taxonomic profiling data (see Methods). Blue circles represent bacterial taxa and red diamonds represent cytokines. Note that the component 1 axis for the TB sCCA (left) has been reversed for effective visual comparison with PTB sCCA. See Supplementary Table 3 for abbreviations. Note that, in sCCA analysis, factors (cytokines or microbial taxa) that are clustered tightly are highly correlated, and factors that are distant from each other are inversely correlated.
Extended Data Figure 1
Extended Data Figure 1. Species-level vaginal microbiome composition in women who experience TB or PTB.
Stacked bar charts illustrating the vaginal microbiome profiles from 16S rRNA surveys of one sample per trimester from each pregnancy. Samples are ordered according to decreasing relative abundance. Twenty-nine abundant taxa of interest are shown with all others pooled into ‘Other’.
Extended Data Figure 2
Extended Data Figure 2. Alpha diversity measures for PTB and TB cohorts.
a, Shannon index and inverse Simpson index for the cross-sectional cohort in Fig. 2 (PTB n = 45, TB n = 90) shows that alpha diversity is significantly higher (P = 0.0026, P = 0.12, respectively) in the preterm cohort using two-sided Wilcoxon’s test followed by a P value adjustment using Bonferroni’s correction with 5% FDR. Boxes show median and interquartile range; whiskers extend from minimum to maximum values within each cohort. b,c Shannon index (b) and inverse Simpson index (c) diversity measures are shown with comparisons by trimester (TB first trimester: n = 30; PTB first trimester: n = 13; TB second trimester: n = 64; PTB second trimester: n = 35; TB third trimester: n = 90; PTB third trimester: n = 40). The Kruskal–Wallis two-sided test (analysis of variance) was used followed by post-hoc pairwise comparison with Bonferroni’s correction and 5% FDR. Comparison within trimesters was performed using two-sided Wilcoxon’s test with Bonferroni’s P value adjustment. Boxes show median and interquartile range; whiskers extend from minimum to maximum values within each cohort. For the trimester comparisons, no tests were significant.
Extended Data Figure 3
Extended Data Figure 3. Taxa that significantly differ in PTB and TB cohorts.
The distributions of proportional abundance of taxa greatly differ in PTB (n = 31) and TB (n = 59) cohorts; the earliest sample available for each subject within the first 24 weeks of pregnancy was used for each subject. Abundance values below 0.001 were rounded down to 0. The taxa are: BVAB1: Lachnospiraceae BVAB1, Pcl2: Prevotella cluster 2, Mty1: Megasphaera OTU70 type1, Samn: Sneathia amnii, TM7: TM7-H1, Dcl51: Dialister cluster 51, Pamn: Prevotella amnii, BVAB2: Clostridiales BVAB2, Dmic: Dialister micraerophilus and P142: Parvimonas OTU142. These 10 taxa have P <0.05 to support a significant difference in proportional abundance between PTB and TB cohorts using a Mann–Whitney U-test (two-sided) and the Benjamini–Hochberg correction procedure with an FDR of 5%. Boxes show median and interquartile range; whiskers extend from minimum to maximum values within each cohort. b,c, Scatter plot of the PTB predictive score returned by the model (horizontal axis) plotted against gestational age at birth (vertical axis). Each point corresponds to a sample from a subject: red, PTB subjects (n = 31); blue, TB subjects (n = 59). c, Shows more detailed view of the region where most (48 of 59) of the TB samples are located.
Extended Data Figure 4
Extended Data Figure 4. Assignment of metatranscriptomics and metagenomics quality-filtered reads in PTB and TB cohorts.
Non-human reads were mapped to a custom database corresponding to 56 bacterial taxa. Values are shown as the percentage abundance.
Extended Data Figure 5
Extended Data Figure 5. Metabolic pathway abundance by vagitype.
a, Stacked barplots showing the vaginal microbial profiles from 16S rRNA surveys; b, the metabolic pathway abundances from paired MGS (top panel) and MTS (bottom panel) of vaginal samples collected during pregnancies of 90 women who delivered at term (≥39 weeks) (left) and 45 women who delivered preterm (<37 weeks) (right). Results show the top 10 metabolic pathways calculated by HUMAnN2. c,d, The presence of the UDP-N-acetyl-d-glucosamine biosynthesis pathway and non-oxidative branch of pentose phosphate pathway differ between L. crispatus and other vagitypes as measured by MGS data (c) (L. crispatus UDPNAGSYN: n = 32, Other UDPNAGSYN: n = 59; L. crispatus NONOXYPENT-PWY: n = 14, Other NONOXYPENT-PWY: n = 138; L. crispatus PWY-5100: n = 25,Other PWY-5100: n = 156) and MTS data (d) (L. crispatus UDPNAGSYN: n = 33, Other UDPNAGSYN: n = 117; L. crispatus NONOXYPENT-PWY: n = 33, Other NONOXYPENT-PWY: n = 157; L. crispatus PWY-5100: n = 33,Other PWY-5100: n = 159). Two-sided Wilcoxon’s P test (P <0.05) with Bonferroni’s adjustment at a 5% FDR threshold was used. Boxes show median and interquartile range; whiskers extend from minimum to maximum values within each cohort.
Extended Data Figure 6
Extended Data Figure 6. Comparison of the proportional abundance of taxa by 16S rRNA (left), metagenomics (middle) and metatranscriptomics (right) in term (blue) and preterm (red) cohorts.
Proportional abundance is shown relative to the 56 bacterial taxa that were measured across all three assays. The 16S rRNA, metagenomics and metatranscriptomics measures from PTB (n = 41) and TB (n = 81) were from a single time point per participant. The y axis is scaled based on the maximum proportional abundance for the taxon.
Extended Data Figure 7
Extended Data Figure 7. Genes differing in metagenomic and metatranscriptomic data between term and preterm cohorts.
a, Volcano plot depicting genes that significantly differ between term (n = 41) and preterm (n = 81) cohorts in metagenomics data. Genes mapping to PTB-associated taxa, the L. crispatus cluster and four other common taxa that significantly differ at Padj < 0.05 (two-sided) with FDR correction are shown in dark red, dark blue and dark green, respectively. b, Comparison of proportional abundance of G. vaginalis in preterm (red) and term (blue) vaginal samples as assayed by 16S rRNA (left), metagenomics (middle) and metatranscriptomics (right), sorted by 16S rRNA (top), metagenomics (middle) and metatranscriptomics (bottom) data. c, Scatter plot of the abundance of G. vaginalis by metagenomics (x axis) and abundance of G. vaginalis by metatranscriptomics (y axis) in pregnant women who delivered term (blue) or preterm (red). Two-sided Wilcoxon’s test of the ratio of the log-transformed proportions (log(metatranscriptomics G. vaginalis proportion)/log(G. vaginalis metagenomics proportion)) showed a significant difference between term and preterm groups (P = 0.01069).
Extended Data Figure 8
Extended Data Figure 8. Genes predicted to encode secreted proteins or to be involved in bacterial secretion systems in metatranscriptomics and metagenomics datasets.
Genes predicted to encode secreted proteins or to be involved in bacterial secretion systems that have very different transcript levels (a) or very different levels in metagenomics data (b) in term (n = 81) and preterm (n = 41) cohorts. Analysis was performed by mapping metatranscriptomics (a) or metagenomics (b) reads to a customized database of genomes representing 56 taxa. Comparative analysis was performed with DESeq2 using a global scaling approach. All genes with an FDR-adjusted Padj < 0.05 (two-sided test), which are also predicted to be involved in bacterial secretion as identified by MacSyFinder, are shown and colored by taxon.
Extended Data Figure 9
Extended Data Figure 9. Distribution of sampling and gestational age at delivery across studies of the vaginal microbiome and PTB.
The panels show the distribution of the gestational age at sampling (a) and gestational age at delivery (c) in preterm cases (left) and term controls (right) across four studies: the present study (top), the Stout et al. study, the Romero et al. study and the Callahan et al. UAB cohort (bottom), as originally published, and in b,d for the reanalyzed cohorts.
Extended Data Figure 10
Extended Data Figure 10. Proportional abundance shown as a log scale of candidate taxa identified in the present study across four PTB cohorts.
ad, Abundance values below 0.001 were rounded down to 0. Boxes show median and interquartile range; whiskers extend from minimum to maximum values within each cohort for the present study (PTB n = 45, TB n = 90) (a), the Stout et al. replication cohort (PTB n = 5, TB n = 10) (b), the Romero et al. cohort (PTB n = 18, TB n = 36) (c) and the Callahan et al. UAB replication cohort (PTB n = 10, TB n = 20) (d). The Mann–Whitney U-test (two-sided) for difference in proportional abundance between the PTB and TB cohorts, corrected using the Benjamini–Hochberg procedure with an FDR of 5% did not show statistical significance for these taxa in the cohorts shown in bd. The earliest sample available for each subject was used (f). Earliest samples for the original four cohorts are shown in e.

Comment in

References

    1. Blencowe, H. et al. National, regional, and worldwide estimates of preterm birth rates in the year 2010 with time trends since 1990 for selected countries: a systematic analysis and implications. Lancet379, 2162–2172 (2012). - PubMed
    1. Liu, L. et al. Global, regional, and national causes of under-5 mortality in 2000–15: an updated systematic analysis with implications for the Sustainable Development Goals. Lancet388, 3027–3035 (2016). - PMC - PubMed
    1. Marret, S. et al. Neonatal and 5-year outcomes after birth at 30–34 weeks of gestation. Obstet. Gynecol.110, 72–80 (2007). - PubMed
    1. Wolke, D., Eryigit-Madzwamuse, S. & Gutbrod, T. Very preterm/very low birthweight infants’ attachment: infant and maternal characteristics. Arch. Dis. Child. Fetal Neonat. Ed.99, F70–F75 (2014). - PubMed
    1. Behrman, R. E. & Butler, A. S. (eds), for Institute of Medicine Committee on Understanding Premature Birth and Assuring Healthy Outcomes. Societal Costs of Preterm Birth (National Academies Press, 2007).

Publication types

MeSH terms