. 2019 Jun;25(6):1001-1011.
doi: 10.1038/s41591-019-0465-8. Epub 2019 May 29.

Racioethnic diversity in the dynamics of the vaginal microbiome during pregnancy

Affiliations

Racioethnic diversity in the dynamics of the vaginal microbiome during pregnancy

Myrna G Serrano et al. Nat Med. 2019 Jun.

Abstract

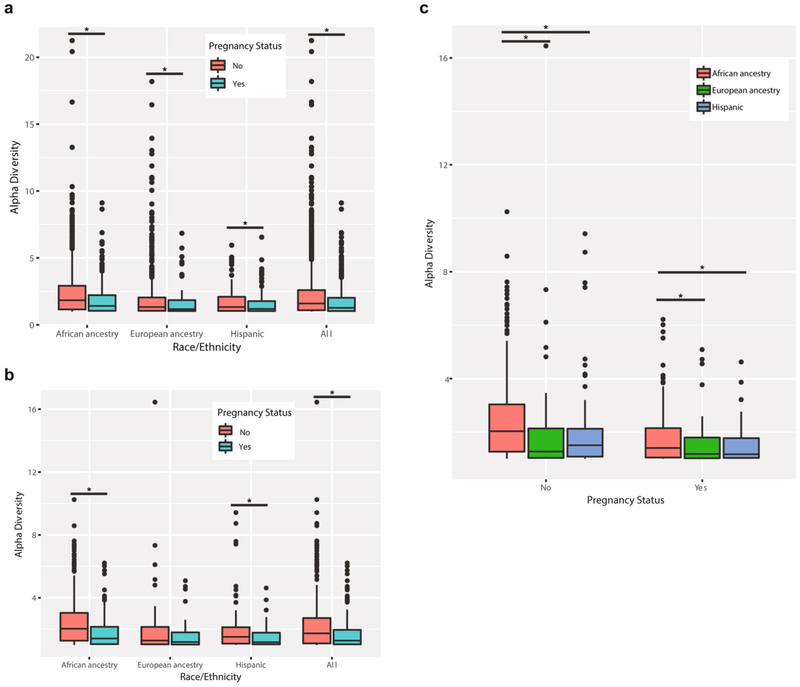
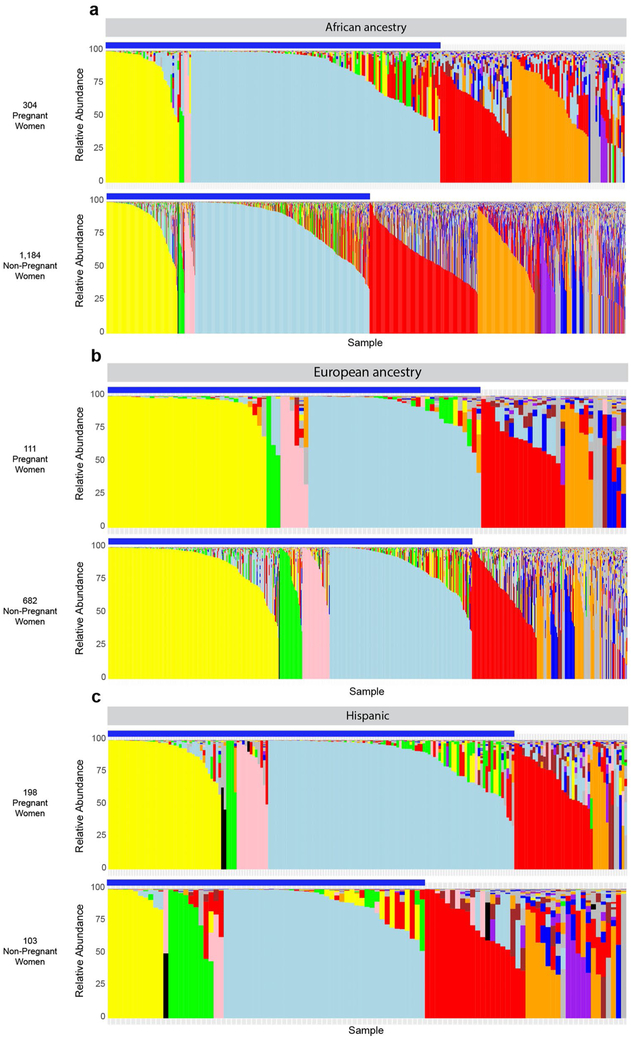
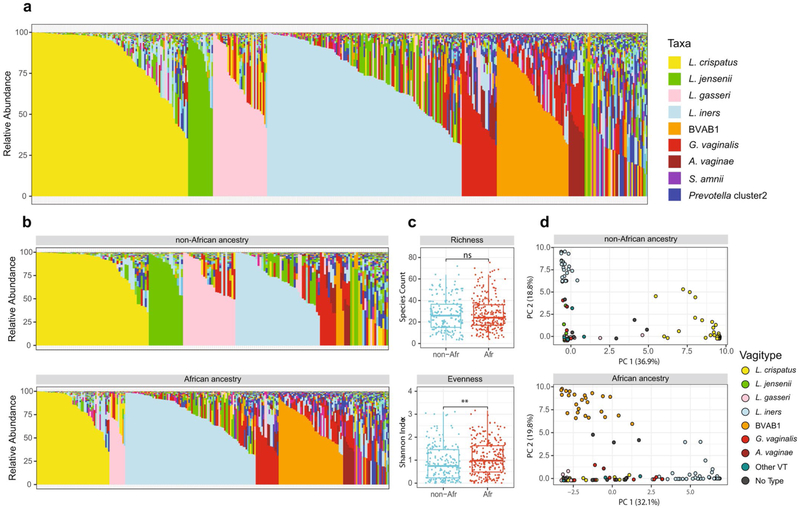
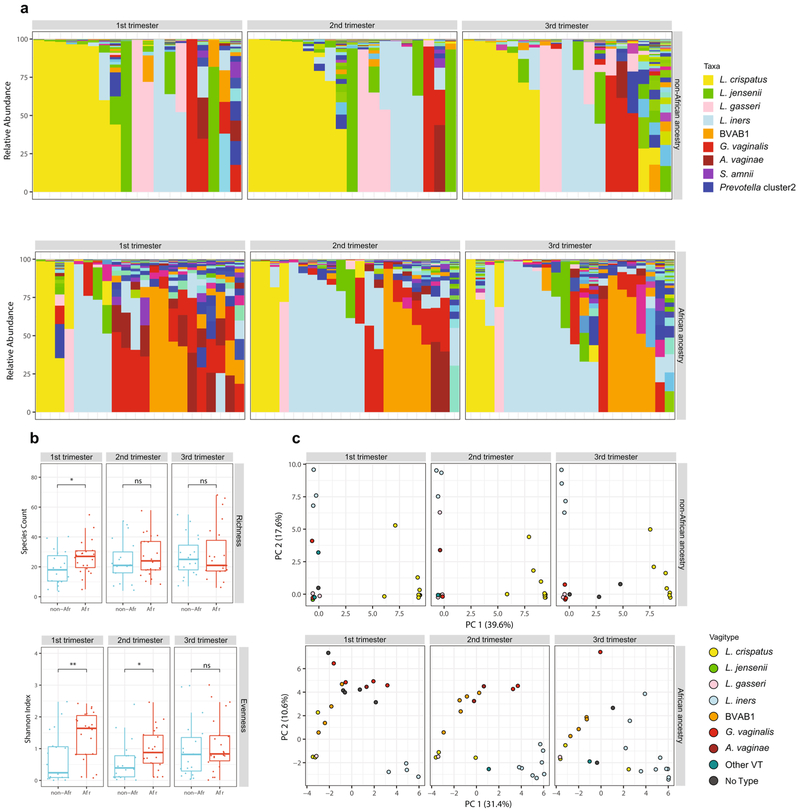
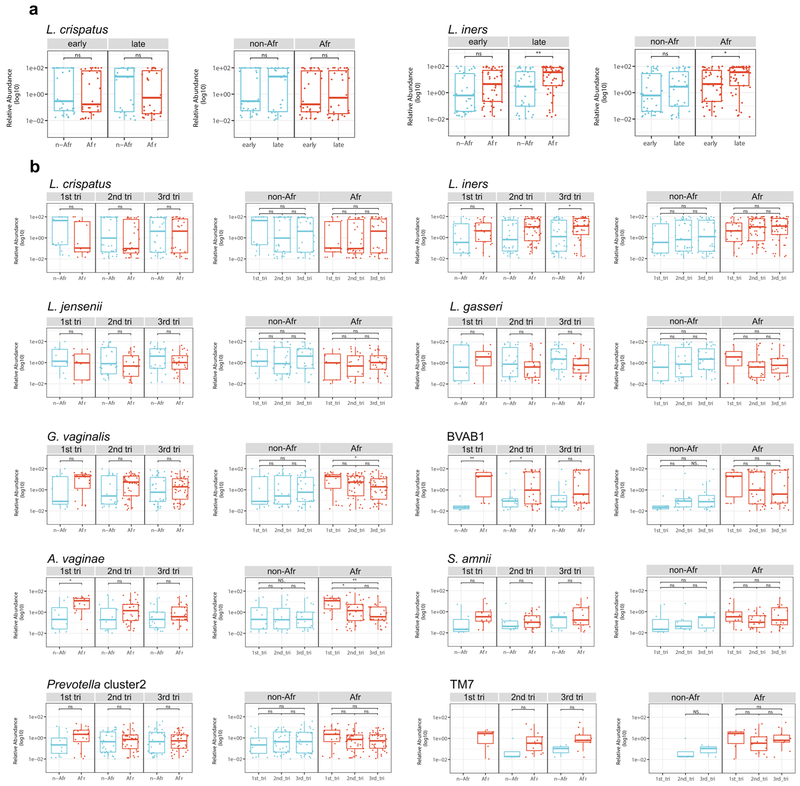
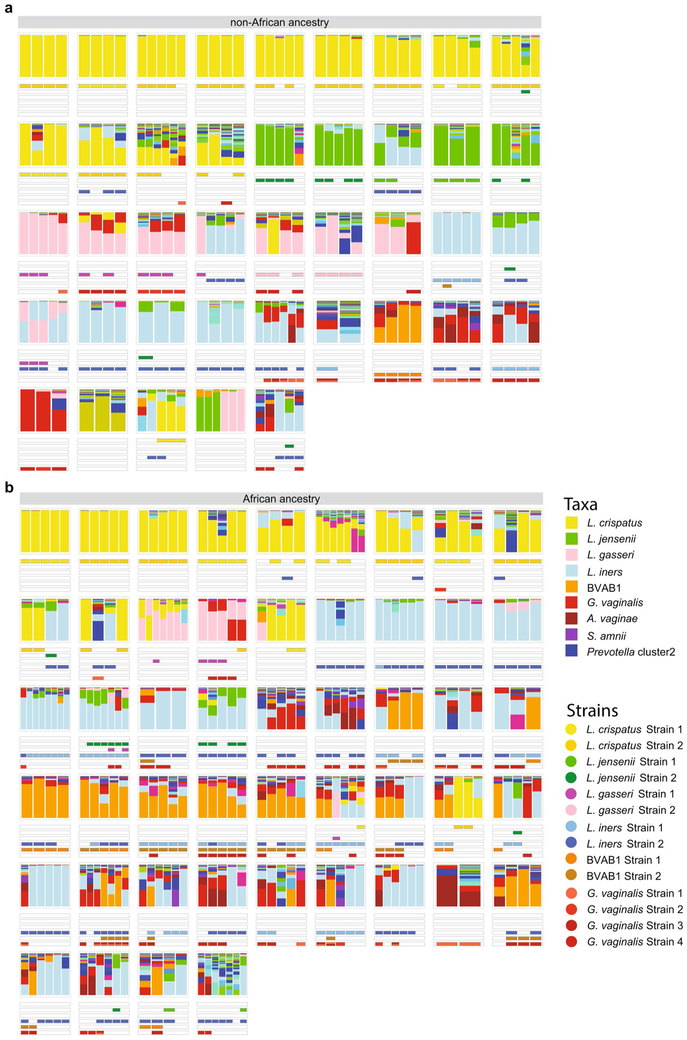
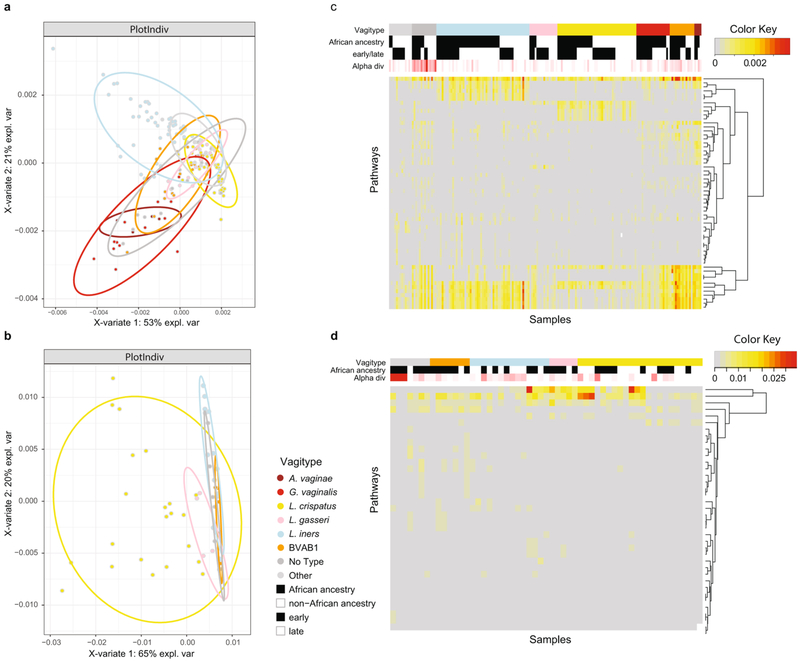
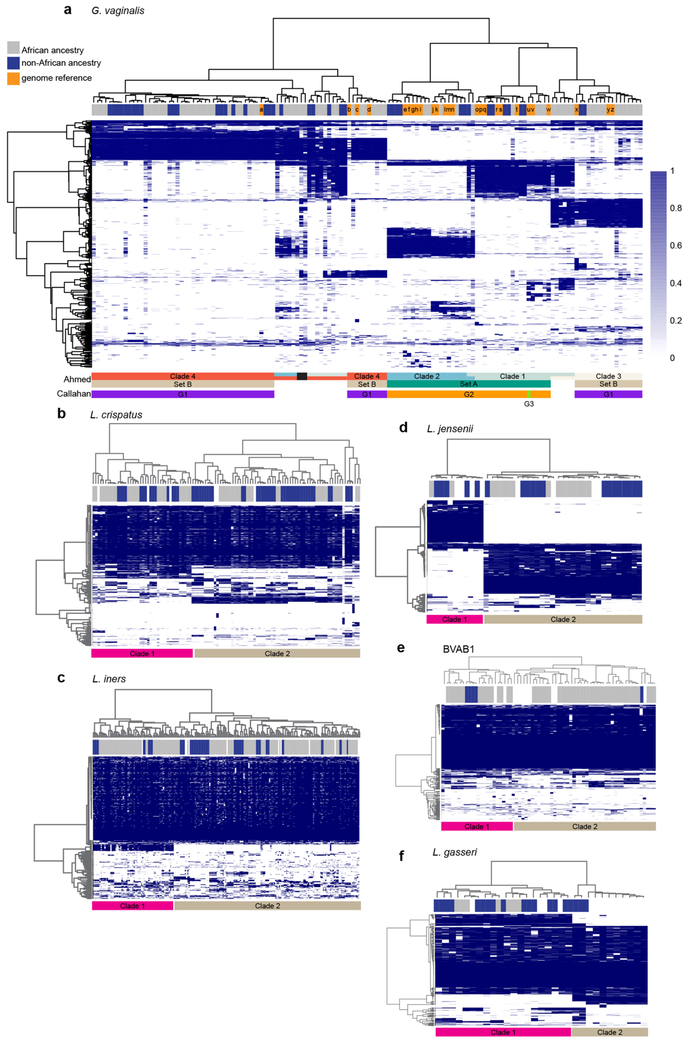
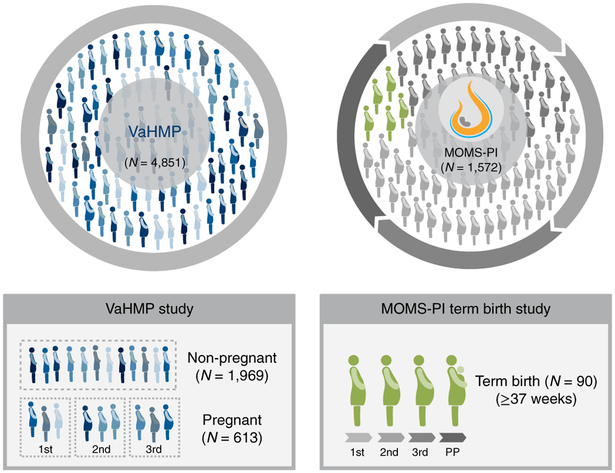
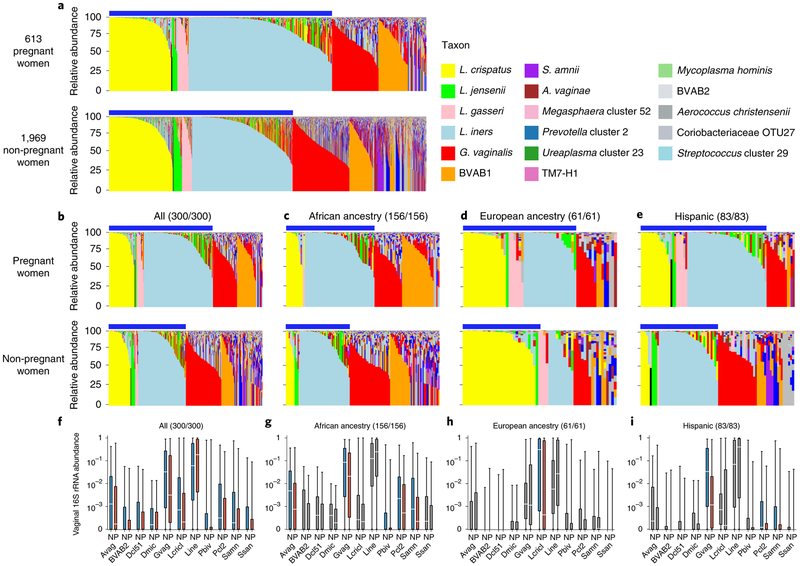
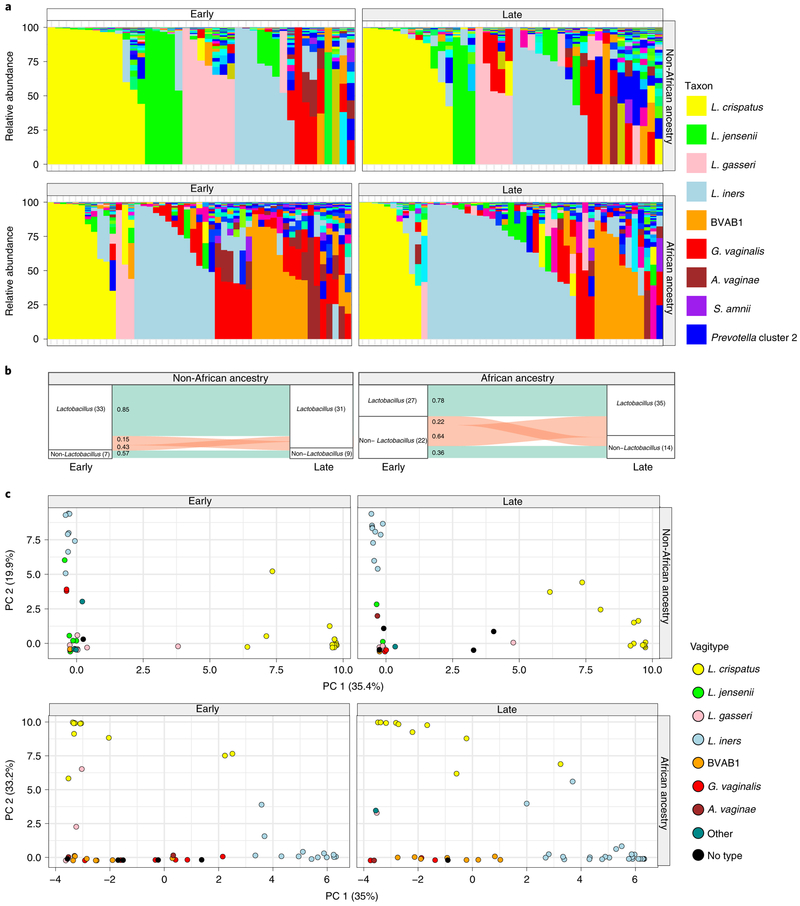
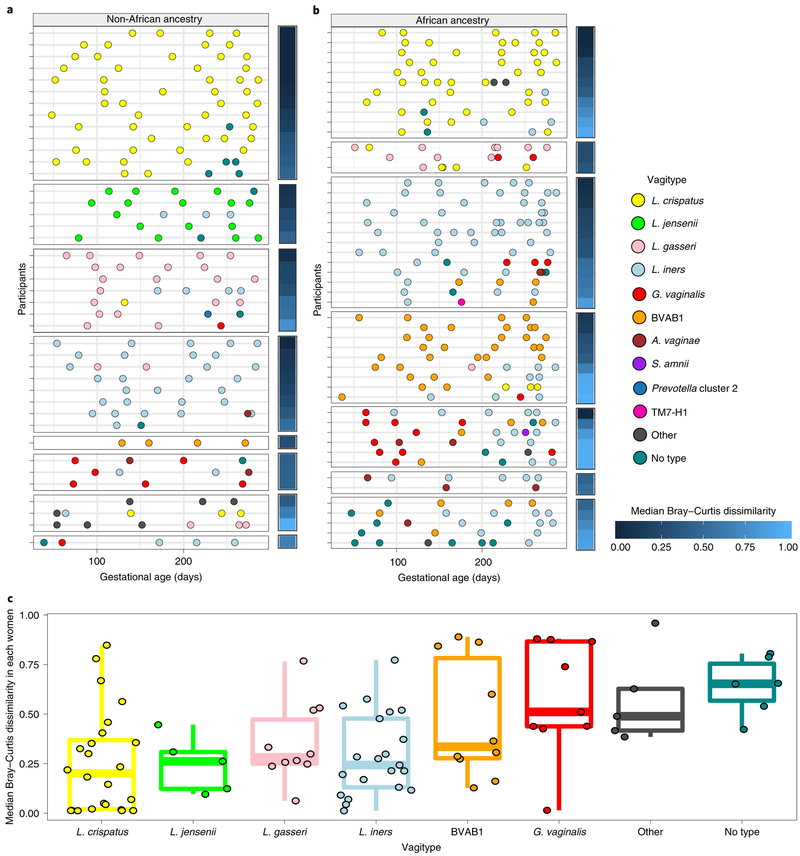
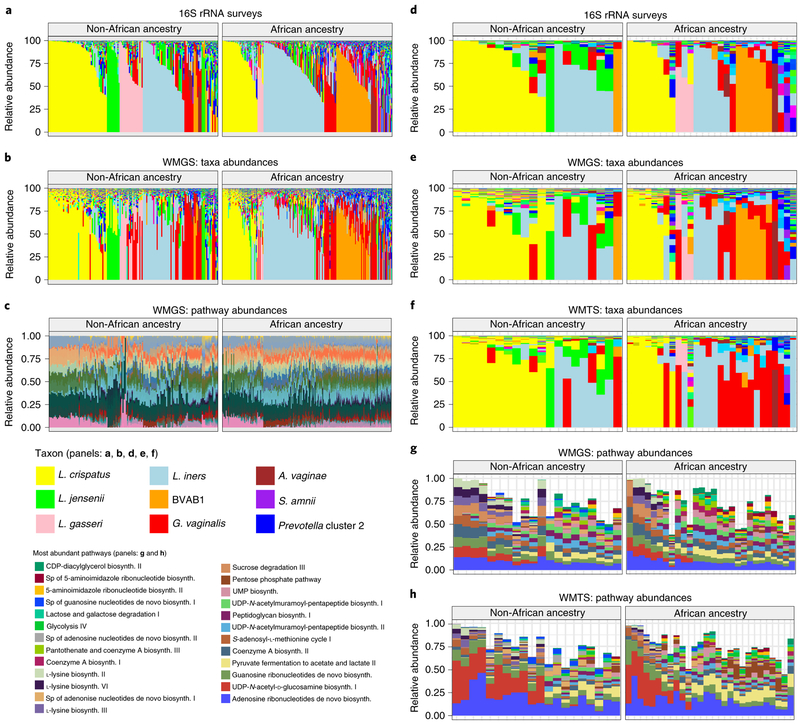
The microbiome of the female reproductive tract has implications for women's reproductive health. We examined the vaginal microbiome in two cohorts of women who experienced normal term births: a cross-sectionally sampled cohort of 613 pregnant and 1,969 non-pregnant women, focusing on 300 pregnant and 300 non-pregnant women of African, Hispanic or European ancestry case-matched for race, gestational age and household income; and a longitudinally sampled cohort of 90 pregnant women of African or non-African ancestry. In these women, the vaginal microbiome shifted during pregnancy toward Lactobacillus-dominated profiles at the expense of taxa often associated with vaginal dysbiosis. The shifts occurred early in pregnancy, followed predictable patterns, were associated with simplification of the metabolic capacity of the microbiome and were significant only in women of African or Hispanic ancestry. Both genomic and environmental factors are likely contributors to these trends, with socioeconomic status as a likely environmental influence.


Figures

Extended Data Fig. 1 ∣
Extended Data Fig. 1 ∣. Differences in microbiome diversity in pregnant and non-pregnant women of different ancestry.
a, Differences in alpha diversities of the vaginal microbiomes in 613 pregnant and 1,969 non-pregnant women of different racial descendance due to pregnancy. b, Differences in alpha diversities of the vaginal microbiomes of 300 pregnant and 300 non-pregnant women of different racial descendance case-matched for race, age and socioeconomic status due to pregnancy. c, Differences in alpha diversities of the vaginal microbiomes of 300 pregnant and 300 non-pregnant women of different racial descendance case-matched for race, age and socioeconomic status. Box plots were generated in R using standard approaches. The bar represents the median and the boxes indicate interquartile ranges. Significant differences are indicated (*P < 0.05).
Extended Data Fig. 2 ∣
Extended Data Fig. 2 ∣. Effects of pregnancy on the vaginal microbiome in different racial backgrounds.
a, Microbiome profiles of 304 pregnant women (upper panel) and 1,184 non-pregnant women of African ancestry. b, Microbiome profiles of 111 pregnant women of European ancestry and 682 non-pregnant women of European ancestry. c, Microbiome profiles of 198 pregnant women of Hispanic ancestry and 103 non-pregnant women of Hispanic ancestry. Legend is as shown for Fig. 2. The blue bars denote the Lactobacillus taxa (L. crispatus, L. jensenii, L. gasseri and L. iners).
Extended Data Fig. 3 ∣
Extended Data Fig. 3 ∣. Vaginal microbiome profiles of 90 women, 49 of African and 41 of non-African ancestry.
a, Microbiome profiles of all samples (421 total, 175 from women of non-African ancestry and 246 from women of African ancestry) from each of these 90 women. Taxa are color-coded as indicated. b, Microbiome profiles of these same samples from women of non-African (top) and African ancestry (bottom). Taxa are color-coded as in a. c, Alpha diversity measures of richness (species counts) and evenness (Shannon index) of these samples (described in a) from women of non-African (n-Afr) and African (Afr) ancestry, measured using the vegan package. Alpha diversities and statistical analysis were calculated as indicated in the Methods. Box plots were generated in R using standard approaches. The bar represents the median and the boxes indicate interquartile ranges. d, L1-Norm PCA analysis of the same samples (see Methods). Legend of vagitypes is as indicated. See Supplementary Table 5 for sequence read statistics for data presented in this figure.
Extended Data Fig. 4 ∣
Extended Data Fig. 4 ∣. Longitudinal changes in microbiome profiles across trimesters during pregnancy.
a, Vaginal microbiome profiles of 41 pregnant women of African (n = 22) or non-African (n = 19) ancestry who provided at least 1 sample from each of 3 trimesters. b, Alpha diversity measures of richness (species counts) and evenness (Shannon index) of samples from a. Diversity measures calculated using the vegan package (see Methods). Box plots were generated in R using standard approaches. The bar represents the median and the boxes indicate interquartile ranges. Asterisks indicate statistical significance (*P < 0.05; **P < 0.01). c, L1-Norm PCA analysis (see Methods) of samples from a. Legends are indicated. n-Afr, women of non-African ancestry; Afr: women of African ancestry. See Supplementary Table 5 for sequence read statistics for data presented in this figure.
Extended Data Fig. 5 ∣
Extended Data Fig. 5 ∣. Changes in abundance of taxa across pregnancy.
a, Relative abundances of L. crispatus and L. iners in 1 early and 1 late sample from each of 90 participants, 41 of non-African (n-Afr) and 49 of African (Afr) ancestry. b, Longitudinal differences in relative abundance of select taxa—L. crispatus, L. iner, L. jensenii, L. gasseri, G. vaginalis, BVAB1, A. vaginae, S. amnii, Prevotella cluster 2 and TM7_OTU-H1, from 1 sample collected in each trimester from 90 participants, 41 of non-African (n-Afr) and 49 of African (Afr) ancestry. For both a and b, the medians for each group were compared using a two-sided Wilcoxon test, with FDR adjustments for multiple comparisons where applicable (ns, not significant; *P < 0.05; **P < 0.01).
Extended Data Fig. 6 ∣
Extended Data Fig. 6 ∣. Stability of vagitypes in pregnancy showing the variation of the microbiomes of each woman across all samples collected during that pregnancy.
a, Vaginal microbiome profiles from 41 women of non-African ancestry. Each facet represents the data from a single participant across all vaginal samples collected during her pregnancy. The samples, within each facet, are ordered from left to right based on their gestational age at sampling; same as Fig. 3a,b. The bars below each stacked bar indicate the strain of L. crispatus (1 or 2), L. jensenii (1 or 2), L. gasseri (1 or 2), L. iners (1 or 2), BVAB1 (1 or 2) or G. vaginalis (1, 2, 3 or 4). b, Vaginal microbiome profiles from 49 women of African ancestry. As for Extended Data Fig. 7, each facet represents the data from a single participant across all vaginal samples collected during her pregnancy. The samples, within each facet, are ordered from left to right based on their gestational age at sampling; same as Fig. 3a,b. The bars below each stacked bar indicate the strain of L. crispatus (1 or 2), L. jensenii (1 or 2), L. gasseri (1 or 2), L. iners (1 or 2), BVAB1 (1 or 2) or G. vaginalis (1, 2, 3 or 4).
Extended Data Fig. 7 ∣
Extended Data Fig. 7 ∣. Functional metabolic potential and transcriptional activity in vaginal microbiomes cluster according to vagitype.
a, Sparse partial least squares discriminant analysis (PLS-DA) of pathways derived from metagenomic sequence analysis of all 373 samples (147 samples from the 41 women of non-African ancestry, and 226 samples from the 49 women of African ancestry) from the 90 women in this study. Samples are color-coded according to vagitype (see legend). b, Sparse PLS-DA of pathways derived from metatranscriptomic sequence analysis of 1 sample from each pregnancy taken in the second or early third trimester (20 samples from the women of non-African ancestry and 28 from the women of African ancestry). c, Heat map of pathways from metagenomic analysis of samples as for a. Samples are sorted according to major vagitype (see legend). Samples from women of African ancestry (African) and from prior to 26 weeks’ gestation (early) are indicated. Alpha diversity is shown. d, Heat map of pathways from metatranscriptomic analysis of samples as for b. Samples are sorted as in c. Abundance and alpha diversity value scales are indicated. Sparse PLS-DA is a technique for fitting classification models that simultaneously selects features (via an L1 norm penalty term) that best describe group separation. The resulting model is sparse so that only a small subset of bacteria is included; the discriminant functions allow for visualization of the classification rule.
Extended Data Fig. 8 ∣
Extended Data Fig. 8 ∣. Association of G. vaginalis, L. crispatus, L. jensenii, L. gasseri, L. iners and Lachnospiracea BVAB1 strains with ancestry and other taxa.
Samples with these taxa were analysed in parallel with known reference strains using PanPhlan software to discriminate strain designations using default parameters of -min_coverage 1 (see Methods). a, G. vaginalis. Using these parameters, 121 samples provided sufficient numbers of G. vaginalis reads to provide accurate strain designations. Strain designations, which were previously reported by Ahmed et al. or Callahan et al., are indicated by the colored bars below the heat map. Note that G1 of Callahan et al. is within Set B of Ahmed et al., which also overlaps clades 3 and 4, and G2 of Callahan et al. includes Set A of Ahmed et al., which is also subdivided into clades 1 and 2. G3 of Callahan et al. classifies in clade 1 of Ahmed et al. The ancestry of each participant is indicated in the bar above the heat map, where blue indicates non-African and gray indicates African ancestry, and orange indicates a reference strain genome. Note: several samples contained multiple strains of different lineage. The black bar indicates two samples that contained three strains from clades 2, 3 and 4. b-f, L. crispatus, L. jensenii, L. gasseri, L. iners, and Lachnospiracea BVAB1. Analyses similar to that done for G. vaginalis above were performed with samples containing sufficient presence of these taxa (see above, and Methods). The ancestry of each participant is indicated in the bar above the heat map, where blue indicates non-African and gray indicates African ancestry, and white indicates a reference strain genome. Clades are differentiated by pink and light brown bars under each heat map.
Fig. 1 ∣
Fig. 1 ∣. Overview of the VaHMP study and the MOMS-PI Term Birth study.
a, Of the 4,851 women enrolled in the VaHMP study, 613 pregnant and 1,969 non-pregnant women who reported no health complaints were analyzed in this project. A subset of 600 of these women (that is, 300 pregnant and 300 non-pregnant women, case-matched for self-reported race, gestational age at sampling and household income) was selected for analysis. Of these, there were 156 case-matched pairs of women with African ancestry, 61 case-matched pairs of women with European ancestry, and 83 case-matched pairs of women with Hispanic ancestry. These women were sampled at regular visits to VCU women’s health clinics. b, The 90 women (49 of African ancestry, 41 of European ancestry) forming the MOMS-PI Term Birth cohort were selected from a Phase 1 cohort (dark shade, pregnant women, N = 627) of women enrolled from women’s clinics at VCU. These participants were sampled longitudinally throughout pregnancy. 1st, 2nd and 3rd refer to the trimesters of pregnancy; PP, postpartum.
Fig. 2 ∣
Fig. 2 ∣. Pregnant and non-pregnant women of different ancestry exhibit different vaginal microbiome profiles.
a, Microbiome profiles of 613 pregnant and 1,969 non-pregnant women, 1 sample each, of all racial backgrounds taken from the VaHMP data set. Profiles were generated by 16S rRNA taxonomic classification and sorted into vagitypes representing the most dominant taxon present in the profile as previously described,,. The legend is shown for a-e. Blue bars above the charts (a-e) indicate samples with Lactobacillus-dominated vagitypes. b, Microbiome profiles of a subset of 300 pregnant and 300 non-pregnant women from the VaHMP, case-matched for self-identified race, age and socioeconomic status. c, Microbiome profiles of 156 pregnant and 156 non-pregnant women of African ancestry from the VaHMP and case-matched for age and socioeconomic status. d, Microbiome profiles of 61 pregnant and 61 non-pregnant women of European ancestry from the VaHMP and case-matched for age and socioeconomic status. e, Microbiome profiles of 83 pregnant and 83 non-pregnant women of Hispanic ancestry from the VaHMP and case-matched for age and socioeconomic status. f-h, Taxon abundance differences in pregnant and non-pregnant women from b-e. Colored boxes (red and blue) indicate significant (q < 0.05 in two-sided Mann-Whitney U test after correction for false discovery rate (FDR)) differences in the abundance of that taxon between samples in women who are pregnant or not, respectively. Sample sizes for pregnant/non-pregnant cohorts are listed above each plot. Gray boxes indicate differences that are not significant. Boxes show median and interquartille range. The whiskers show the minimum and maximum values. Avag, A. vaginae; BVAB2, BV-associated bacterium 2; Dcl51, Dialister cluster 51; Dmic, Dialister micraerophilus; Gvag, G. vaginalis; Lcricl, L. crispatus cluster; Lini, L. iners; Pbiv, P. bivia; Pcl2, Prevotella cluster 2 (including P. timonensis and P. buccalis); Samn, S. amnii; Ssan, Sneathia sanguinis.
Fig. 3 ∣
Fig. 3 ∣. Vaginal microbiome profiles of women of African ancestry change early in pregnancy.
a, Vaginal microbiome profiles of pregnant women, 49 of African ancestry and 41 of non-African ancestry, collected early (the first sample before 23 weeks of gestation) and late (last sample collected after 32 weeks of gestation) during pregnancy. b, An alluvial diagram showing trajectories of transitions from Lactobacillus-dominated and non-Lactobacillus-dominated profiles of women of non-African and African ancestry across pregnancy. The number of participants in each group is indicated in brackets, with the fraction of participants transitioning indicated on the stratum. c, L1-norm principal component analysis (PCA) of samples from a. An L1-norm PCA (see Methods) is a method for ordination that replaces the traditional sum-of-squared errors criterion with the outlier-insensitive L1 norm. L1-norm PCA methods capture baseline behavior in the presence of outliers when traditional PCA and principal coordinate analysis can be adversely affected. See Supplementary Table 5 for sequence read statistics for data presented in this figure.
Fig. 4 ∣
Fig. 4 ∣. Temporal dynamics of vagitype transitions during pregnancy.
a, Transitions for 41 women of non-African ancestry. b, Transitions for 49 women of African ancestry. Each row represents all of the samples from a single participant, with vagitypes assigned based on 16S rRNA taxonomic profiles, shown as different color circles (see legend for code) across their pregnancies. The median Bray–Curtis dissimilarity within samples collected from the same participant is shown as a heat map to the right of each primary panel. Participants are grouped according to the vagitype of the first sample, and further sorted by decreasing median Bray–Curtis dissimilarities. c, The distribution of median Bray–Curtis dissimilarities between longitudinal samples of each women (90 women; 421 samples), grouped based on the vagitype of the first sample, is shown (see Methods). Box plots were generated in R using standard approaches. The bar represents the median and the boxes indicate interquartile ranges. The whiskers show the minimum and maximum values.
Fig. 5 ∣
Fig. 5 ∣. Metagenomic, metatranscriptomic and pathway analyses of vaginal microbiome samples support metabolic differences among vagitypes of pregnant women of African and non-African ancestry.
Longitudinal samples from 90 women, 49 of African and 41 of non-African ancestry were compared. a, 16S rRNA taxonomic assignments of samples from all three trimesters from women of non-African and African ancestry. b, Taxonomic profiles from metagenomic sequence data of samples from all three trimesters from women of non-African and African ancestry. c, Relative abundances of metabolic pathways estimated using HUMAnN2 from metagenomic sequence data of samples from all three trimesters from women of non-African and African ancestry. d, 16S rRNA taxonomic assignments of samples from the second or early third trimester (one sample per pregnancy) from women of non-African and African ancestry. e, Taxonomic profiles from metagenomic sequence data from samples as in d. f, Taxonomic profiles from metatranscriptomic sequence from samples as in d. g, Relative abundances of 25 highly abundant metabolic pathways estimated using HUMAnN2 from metagenomic sequence data from samples as in d. h, Relative abundances of 25 highly abundant metabolic pathways estimated using HUMAnN2 from metatranscriptomic sequence from samples as in d. See Supplementary Table 6 for mapping statistics for b, e and f. ‘sp’ in the pathways key means ‘superpathway’.

Comment in

References

    1. Ravel J et al. Vaginal microbiome of reproductive-age women. Proc. Natl Acad. Sci. USA 108, 4680–4687 (2011). - PMC - PubMed
    1. Ravel J et al. Daily temporal dynamics of vaginal microbiota before, during and after episodes of bacterial vaginosis. Microbiome 1, 29 (2013). - PMC - PubMed
    1. Younes JA et al. Women and their microbes: the unexpected friendship. Trends Microbiol. 26, 16–32 (2017). - PubMed
    1. Srinivasan S et al. Temporal variability of human vaginal bacteria and relationship with bacterial vaginosis. PloS One 5, e10197 (2010). - PMC - PubMed
    1. Petrova MI, Lievens E, Malik S, Imholz N & Lebeer S Lactobacillus species as biomarkers and agents that can promote various aspects of vaginal health. Front. Physiol 6, 81 (2015). - PMC - PubMed

Publication types

LinkOut - more resources