. 2019 Apr 15;8(7):1570778.
doi: 10.1080/2162402X.2019.1570778. eCollection 2019.

Depleting T regulatory cells by targeting intracellular Foxp3 with a TCR mimic antibody

Affiliations

Depleting T regulatory cells by targeting intracellular Foxp3 with a TCR mimic antibody

Tao Dao et al. Oncoimmunology. .

Abstract

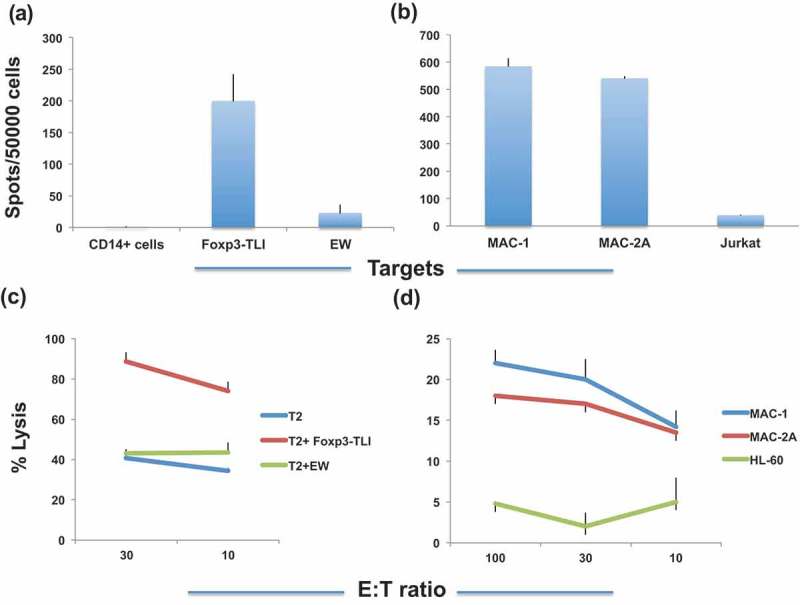
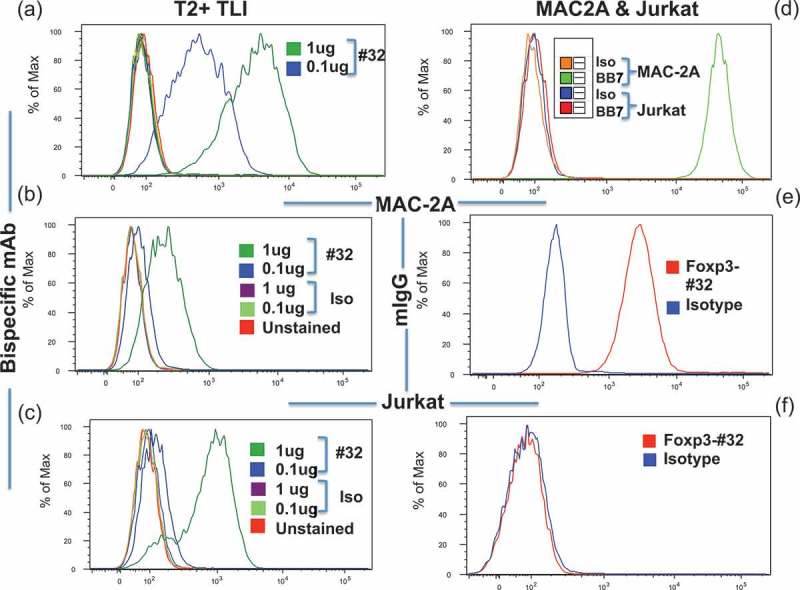
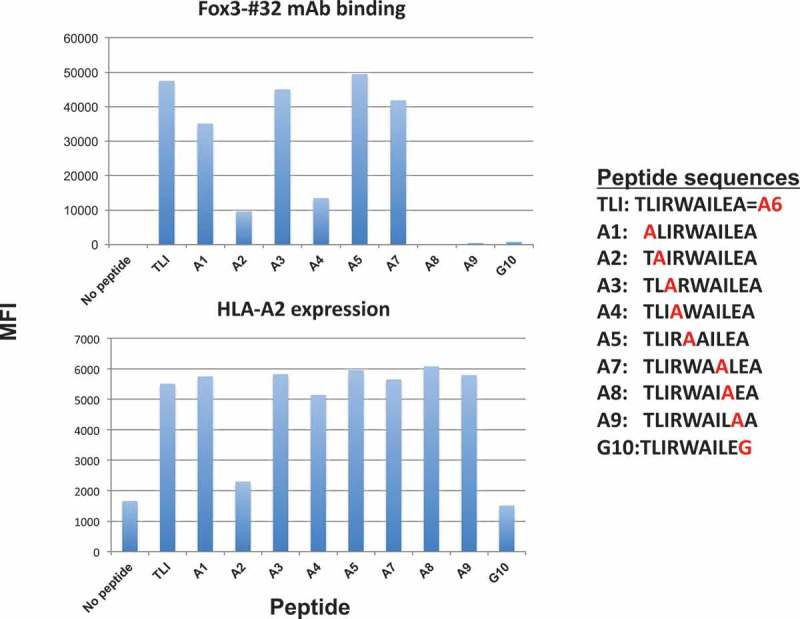
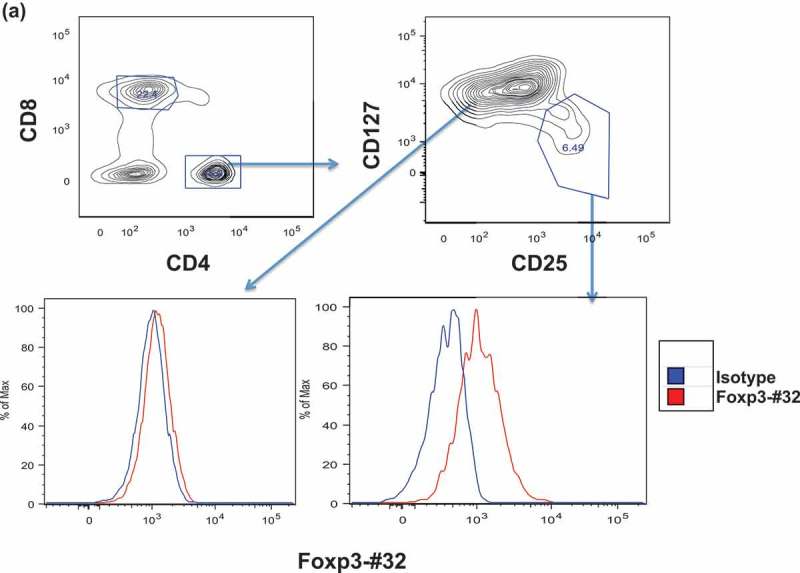
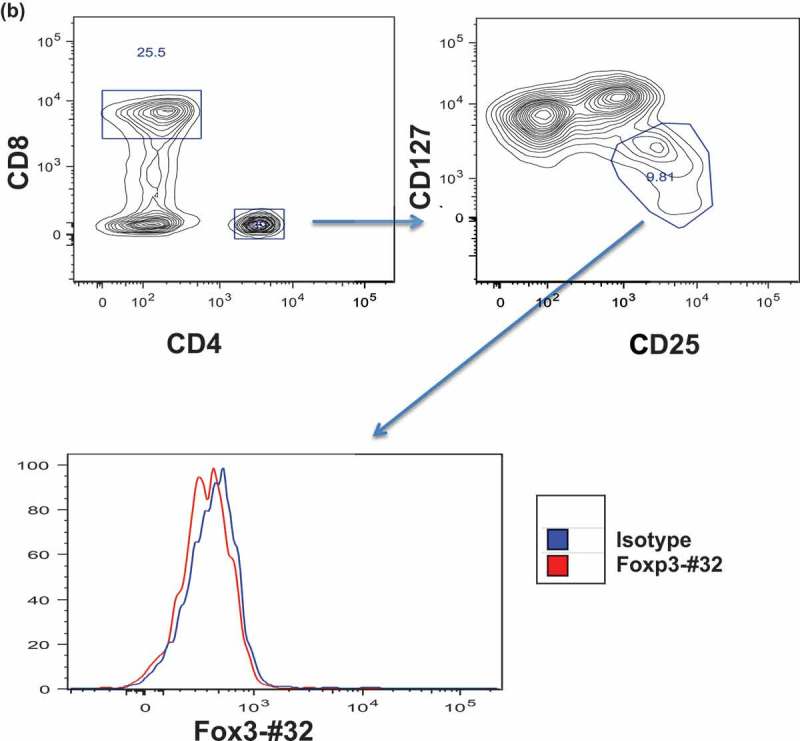
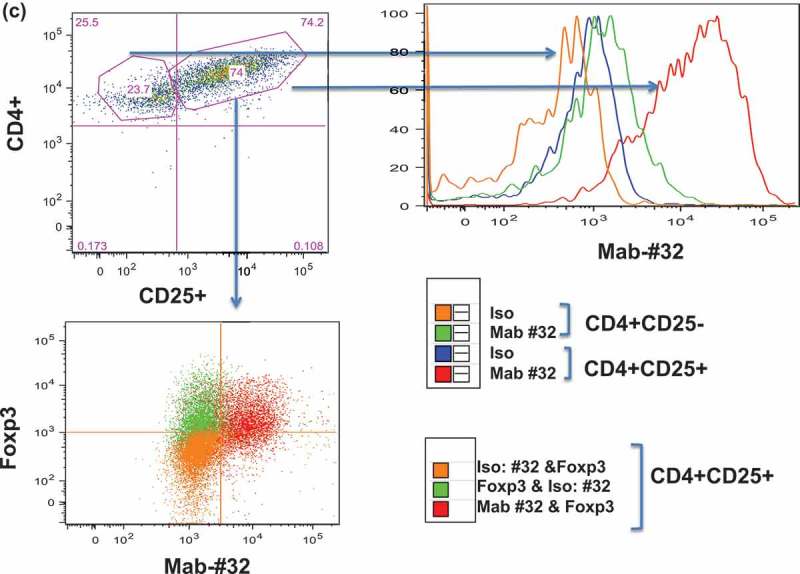
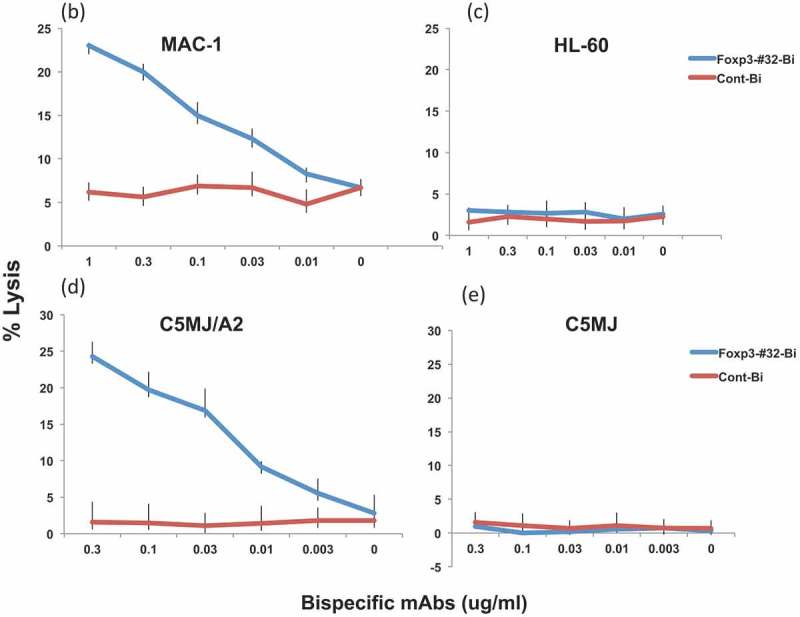
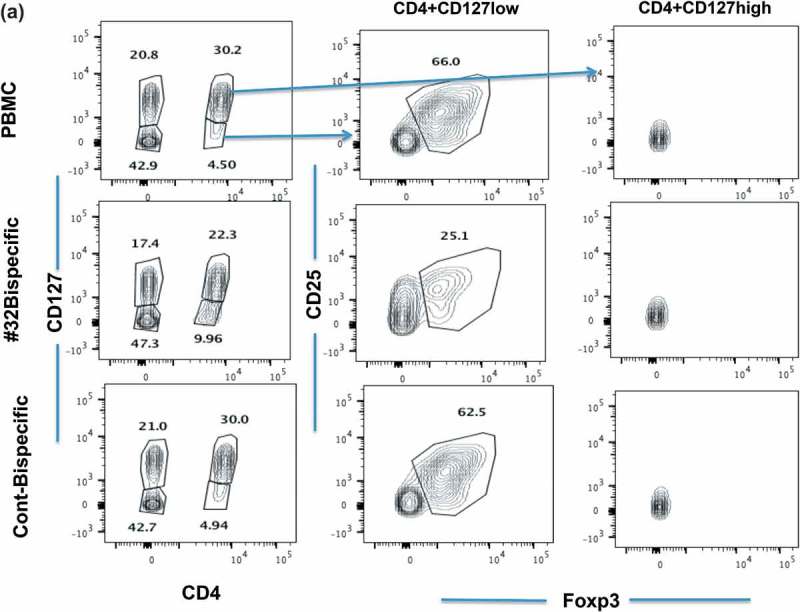
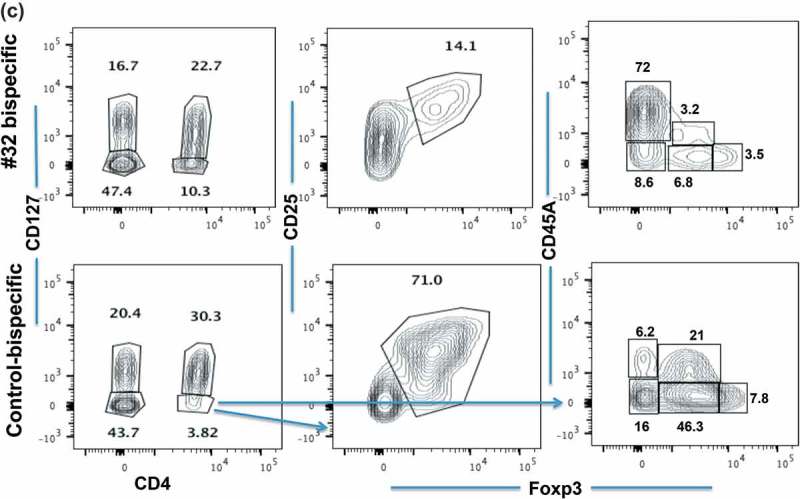
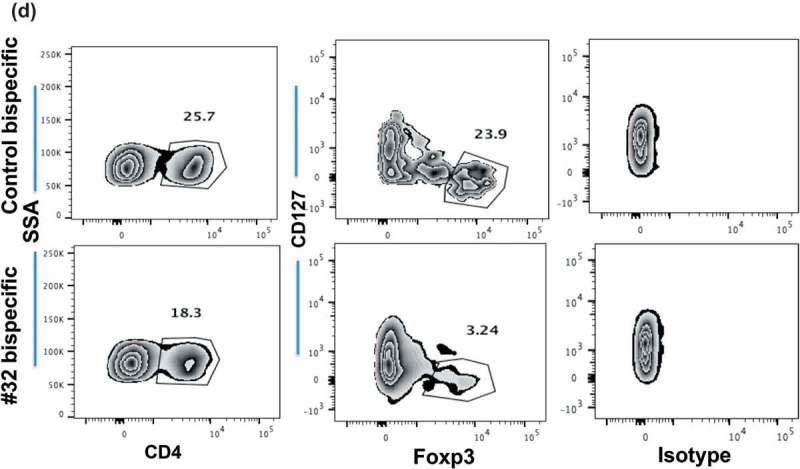
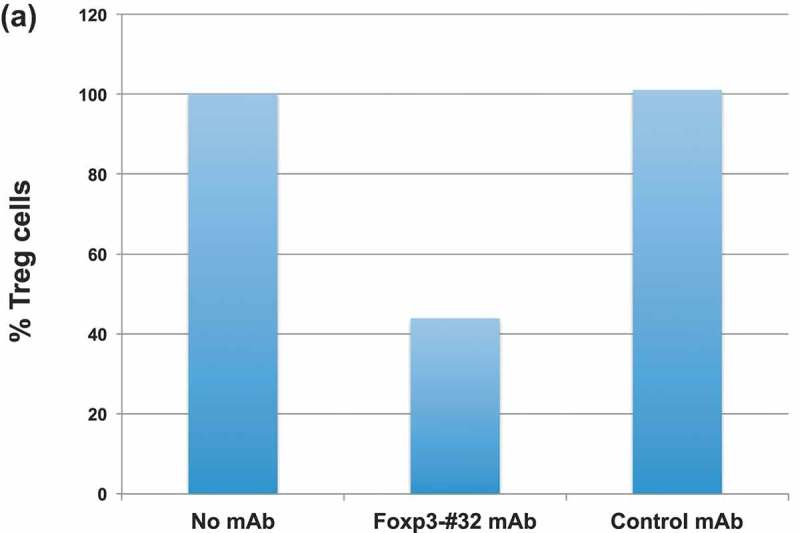
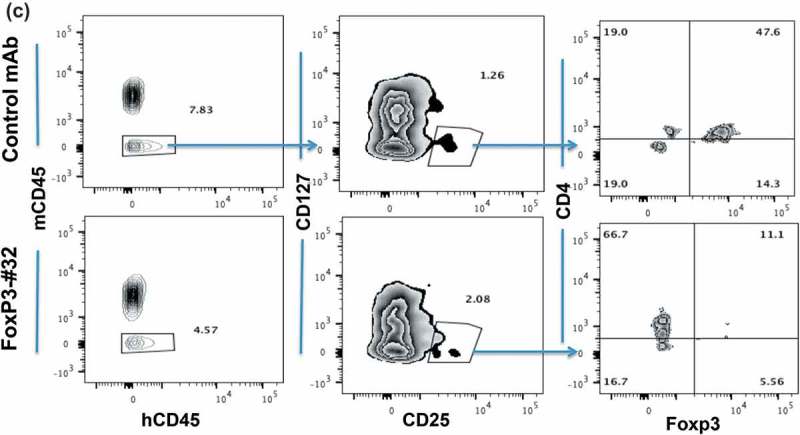
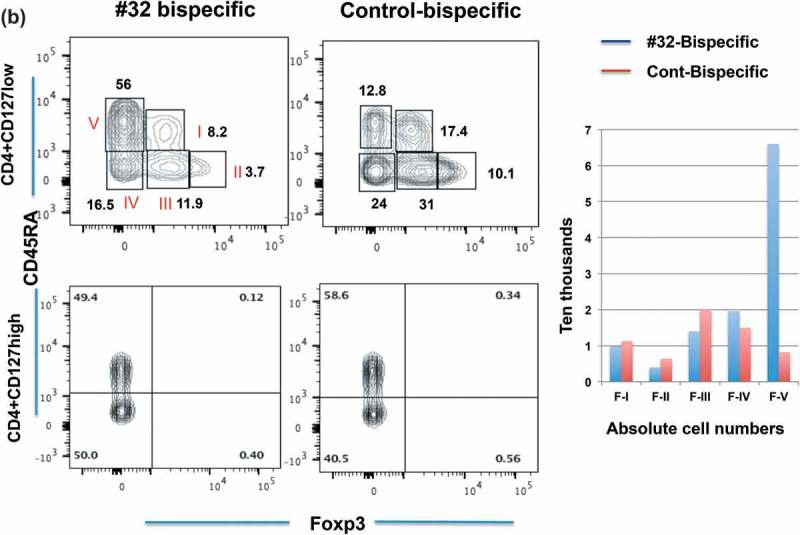
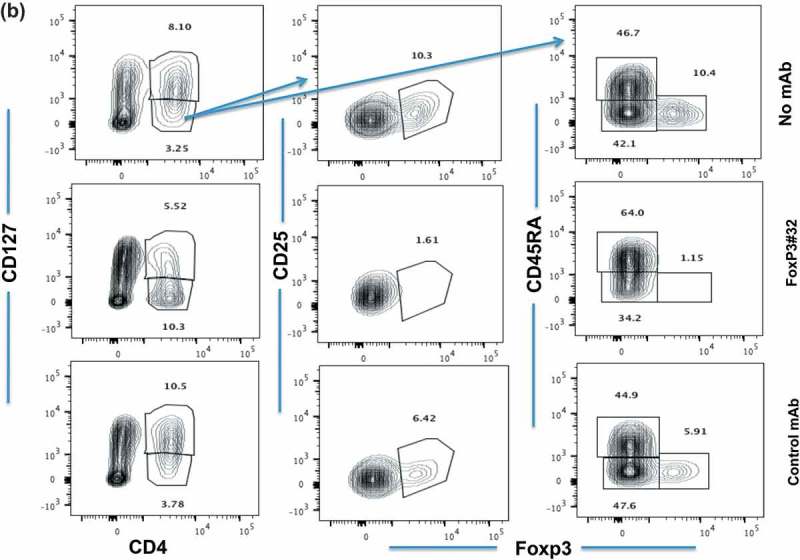
Depletion of T regulatory cells (Tregs) in the tumor microenvironment is a promising cancer immunotherapy strategy. Current approaches for depleting Tregs are limited by lack of specificity and concurrent depletion of anti-tumor effector T cells. The transcription factor forkhead box p3 (Foxp3) plays a central role in the development and function of Tregs and is an ideal target in Tregs, but Foxp3 is an intracellular, undruggable protein to date. We have generated a T cell receptor mimic antibody, "Foxp3-#32," recognizing a Foxp3-derived epitope in the context of HLA-A*02:01. The mAb Foxp3-#32 selectively recognizes CD4 + CD25 + CD127low and Foxp3 + Tregs also expressing HLA-A*02:01 and depletes these cells via antibody-mediated cellular cytotoxicity. Foxp3-#32 mAb depleted Tregs in xenografts of PBMCs from a healthy donor and ascites fluid from a cancer patient. A TCRm mAb targeting intracellular Foxp3 epitope represents an approach to deplete Tregs.

Keywords: Foxp3; Immunosuppression; TCRm mAb; Tregs; immunotherapy.


Figures

Figure 1.
Figure 1.
Foxp3-TLI induces peptide-specific T cell response. (a). CD3 T cells from HLA-A*02:01+ donors were stimulated with Foxp3-TLI peptide for four rounds and T cell response (recorded as spots per added effector cells on the Y-axis) was measured against TLI peptide or with irrelevant peptide EW pulsed on T2 cells by IFN-gamma ELISPOT assay. CD14+ APC’s serve as a negative control. (b). TLI-stimulated T cells also recognize MAC-1 and MAC-2A cells but not HLA-A0*201-cell line Jurkat. Each point represents average ± SD from triplicate cultures. Data represent results from five similar experiments. (c). T cells from an HLA-A*02:01+ donor were stimulated for five rounds, and the cytotoxicity was measured by 51Cr-release (Y-axis) against the TLI or EW control peptides pulsed onto T2 cells. Data show the average plus/minus SD from triplicate wells and one of two similar experiments. (d). Similarly, unpulsed T lymphoma cell lines MAC-1 and MAC-2A (HLA-A*02:01 + Foxp3+) cell line or HLA-A*02:01 negative AML cell line HL-60 were used targets for T cell cytotoxicity. Each point represents average ±SD from three similar experiments from three donors.
Figure 2.
Figure 2.
Binding of the Foxp3-#32 mAb. (a) Binding of T2 cells pulsed with TLI peptide by Fox3-#32 bispecific mAb at the concentration of 0.1ug/ml or 1ug/ml. Other cell controls were included: T2 cells alone, or T2 cells pulsed with irrelevant A2-binding peptide CT. The staining included: Secondary mAb against myc tag (GA6xHis, for the bispecific constructs), or the same concentrations of Foxp3-#32 or control irrelevant bispecific mAb (clone NC-16). All the controls showed no binding above the unstained level (histogram plots overlapped). There was dose-dependent binding of Fox3-#32 bispecific mAb. Foxp3-#32 bispecific mAb was used at 1ug (dark green) or 0.1ug/ml (dark blue). (b) and (c). Fox3-#32 bispecific mAb binding to unpulsed MAC-2A (b) and Jurkat (c), respectively. (d). HLA-A02 expression on MAC-2A (green line) or Jurkat (red line) cells was measured by staining the cells with anti-A2 mAb BB7 and/or its isotype control mouse IgG2b (orange for MAC-2A and blue for Jurkat)), as indicated. (e) and (f). Binding of a full-length mouse IgG1 Fox3-#32 mAb (red line) or its isotype control (blue) to MAC-2A (e) and Jurkat (f), respectively. Mabs were used at 1 ug/ml. Binding strength is shown by log median fluorescent intensity on the X-axis and number of cells on the Y-axis.
Figure 3.
Figure 3.
Epitope specificity. The Foxp3-TLI peptide sequence was substituted with alanine at positions 1, 2, 3, 4, 5, 7, 8, 9 or with glycine (G10) at position 10 as shown in the insert. T2 cells were pulsed with indicated peptides at 50ug/ml, and the binding of a full-length Foxp3-#32 mAb (mouse IgG1) conjugated to APC (3ug/ml) was measured by flow cytometry (upper panel). The same cells were simultaneously stained with anti-HLA-A2 mAb, clone BB7.2, to measure the relative binding of the peptides to HLA-A2 molecule (lower panel).
Figure 4.
Figure 4.
Binding of Foxp3-#32 mAb to Treg cells. Mouse IgG1 version of Foxp3-#32 mAb was used to test the binding, in order to exclude any FcR-mediated binding A-B. Binding of Foxp3-#32 mAb to natural Treg cells in PBMC in healthy donors. PBMCs were stained with mAbs specific for CD4, CD25 CD127, and Foxp3-#32 mouse IgG1. Data show that mAb Foxp3-#32 only bound to CD4+/CD25high/CD127low Tregs, not CD4+/25low/CD127high conventional T cell population (a), nor CD4+/CD25high/CD127low Tegs from an HLA-A0*201 negative donor (b). Data show representative results from three sets of different individuals. C-D. Binding of the Foxp3-#32 mAb to in vitro-generated Treg cells. CD4+ T cells from a HLA-A*02:01+ donor were FACS sorted and stimulated with either MAC-2A cells (c) or allo-PBMC (d) as both stimulator and feeder cells, in the presence of IL-2 (100 unit) and TGF-β (10ng/ml) for three weekly stimulations. Cells were stained with mAbs to surface CD4, CD25, intracellular Foxp3 and mAb Foxp3-#32. MAbs Foxp3-#32 binding was determined by gating on the DAPI-, CD4 and CD25 double positive (upper left panel, upper right quadrant) or CD4 + CD25- (upper left panel, upper left quadrant) cells Dot plot overlay show the Foxp3-#32 plus Foxp3 protein dual staining (lower left panel, red dots), and its isotype control mouse IgG1 and rat isotype control for mAb to Foxp3 (dual controls, orange dots) and mAbs to Foxp3 protein plus isotype control mouse IgG1 for Foxp3-#32 mAb (green dots), in the CD4 + CD25+ population. When the CD4 + CD25+ population was gated, strong binding of mAb Foxp3-#32 (red line) was shown as compared to its isotype control (blue line) (upper right panel) and to the CD4 + CD25 negative population (green line). Similar results were also seen in Tregs generated by allogenic (allo)-PBMC stimulation using a HLA-A*02:01 negative donor (Figure 4(d)). Data represent one of three experiments from three sets of healthy donors.
Figure 4.
Figure 4.
(Continued).
Figure 4.
Figure 4.
(Continued).
Figure 4.
Figure 4.
(Continued).
Figure 5.
Figure 5.
Foxp3-Foxp3-#32-bispecific mAb-mediated T cell cytotoxicity against Foxp3+/HLA-A*02:01+ cells. PBMCs were incubated with: (a) Foxp3-#32 bispecific mAb against T2 pulsed with TLI peptide, green line. Controls included: TLI-pulsed T2 cells alone, blue line; control T2 cells alone, red line; a control bispecific mAb against T2 alone; control bispecific mAb against T2 pulsed with TLI peptide, purple line; Foxp3-#32 bispecific mAb against T2 pulsed with CT control peptide, light blue line; control bispecific mAb against T2 pulsed with control EW peptide, orange line. Data are representative of mean ± SD from triplicate wells and one of three experiments. Bispecific mAb Fosp3-#32 (blue line) or control (red line) was also tested against unpulsed cell lines MAC-1 (b), HL-60 (c), C5MJ/A2+ (d) or C5MJ (e) at the concentrations ranging from 1ug/ml to 0.003 ug/ml. The data represent the mean value ±SD from three experiments. The cytotoxicity was measured by 5 h 51Cr release assay.
Figure 5.
Figure 5.
(Continued).
Figure 6.
Figure 6.
Depletion of natural Treg population by Foxp3-#32. Representative flow cytometry plots of Tregs from healthy donors and patients. (a). The frequency of CD4+/CD127high or CD127low populations from an HLA-A*02:01+ donor after 2 days of culture is shown in the left column. The inserted numbers are the percentages of cells in each gated population shown. CD25+/Foxp3 expression is shown in the middle column on CD4+/CD127 low population. CD25+/Foxp3 expression is shown in the right columns on CD4+/CD127high population. (b). CD4+/CD127 low or high population in Foxp3-#32 or control bispecific mAb-treated group (shown in 6A) were further analyzed based on CD45RA vs Foxp3 expression from the same cells. The percentage of each fraction is indicated as an inserted number, and absolute cell numbers of each fraction were shown in the bar graph. (c). A similar gating strategy was used for the cells after 3 days of culture from the same donor. Data show the CD25+/Foxp3+ cells (middle column) or CD45RA vs Foxp3+ cells (right column) gated from the CD4+/CD127low population (left column). Data represent one of three similar experiments. The percentage of each fraction is indicated as an inserted number. (d). Ascites cells from an HLA-A*02:01+ patient with ovarian cancer treated with Foxp3-#32 bispecific mAb for two days were stained with the Treg markers described in Figure 6(d). Cells were first gated on lymphocytes, excluding large tumor cells and monocyte population, on the side and forward scatter. Then, the CD4+ populations were analyzed with Treg markers: CD127low/Foxp3+. The percentage of each fraction is indicated as an inserted number. Absolute Foxp3+ cell numbers were shown in the bar graph, by calculating total cell numbers times the percentage of lymphocytes, times the percentage of CD4+/CD127 low, within the three Foxp3 fractions (I, II, III) and Foxp3 negative fractions (IV, V; CD45RA+ and negative populations). Data represent one of two similar experiments from the same patient and a total of three patients.
Figure 6.
Figure 6.
(Continued).
Figure 6.
Figure 6.
(Continued).
Figure 7.
Figure 7.
Depletion in vivo of Tregs from human xenografts in NSG mice. Tregs were characterized by markers including CD4+/CD127low/CD25high/Foxp3+ and CD45RA, as described in the in vitro study in Figure 6. (a) Tregs as a percentage of cells (Y-axis) from three HLA-A*02:01 positive donors recovered from mice after PBMC engraftment and treatment with mAbs is normalized to the no mAb untreated cells. Mice engrafted with PBMCs from donors 1 and 3 received 20ug/mouse bispecific mAb Foxp3-#32 or its isotype control. Mice that received PBMCs from donor 2 were injected with 10ug/mouse bispecific Foxp3-mAb #32 or its isotype control. Cells (splenocytes and blood) from three mice per group were pooled and stained with the mAbs to Treg markers and the data represent results from three donors plus/minus SD. P Value for depletion was 0.009 and 0.006 for Foxp3-#32 bispecific mAb vs control bispecific mAb and vs PBMCs alone group, respectively. (b). Mice engrafted with donor 2 were injected with bispecific mAb #32 or its isotype control at 10ug/mouse for consecutive 2 days. The gated CD4+/CD127low population (left column) is next shown as the percentage of CD25 and Foxp3 double positive (middle column) or CD45RA vs Foxp3 cells (right column) to access Treg depletion. All Treg markers were shown after gating on lymphocyte population. (c). NSG mice engrafted with ascites cells from an HLA-A*02:01 positive patient with ovarian cancer were injected ip with 10ug/mouse bispecific mAb #32 or its isotype control. One day after injection, cells were harvested from the peritoneal cavity and stained with human Treg markers as indicated. Human CD45 positive cells (left column) were gated on CD127low/CD25 high population (middle column) and further gated on CD4+/Foxp3+ population to access the depletion of Treg cells (right column). The percentage of each fraction is indicated as an inserted number. Data show a representative plot from one of the three xenografts from three patients (mean+/SD: #32 = 19.5 ± 4.6; control = 51.3 ± 2.9; p value: 0.003).
Figure 7.
Figure 7.
(Continued).
None
None

References

    1. Wolf AM, Wolf D, Steurer M, Gastl G, Gunsilius E, Grubeck-Loebenstein B.. Increase of regulatory T cells in the peripheral blood of cancer patients. Clin Cancer Res. 2003;9:606–612. - PubMed
    1. Liyanage UK, Moore TT, Joo HG, Tanaka Y, Herrmann V, Doherty G, Drebin JA, Strasberg SM, Eberlein TJ, Goedegebuur PS, et al. Prevalence of regulatory T cells is increased in peripheral blood and tumor microenvironment of patients with pancreas or breast adenocarcinoma. J Immunol. 2002;169:2756–2761. - PubMed
    1. Delleuw RJ, Kost SE, Kakal JA, Nelson RH.. The prognostic value of Foxp3+ tumor-infiltrating lymphocytes in cancer: a critical review of the literature. Clin Cancer Res. 2012;18:3022–3029. doi:10.1158/1078-0432.CCR-11-3216. - DOI - PubMed
    1. Curiel TJ, Coukos G, Zou L, Alvarez X, Cheng P, Mottram P, Evdemon-Hogan M, Conejo-Garcia JR, Zhang L, Burow M, et al. Specific recruitment of regulatory T cells in ovarian carcinoma fosters immune privilege and predicts reduced survival. Nat Med. 2004;10:942–949. doi:10.1038/nm1093. - DOI - PubMed
    1. Baumgartner J, Wilson C, Palmer B, Banerjee A, McCarter M. Melanoma induces immunosuppression by up-regulating Foxp3+ regulatory T cells. J Surg Res. 2007;141:72–77. doi:10.1016/j.jss.2007.03.053. - DOI - PMC - PubMed

Publication types