. 2019 Apr 7;8(7):1591875.
doi: 10.1080/2162402X.2019.1591875. eCollection 2019.

Oncolytic virus immunotherapy induces immunogenic cell death and overcomes STING deficiency in melanoma

Affiliations

Oncolytic virus immunotherapy induces immunogenic cell death and overcomes STING deficiency in melanoma

Praveen K Bommareddy et al. Oncoimmunology. .

Abstract

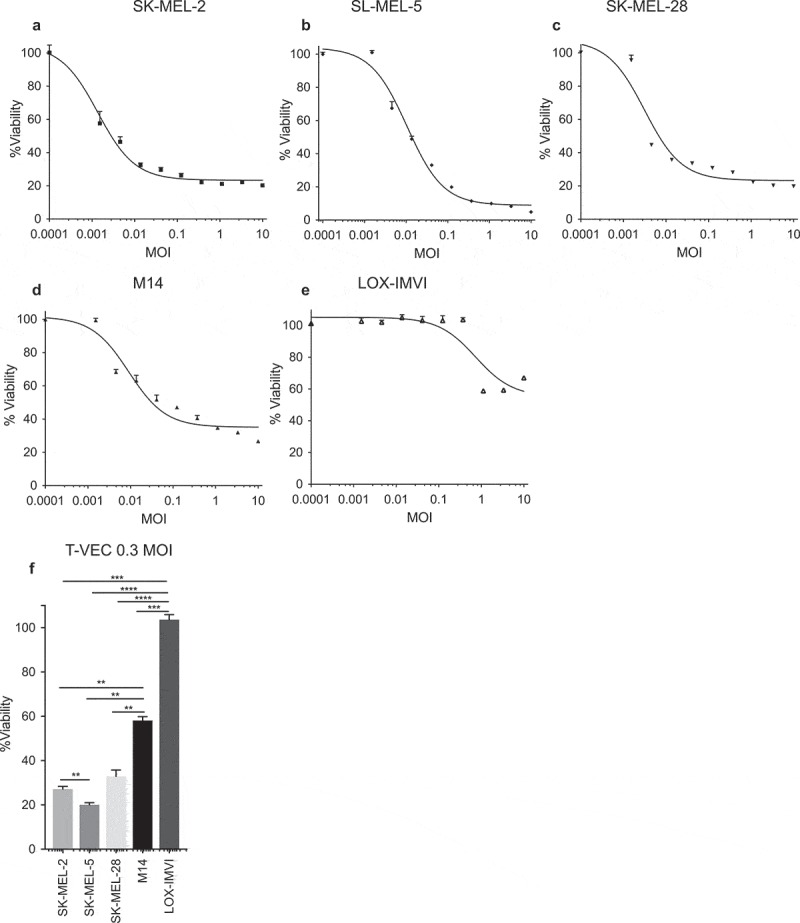
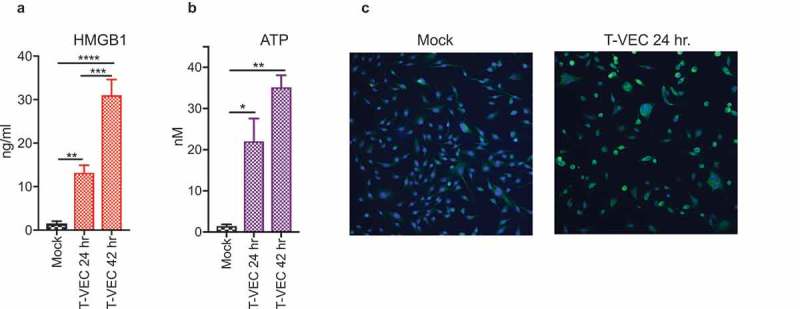
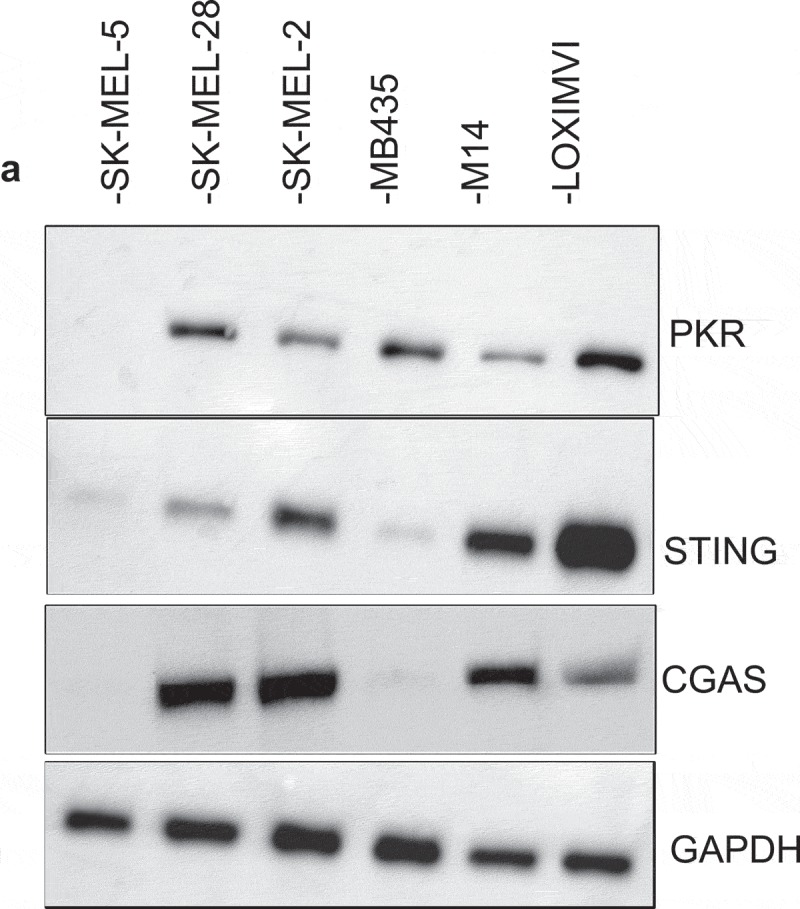
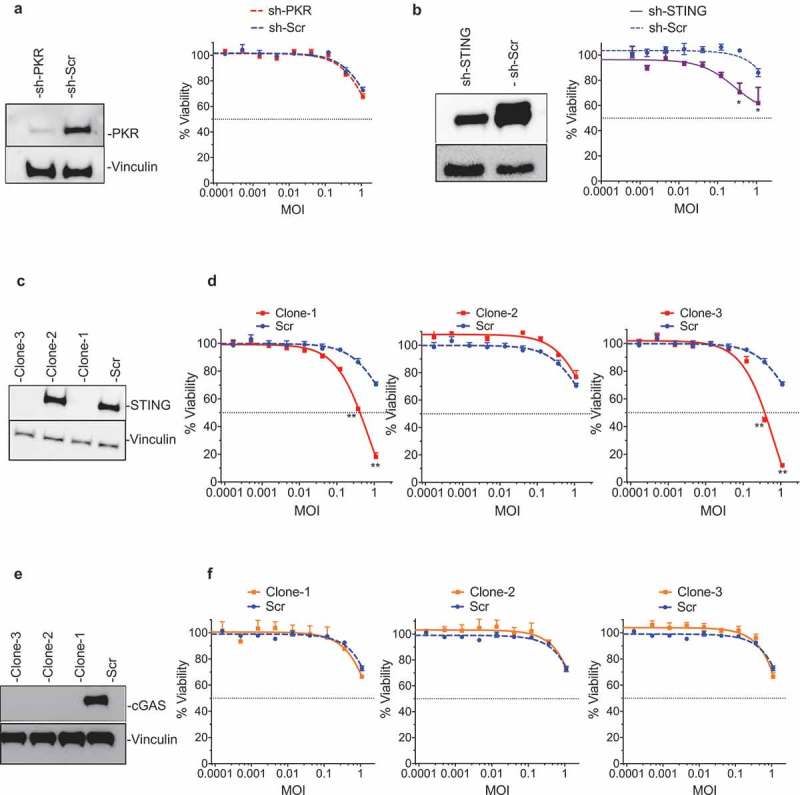
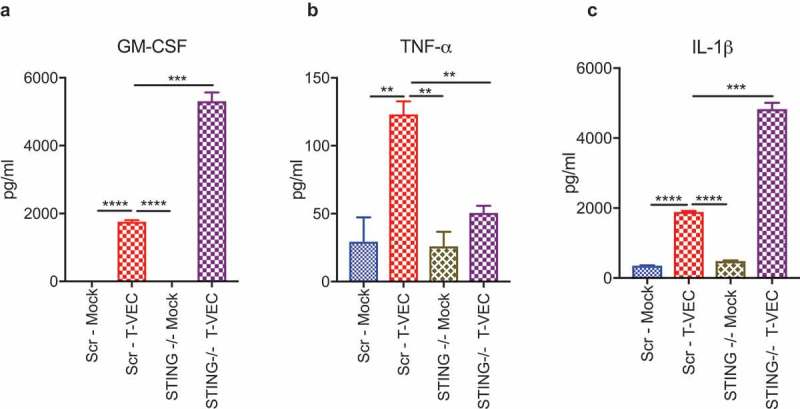
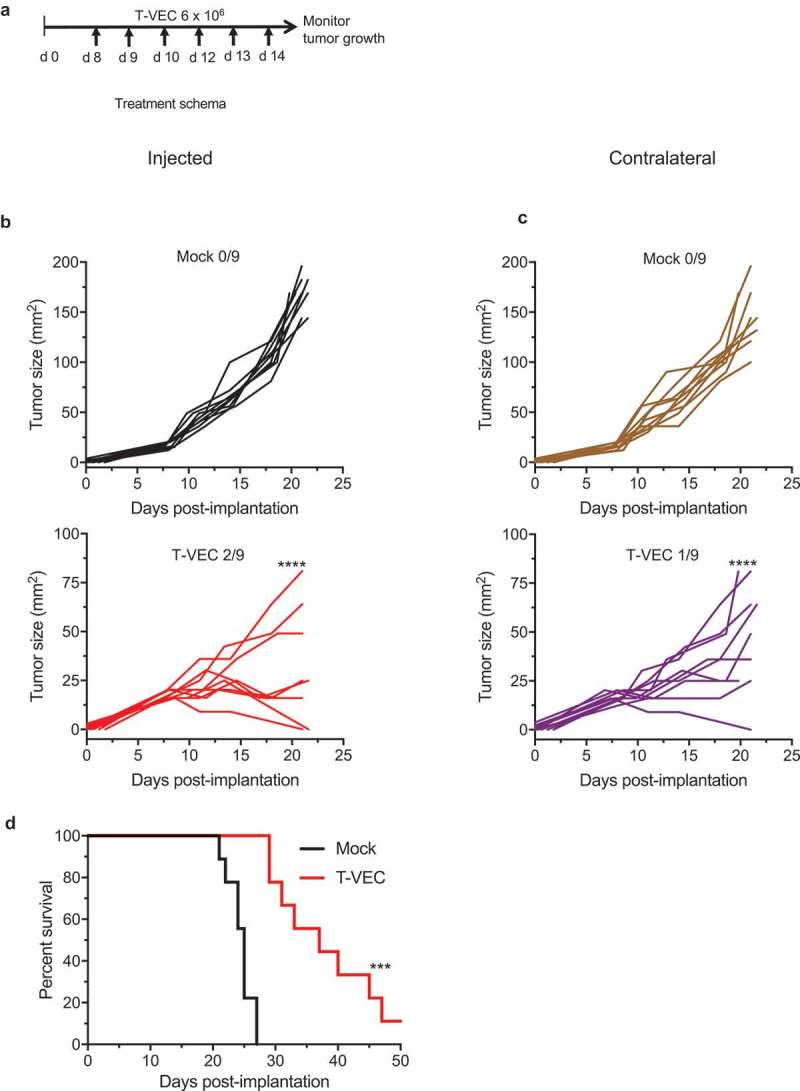
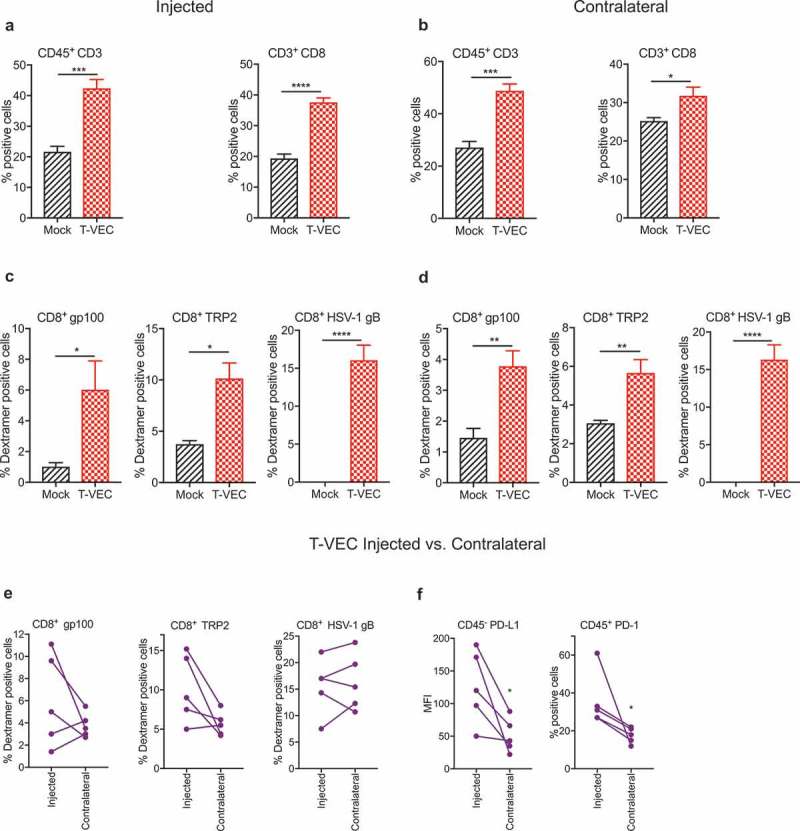
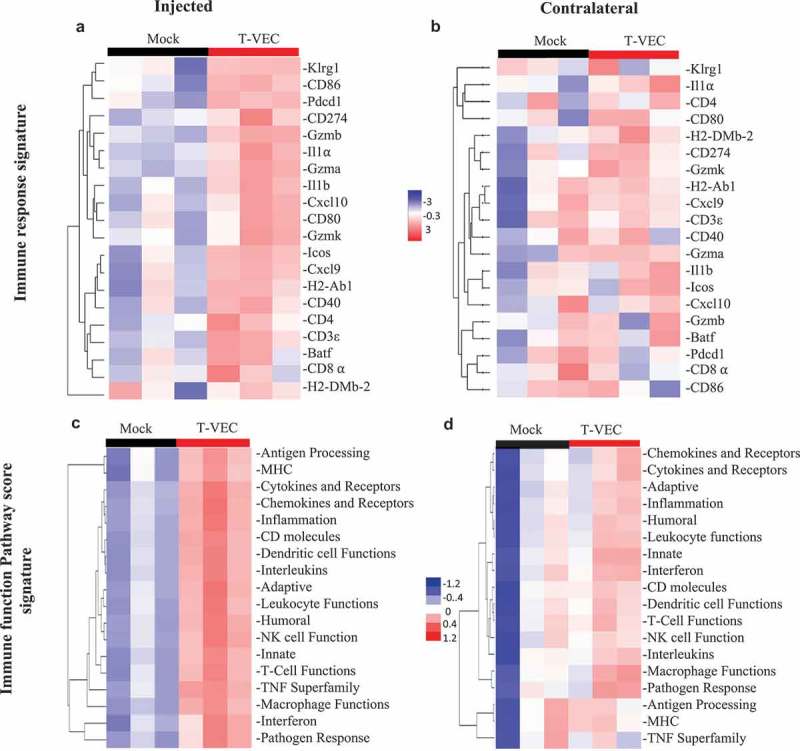
Successful immunotherapy for melanoma depends on the recruitment of effector CD8+ T cells to the tumor microenvironment. Factors contributing to T cell regulation in melanoma have recently been recognized, including the stimulator of interferon genes (STING). Agents that can activate STING or enhance T cell infiltration into established tumors have become an important focus for further clinical development. Talimogene laherparepvec (T-VEC) is an oncolytic herpes simplex virus, type 1 (HSV-1) encoding granulocyte-macrophage colony stimulating factor (GM-CSF) and is approved for the treatment of melanoma and has shown therapeutic activity in murine tumors known to express high levels of STING. The mechanism of action for T-VEC has not been fully elucidated but is thought to include induction of immunogenic cell death (ICD) and activation of host anti-tumor immunity. Thus, we sought to investigate how T-VEC mediates anti-tumor activity in a melanoma model. To determine if T-VEC induced ICD we established the relative sensitivity of a panel of melanoma cell lines to T-VEC oncolysis. Following T-VEC infection in vitro, melanoma cell lines released of HMGB1, ATP, and translocated ecto-calreticulin. To identify potential mediators of this effect, we found that melanoma cell sensitivity to T-VEC was inversely related to STING expression. CRISPR/Cas9-STING knockout was also associated with increased T-VEC cell killing. In the D4M3A melanoma, which has low expression of STING and is resistant to PD-1 blockade therapy, T-VEC was able to induce therapeutic responses in both injected and non-injected tumors and demonstrated recruitment of viral- and tumor-antigen specific CD8+ T cells, and induction of a pro-inflammatory gene signature at both injected and non-injected tumors. These data suggest that T-VEC induces ICD in-vitro and promotes tumor immunity and can induce therapeutic responses in anti-PD-1-refractory, low STING expressing melanoma.

Keywords: Herpes virus; STING; immunogenic cell death; melanoma; oncolytic virus.


Figures

Figure 1.
Figure 1.
Human melanoma cell lines exhibit differential sensitivity to T-VEC-mediated lysis in vitro. Cells (5 × 10³) were seeded on 96-well plates and treated with T-VEC at the indicated multiplicity of infection (MOI) and MTS assay performed on day 5 post T-VEC infection to measure cell viability of (A) SK-MEL-2 (B) SK-MEL-5 (C) SK-MEL-28 (D) M14 and (E) LOX-IMVI at 5 days post T-VEC treatment. (F) Cell viability at 5 days post 0.3 MOI T-VEC treatment for selected cell lines. Each experiment was performed two or more times and similar results were obtained. Data are presented as mean ± SEM, and statistical differences between groups were measured by one way ANOVA. **p < 0.01, ***p < 0.001, ****p < 0.0001.
Figure 2.
Figure 2.
T-VEC induces immunogenic cell death and release of DAMPs. (A–B) SK-MEL-28 cells (5 × 10⁵) were mock infected or treated with 1 MOI T-VEC and cell supernatants collected at 24 and 48 h post infection. (A) Bar graph indicating levels of high mobility group box 1 (HMGB1) in cell supernatants at indicated times. (B) Bar graph indicating the level of adenosine triphosphate (ATP) in cell supernatants at indicated times. (C) SK-MEL-28 cells (1 × 10⁵) were plated in a 6-well chamber slide and treated the next day with phosphate buffer saline (mock; left panel) or 1 MOI of T-VEC (right panel) and stained with anti-calreticulin (CALR) antibody (green) and nuclear stain (DAPI; blue) 24 h post-T-VEC treatment. Each experiment was performed two times with similar results. Data are presented as mean ± SEM, and statistical differences between groups were measured by student’s t-test. *p < 0.05, **p < 0.01, ***p < 0.001, ****p < 0.0001.
Figure 3.
Figure 3.
Melanoma cell lines display variable levels of anti-viral machinery elements. Total cell lysates were collected from the indicated cell lines (2 × 10⁶) and 40 µg of lysate was loaded onto an SDS-PAGE gel and transferred to a PVDF membrane. Antibodies against protein kinase R (PKR), cyclic-GMP-AMP synthase (cGAS) and stimulator of interferon genes (STING) were used in immunoblotting assay as described in Methods. Immunoblots of PKR (A), cGAS and STING. GAPDH is loading control.
Figure 4.
Figure 4.
STING mediates resistance to T-VEC-mediated lysis in melanoma cells. (A) Immunoblot showing PKR protein levels from LOXIMVI-scr and LOXIMVI-shPKR cell lysates (left panel) and cell viability 5 days post-T-VEC treatment (right panel). (B) Immunoblot showing STING protein levels from LOXIMVI-scr and LOXIMVI-shSTING cell lysates (left panel) and cell viability 5 days post-T-VEC treatment (right panel). (C) Immunoblot showing STING protein levels from LOXIMVI-CRISPR-scr and LOXIMVI-CRISPR-STING clones 1, 2 and 3 cell lysates. (D) MTS assay measuring cell viability of LOXIMVI-CRISPR-scr and LOXIMVI-CRISPR-STING clones 1, 2 and 3 cell lines at 5 days post-T-VEC treatment. (E) Immunoblot showing cGAS protein levels from LOXIMVI-CRISPR-scr and LOXIMVI-CRISPR-cGAS clones 1, 2 and 3 cell lysates. Vinculin is loading control. (F) MTS assay measuring cell viability of LOXIMVI-CRISPR-scr and LOXIMVI-CRISPR-cGAS clones 1, 2 and 3 cell lines at 5 days post-T-VEC treatment. Each experiment was performed two times with similar results. Data are presented as mean ± SEM, and statistical differences between groups were measured by student’s t-test. *p < 0.05, **p < 0.01.
Figure 5.
Figure 5.
STING deficiency alters cytokine profiles following T-VEC treatment. LOXIMVI-CRISPR-scr and LOXIMVI-CRISPR-cGAS clone 1 cells (5 × 10⁵) were plated in 6-well plates and infected with 1 MOI of T-VEC or mock. After 20 h, cell supernatants were collected and measured for cytokine release as described in Methods. Bar graphs show the levels of (A) GM-CSF, (B) TNFα and (C) IL-1β. Each experiment was performed twice with similar results. Data are presented as mean ± SEM, and statistical differences between groups were measured by student’s t-test. **p < 0.01, ***p < 0.001, ****p < 0.0001.
Figure 6.
Figure 6.
T-VEC has therapeutic activity in STING^lo melanoma in vivo. (A) Schema of treatment studies in vivo. (B) Individual tumor growth curves of injected tumors of mice treated with mock (top panel; black curves) or T-VEC (bottom panel; red curves). (C) Individual tumor growth curves of contralateral tumors of mock-treated (top panel; brown curves) or T-VEC treated mice (bottom panel; purple curves). Mean tumor area of Mock injected (169.4 mm2) was compared to mean tumor area of Mock un-injected (144 mm2), mean tumor area of T-VEC-injected (15.33 mm2) and mean tumor area of T-VEC-un-injected (47 mm2) at day 21 (D) Kaplan-Meier survival curves from animals. Each experiment was performed twice with similar results. Statistical differences between groups were compared on day 21 by student’s t-test and for survival was performed by Log Rank test. ***p < 0.001, ****p < 0.0001.
Figure 7.
Figure 7.
T-VEC treatment induces host immunity in STING^lo melanoma model. Mice (n = 5/group) were implanted subcutaneously in the right flank with 3 × 10⁵ D4M3A cells on day 0 and treated with 6 × 10⁶ pfu T-VEC or mock injection on days 17, 20, 23, 25 and 27. Tumors were harvested on day 29, and flow cytometry was performed using fluorochrome-conjugated antibodies as described in Methods. (A) Bar graph indicating percentage of CD45+CD3+ T cells and CD3+CD8+ T cells from T-VEC and mock injected tumors and (B) contralateral tumors. (C) Bar graph indicating the percentage of CD8+ T cells specific for murine gp100 or TRP2 and HSV-1 glycoprotein B (HSV-1 gB), respectively, from T-VEC and mock injected tumors and (D) contralateral tumors. (E) Line graphs indicating percentage of CD8+ T cells specific for indicated antigens from either T-VEC injected or contralateral tumors. (F) PD-L1 expression of CD45 cells (left panel) and percentage of CD45+PD-1+ cells (right panel) from T-VEC injected and contralateral tumors. Each experiment was performed two or more times with similar results. Data are presented as mean ± SEM, and statistical differences between groups were measured by student’s t-test. ***p < 0.001, ****p < 0.0001.
Figure 8.
Figure 8.
T-VEC treatment induces a systemic pro-inflammatory gene signature in STING-deficient tumors in vivo. Mice (n = 3/group) were treated as outlined in Figure 8. Tumors were harvested on day 29, and total RNA was isolated and Nanostring analysis performed using the pancancer immune gene profiling kit as described in Methods. (A) Heatmap showing gene expression levels of genes involved in Immune response signature in the injected tumors and (B) contralateral tumors. (C) Heatmap showing Immune function Pathway score signature in the injected tumors and (D) contralateral tumors.

References

    1. Ribas A, Wolchok JD.. Cancer immunotherapy using checkpoint blockade. Science. 2018;359:1350–1355. doi:10.1126/science.aar4060. - DOI - PMC - PubMed
    1. Sharma P, Hu-Lieskovan S, Wargo JA, Ribas A.. Primary, adaptive, and acquired resistance to cancer immunotherapy. Cell. 2017;168:707–723. doi:10.1016/j.cell.2017.01.017. - DOI - PMC - PubMed
    1. Gajewski TF, Louahed J, Brichard VG. Gene signature in melanoma associated with clinical activity: a potential clue to unlock cancer immunotherapy. Cancer J. 2010;16:399–403. doi:10.1097/PPO.0b013e3181eacbd8. - DOI - PubMed
    1. Vilain RE, Menzies AM, Wilmott JS, Kakavand H, Madore J, Guminski A, Liniker E, Kong BY, Cooper AJ, Howle JR, et al. Dynamic changes in PD-L1 expression and immune infiltrates early during treatment predict response to PD-1 blockade in melanoma. Clin Cancer Res. 2017;23:5024–5033. doi:10.1158/1078-0432.CCR-16-0698. - DOI - PubMed
    1. Colli LM, Machiela MJ, Myers TA, Jessop L, Yu K, Chanock SJ. Burden of nonsynonymous mutations among TCGA cancers and candidate immune checkpoint inhibitor responses. Cancer Res. 2016;76:3767–3772. doi:10.1158/0008-5472.CAN-16-0170. - DOI - PMC - PubMed

Publication types