The Effects of Immunosuppressive Factors on Primary Dendritic Cells from C57BL/6 and CBA Mice
- PMID: 31143783
- PMCID: PMC6501430
- DOI: 10.1155/2019/7029726
The Effects of Immunosuppressive Factors on Primary Dendritic Cells from C57BL/6 and CBA Mice
Abstract
Introduction: Dendritic cells (DCs) control immune responses by modulating T and B cells towards effector or tolerogenic responses. In this study, we evaluated the effects of different immunosuppressive molecules on the phenotypic and functional characteristics of primary dendritic cells from C57BL/6 and CBA mice.
Methods: DCs were derived from bone marrow cells in the presence of rmGM-CSF and rmIL-4. DCs were then treated with different types of immunosuppressive molecules (rmIL-10, rmTGF-β, and BAY 11-7082) and cocultured with syngeneic splenocytes. The amount of CD4+CD25hiFoxP3+ Tregs, IL-10 expression, and proliferation were evaluated.
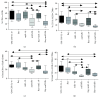
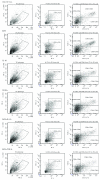
Results: Tolerogenic factors were found to have different effects on DCs C57Bl/6 mice. In C57Bl/6 mice, BAY 11-7082 alone had no effect on the expression of DC maturation molecules (CD80, CD86). Transforming growth factor beta (TGF-β), alone and in combination with BAY 11-7082, reduced the expression of these molecules. Cocultivation of DCs with splenocytes in the presence of TGF-β and BAY 11-7082 favored regulatory T cell (CD4+CD25hiFoxP3+) differentiation and disfavored differentiation of CD4+ T cells producing IL-10. In CBA mice, we found that rmIL-10 and rmTGF-β have a weak effect on maturation of DCs and their functional properties to induce Treg cells and IL-10 production.
Conclusion: These results indicate that TGF-β and IL-10 have different effects on the phenotypic and functional characteristics of DCs and that the NF-κB inhibitor, BAY 11-7082, has no synergistic effect on these treatments. In mice with an opposite nature of the immune response, the effects of immunoregulatory cytokines (IL-10 and TGF-b) differ on maturation of dendritic cells.
Figures


Similar articles
-
Comparison of CD4+CD25hiFoxP3+ Treg Induction by pIL-10-Transfected Dendritic Cells in Different Mouse Strains.J Interferon Cytokine Res. 2019 Sep;39(9):531-538. doi: 10.1089/jir.2019.0031. Epub 2019 May 8. J Interferon Cytokine Res. 2019. PMID: 31070504
-
Cisplatin induces tolerogenic dendritic cells in response to TLR agonists via the abundant production of IL-10, thereby promoting Th2- and Tr1-biased T-cell immunity.Oncotarget. 2016 Jun 7;7(23):33765-82. doi: 10.18632/oncotarget.9260. Oncotarget. 2016. PMID: 27172902 Free PMC article.
-
Regulating the expression of CD80/CD86 on dendritic cells to induce immune tolerance after xeno-islet transplantation.Immunobiology. 2016 Jul;221(7):803-12. doi: 10.1016/j.imbio.2016.02.002. Epub 2016 Feb 3. Immunobiology. 2016. PMID: 26879762
-
DCs and cytokines cooperate for the induction of tregs.Ernst Schering Res Found Workshop. 2006;(56):97-106. doi: 10.1007/3-540-37673-9_6. Ernst Schering Res Found Workshop. 2006. PMID: 16329648 Review.
-
Regulatory Macrophages and Tolerogenic Dendritic Cells in Myeloid Regulatory Cell-Based Therapies.Int J Mol Sci. 2021 Jul 26;22(15):7970. doi: 10.3390/ijms22157970. Int J Mol Sci. 2021. PMID: 34360736 Free PMC article. Review.
Cited by
-
Unique Features of the Immune Response in BTBR Mice.Int J Mol Sci. 2022 Dec 8;23(24):15577. doi: 10.3390/ijms232415577. Int J Mol Sci. 2022. PMID: 36555219 Free PMC article.
-
Roles of type 1 regulatory T (Tr1) cells in allergen-specific immunotherapy.Front Allergy. 2022 Aug 3;3:981126. doi: 10.3389/falgy.2022.981126. eCollection 2022. Front Allergy. 2022. PMID: 35991310 Free PMC article. Review.
-
FLT3 ligand regulates expansion of regulatory T-cells induced by regulatory dendritic cells isolated from gut-associated lymphoid tissues through the Notch pathway.Chin Med J (Engl). 2025 Jul 5;138(13):1595-1606. doi: 10.1097/CM9.0000000000003493. Epub 2025 Apr 11. Chin Med J (Engl). 2025. PMID: 40211734 Free PMC article.
References
-
- Sagoo P., Ali N., Garg G., Nestle F. O., Lechler R. I., Lombardi G. Human regulatory T cells with alloantigen specificity are more potent inhibitors of alloimmune skin graft damage than polyclonal regulatory T cells. Science Translational Medicine. 2011;3(83):p. 83ra42. doi: 10.1126/scitranslmed.3002076. - DOI - PMC - PubMed
-
- Takahashi T., Kuniyasu Y., Toda M., et al. Immunologic self-tolerance maintained by CD25+CD4+ naturally anergic and suppressive T cells: induction of autoimmune disease by breaking their anergic/suppressive state. International Immunology. 1998;10(12):1969–1980. doi: 10.1093/intimm/10.12.1969. - DOI - PubMed
MeSH terms
Substances
LinkOut - more resources
Full Text Sources
Research Materials

