. 2019 Sep;9(7):580-592.
doi: 10.1089/brain.2019.0679. Epub 2019 Jul 1.

Functional Connectivity of Attention, Visual, and Language Networks During Audio, Illustrated, and Animated Stories in Preschool-Age Children

Affiliations

Functional Connectivity of Attention, Visual, and Language Networks During Audio, Illustrated, and Animated Stories in Preschool-Age Children

John S Hutton et al. Brain Connect. 2019 Sep.

Abstract

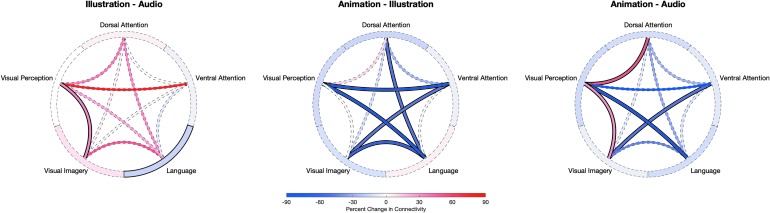
The American Academy of Pediatrics recommends that parents read with their children early and often and limits on screen-based media. While book sharing may benefit attention in children, effects of animated content are controversial, and the influence of either on attention networks has not previously been studied. This study involved functional magnetic resonance imaging (fMRI) of three separate active-task scans composed of similar 5-min stories presented in the same order for each child (audio → illustrated → animated), followed by assessment of comprehension. Five functional brain networks were defined a priori through literature review: dorsal attention network (DAN), ventral attention network (VAN), language (L), visual imagery (VI), and visual perception (VP). Analyses involved comparison of functional connectivity (FC) within- and between networks across formats, applying false discovery rate correction. Twenty-seven of 33 children completed fMRI (82%; 15 boys, 12 girls; mean 58 ± 8 months old). Comprehension of audio and illustrated stories was equivalent and lower for animation (p < 0.05). For illustration relative to audio, FC within DAN and VAN and between each of these and all other networks was similar, lower within-L, and higher between VI-VP, suggesting reduced strain on the language network using illustrations and imagery. For animation relative to illustration, FC was lower between DAN-L, VAN-VP, VAN-VI, L-VI, and L-VP, suggesting less focus on narrative, reorienting to imagery, and visual-language integration. These findings suggest that illustrated storybooks may be optimal at this age to encourage integration of attention, visual, and language networks, while animation may bias attention toward VP.

Keywords: animation; attention networks; child development; functional connectivity; screen time; story format.


Conflict of interest statement

No competing financial interests exist.

Figures

<b>FIG. 1.</b>
FIG. 1.
Comparison of within- and between-network FC changes between story formats. Connectivity wheels show the percent change in FC within and between networks, for audio, illustrated, and animated format. For each wheel, the “tread” represents within-network FC and the “spokes” represent between-network FC, applying FDR correction (p < 0.05). Solid lines reflect statistically significant differences, with red reflecting increased FC and blue reflecting decreased FC. There were significant changes in illustration relative to audio (decreased within-L; increased between VI-VP), animation relative to illustration (decreased between DAN-L, VAN-VI, VAN-VP, L-VI, L-VP), and animation relative to audio (increased between DAN-VP, VI-VP; decreased between L-VP, VAN-VI). DAN, dorsal attention network; FC, functional connectivity; FDR, false discovery rate; L, language; VAN, ventral attention network; VI, visual imagery; VP, visual perception.
<b>FIG. 2.</b>
FIG. 2.
Post hoc analyses investigating ROI-level changes in FC in illustrated format relative to audio. (A) FC within the language network was decreased 17% overall, with a plurality of significantly altered connections (46%) being cross-hemispheric. Changes largely involved inferior frontal regions, especially in the left hemisphere. (B) FC between VI and VP networks was increased 32% overall, with a plurality of significantly altered connections (48%) being cross-hemispheric. Changes largely involved visual and fusiform areas. Post hoc analyses were performed using two-tailed t-tests; red and blue lines designate significantly (p < 0.05, analysis-level FDR corrected) increased and decreased pairwise connections, respectively. Spheres represent ROIs, with red reflecting positive contribution to FC change, blue reflecting negative contribution to FC change, and white reflecting no change; color saturation is proportional to magnitude of effect. ROI, region of interest.
<b>FIG. 3.</b>
FIG. 3.
Post hoc analyses investigating ROI-level changes in FC in animated format relative to illustration. (A) FC between the DAN and L network was decreased 49% overall, with a plurality of significantly altered connections (47%) being cross-hemispheric. Changes were particularly robust involving superior parietal and superior temporal regions. (B) FC between VAN and VI network was decreased 47% overall, with a majority of significantly altered connections (57%) being cross-hemispheric. Changes were robust involving the right TPJ and higher-order visual association areas and precuneus. (C) FC between VAN and VP was decreased 105% overall (positive to negative connectivity strength), a majority of significantly altered connections (50%) being cross-hemispheric. Changes involved right TPJ and ventral prefrontal areas and diffuse visual association and fusiform areas. (D) FC between VI and L networks was decreased 63% overall, with a majority of significantly altered connections (55%) being cross-hemispheric. (E) FC between VP and L networks was decreased 110% overall (positive to negative connectivity strength), a plurality of significantly altered connections (49%) being cross-hemispheric. TPJ, temporal–parietal junction.
<b>FIG. 4.</b>
FIG. 4.
Post hoc analyses investigating ROI-level changes in FC in animated format relative to audio. (A) FC between the DAN and VP network was increased 51% overall, with a majority of significantly altered connections (56%) being cross-hemispheric. Changes largely involved superior parietal and fusiform areas. (B) FC between the L and VP networks was decreased 113% overall (positive to negative connectivity strength), with a plurality of significantly altered connections (49%) being cross-hemispheric. (C) FC between VI and VP networks was increased 29% overall, with a plurality of significantly altered connections (46%) being cross-hemispheric. These changes largely involved visual association, fusiform, and left-lateralized dorsolateral prefrontal areas. (D) FC between VAN and VI network was decreased 48% overall, with a majority of significantly altered connections (64%) being cross-hemispheric. Changes largely involved right TPJ, contralateral visual association areas, and precuneus.

References

    1. AAP Council on Communications and Media. 2016. Media and Young Minds Pediatrics (Vol. 138). Elk Grove, IL: American Academy of Pediatrics
    1. AAP Council on Early Childhood. 2014. Literacy promotion: an essential component of primary care pediatric practice. Pediatrics 134:404–409 - PubMed
    1. Bastos AM, Schoffelen JM. 2015. A tutorial review of functional connectivity analysis methods and their interpretational pitfalls. Front Syst Neurosci 9:175. - PMC - PubMed
    1. Binder JR, Desai RH, Graves WW, Conant LL. 2009. Where is the semantic system? A critical review and meta-analysis of 120 functional neuroimaging studies. Cereb Cortex 19:2767–2796 - PMC - PubMed
    1. Bray S, Arnold AE, Levy RM, Iaria G. 2015. Spatial and temporal functional connectivity changes between resting and attentive states. Hum Brain Mapp 36:549–565 - PMC - PubMed

Publication types

LinkOut - more resources