. 2019 Dec;61(6):702-712.
doi: 10.1165/rcmb.2019-0144OC.

Microbiota Contribute to Obesity-related Increases in the Pulmonary Response to Ozone

Affiliations

Microbiota Contribute to Obesity-related Increases in the Pulmonary Response to Ozone

Hiroki Tashiro et al. Am J Respir Cell Mol Biol. 2019 Dec.

Abstract

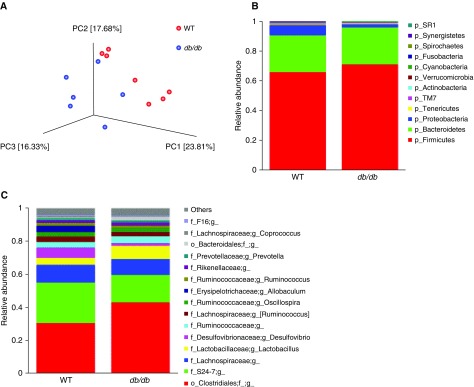
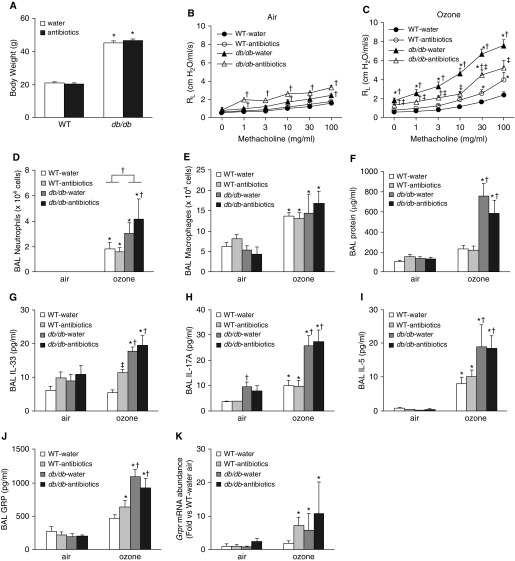
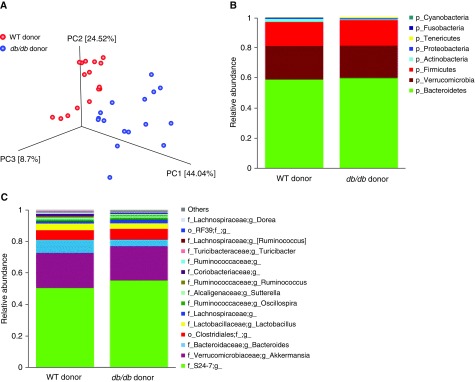
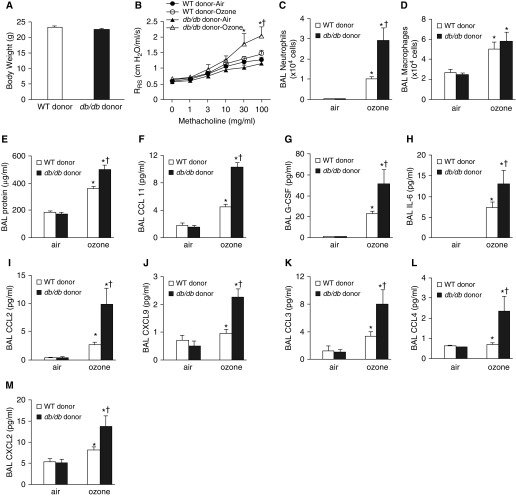
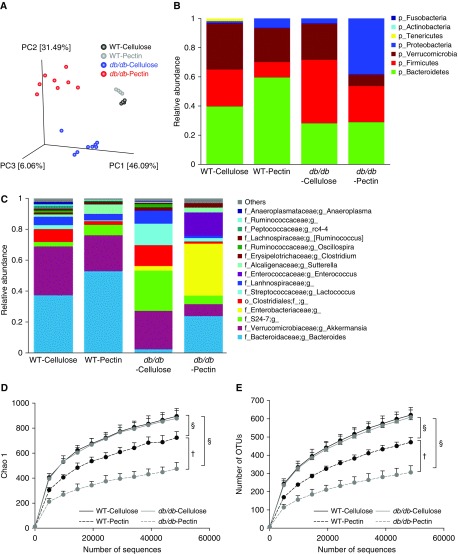
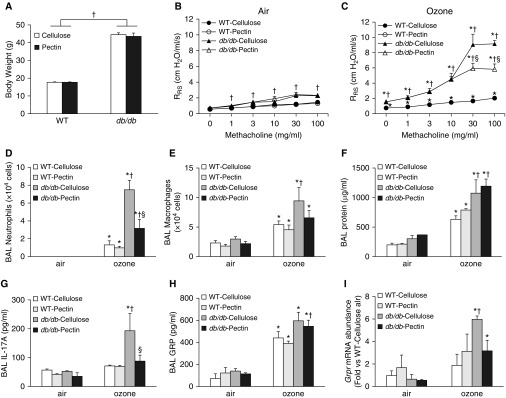
Obesity is a risk factor for asthma, especially nonatopic asthma, and attenuates the efficacy of standard asthma therapeutics. Obesity also augments pulmonary responses to ozone, a nonatopic asthma trigger. The purpose of this study was to determine whether obesity-related alterations in gut microbiota contribute to these augmented responses to ozone. Ozone-induced increases in airway responsiveness, a canonical feature of asthma, were greater in obese db/db mice than in lean wild-type control mice. Depletion of gut microbiota with a cocktail of antibiotics attenuated obesity-related increases in the response to ozone, indicating a role for microbiota. Moreover, ozone-induced airway hyperresponsiveness was greater in germ-free mice that had been reconstituted with colonic contents of db/db than in wild-type mice. In addition, compared with dietary supplementation with the nonfermentable fiber cellulose, dietary supplementation with the fermentable fiber pectin attenuated obesity-related increases in the pulmonary response to ozone, likely by reducing ozone-induced release of IL-17A. Our data indicate a role for microbiota in obesity-related increases in the response to an asthma trigger and suggest that microbiome-based therapies such as prebiotics may provide an alternative therapeutic strategy for obese patients with asthma.

Keywords: airway responsiveness; dietary fiber; gut microbiome; neutrophil; obesity.


Figures

Figure 1.
Figure 1.
Differences in the gut microbiomes of wild-type (WT) and db/db mice assessed by 16S rRNA sequencing of fecal DNA. Fecal pellets were collected before exposure. (A) Principal coordinate (PC) analysis calculated by the Bray-Curtis method. (B) Relative abundance of bacterial phyla. (C) Relative abundance of top 15 genus-level taxa. n = 6–7 mice per group.
Figure 2.
Figure 2.
An antibiotic cocktail attenuates ozone-induced airway hyperresponsiveness in db/db mice. Mice were treated with a cocktail of antibiotics (ampicillin 1 g/L, metronidazole 1 g/L, neomycin 1 g/L, vancomycin 0.5 g/L) via their drinking water for 2 weeks. Sucralose (8 g/L) was added to the water for taste. Control mice were treated with drinking water containing sucralose only. The mice were then exposed to room air or to ozone (2 ppm for 3 h) and evaluated 24 hours later. (A) Body weight. (B) Airway responsiveness of air-exposed mice. (C) Airway responsiveness of ozone-exposed mice. (D) BAL neutrophils. (E) BAL macrophages. (F) BAL protein. (G) BAL IL-33. (H) BAL IL-17A. (I) BAL IL-5. (J) BAL GRP (gastrin-releasing peptide). (K) Pulmonary mRNA expression of Grpr (receptor for gastrin-releasing peptide). Results are mean ± SE of data from six to eight mice per group. *P < 0.05 compared with air-exposed mice of same genotype and treatment, P < 0.05 compared with WT mice of same exposure and treatment, and P < 0.05 compared with water-treated mice of same exposure and genotype. RL = lung resistance.
Figure 3.
Figure 3.
Differences in the gut microbiomes of germ-free (GF) mice reconstituted by gavage with cecal contents from WT or db/db donors as assessed by 16S rRNA sequencing of fecal DNA from the recipient mice. Fecal pellets were harvested 12 days after gavage but before exposure. (A) PC analysis calculated by the Bray-Curtis method. (B) Relative abundance of bacterial phyla. (C) Relative abundance of top 15 genus-level taxa. n = 16 mice per group.
Figure 4.
Figure 4.
An obese gut microbiome augments pulmonary responses to ozone. GF mice were gavaged with cecal contents from either WT or db/db mice, exposed to room air or ozone (2 ppm for 3 h) 12 days after gavage, and evaluated 24 hours after exposure. (A) Body weight. (B) Airway responsiveness. (C) BAL neutrophils. (D) BAL macrophages. (E) BAL protein. (FM) BAL concentrations of CCL11 (F), granulocyte colony-stimulating factor (G-CSF) (G), IL-6 (H), CCL2 (I), CXCL9 (J), CCL3 (K), CCL4 (L), and CXCL2 (M). Results are mean ± SE of data from eight mice per group. *P < 0.05 compared with air-exposed mice with same donor genotype, and P < 0.05 compared with mice that received transplanted feces from WT mice. RRS = respiratory system resistance.
Figure 5.
Figure 5.
Differences in the gut microbiomes of WT and db/db mice fed cellulose-enriched or pectin-enriched diets for 3 days as assessed by 16S rRNA sequencing of fecal DNA. (A) PC analysis calculated by the Bray-Curtis method. (B) Relative abundance of bacterial phyla. (C) Relative abundance of top 15 genus-level taxa. (D) Rarefaction curves of diversity on Chao 1 index. (E) Rarefaction curve of richness. Results for D and E are mean ± SE of data from eight mice per group. P < 0.05 compared with WT mice fed the same diet, and §P < 0.05 compared with cellulose-fed mice of the same genotype. OTUs = operational taxonomic units.
Figure 6.
Figure 6.
A pectin-enriched diet attenuates pulmonary responses to ozone in db/db but not WT mice. WT and db/db mice were fed either cellulose-enriched or pectin-enriched diets for 3 days. The mice were then exposed to room air or to ozone. (A) Body weight. (B) Airway responsiveness of mice exposed to room air. (C) Airway responsiveness of mice exposed to ozone. (D) BAL neutrophils. (E) BAL macrophages. (F) BAL protein. Also shown are (G) BAL concentrations of IL-17A, (H) GRP, and (I) Grpr mRNA abundance in lung. Results are mean ± SE of data from four (air) to six (ozone) mice per group. *P < 0.05 compared with air-exposed mice of the same diet and genotype, P < 0.05 compared with WT mice of same diet and exposure, and §P < 0.05 compared with ozone-exposed cellulose-fed db/db mice.

Comment in

References

    1. Beuther DA, Sutherland ER. Overweight, obesity, and incident asthma: a meta-analysis of prospective epidemiologic studies. Am J Respir Crit Care Med. 2007;175:661–666. - PMC - PubMed
    1. Schatz M, Hsu JW, Zeiger RS, Chen W, Dorenbaum A, Chipps BE, et al. Phenotypes determined by cluster analysis in severe or difficult-to-treat asthma. J Allergy Clin Immunol. 2014;133:1549–1556. - PubMed
    1. Dixon AE, Pratley RE, Forgione PM, Kaminsky DA, Whittaker-Leclair LA, Griffes LA, et al. Effects of obesity and bariatric surgery on airway hyperresponsiveness, asthma control, and inflammation. J Allergy Clin Immunol. 2011;128:508–515, e1-e2. - PMC - PubMed
    1. Sutherland ER, Goleva E, Strand M, Beuther DA, Leung DY. Body mass and glucocorticoid response in asthma. Am J Respir Crit Care Med. 2008;178:682–687. - PMC - PubMed
    1. Foster WM, Brown RH, Macri K, Mitchell CS. Bronchial reactivity of healthy subjects: 18-20 h postexposure to ozone. J Appl Physiol (1985) 2000;89:1804–1810. - PubMed

Publication types

MeSH terms