. 2019 Dec 1;111(12):1279-1297.
doi: 10.1093/jnci/djz106.

Annual Report to the Nation on the Status of Cancer, Featuring Cancer in Men and Women Age 20-49 Years

Annual Report to the Nation on the Status of Cancer, Featuring Cancer in Men and Women Age 20-49 Years

Elizabeth M Ward et al. J Natl Cancer Inst. .

Abstract

Background: The American Cancer Society, Centers for Disease Control and Prevention, National Cancer Institute, and North American Association of Central Cancer Registries provide annual updates on cancer occurrence and trends by cancer type, sex, race, ethnicity, and age in the United States. This year's report highlights the cancer burden among men and women age 20-49 years.

Methods: Incidence data for the years 1999 to 2015 from the Centers for Disease Control and Prevention- and National Cancer Institute-funded population-based cancer registry programs compiled by the North American Association of Central Cancer Registries and death data for the years 1999 to 2016 from the National Vital Statistics System were used. Trends in age-standardized incidence and death rates, estimated by joinpoint, were expressed as average annual percent change.

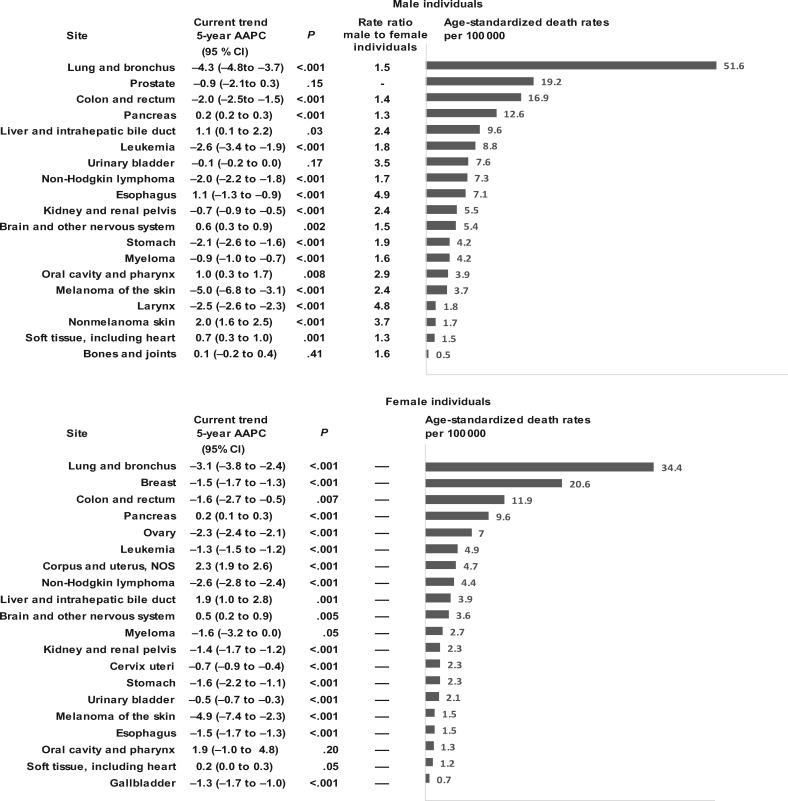
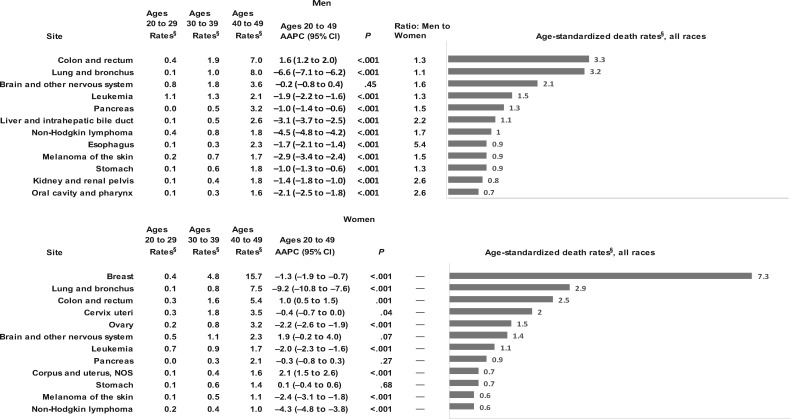
Results: Overall cancer incidence rates (per 100 000) for all ages during 2011-2015 were 494.3 among male patients and 420.5 among female patients; during the same time period, incidence rates decreased 2.1% (95% confidence interval [CI] = -2.6% to -1.6%) per year in men and were stable in females. Overall cancer death rates (per 100 000) for all ages during 2012-2016 were 193.1 among male patients and 137.7 among female patients. During 2012-2016, overall cancer death rates for all ages decreased 1.8% (95% CI = -1.8% to -1.8%) per year in male patients and 1.4% (95% CI = -1.4% to -1.4%) per year in females. Important changes in trends were stabilization of thyroid cancer incidence rates in women and rapid declines in death rates for melanoma of the skin (both sexes). Among adults age 20-49 years, overall cancer incidence rates were substantially lower among men (115.3 per 100 000) than among women (203.3 per 100 000); cancers with the highest incidence rates (per 100 000) among men were colon and rectum (13.1), testis (10.7), and melanoma of the skin (9.8), and among women were breast (73.2), thyroid (28.4), and melanoma of the skin (14.1). During 2011 to 2015, the incidence of all invasive cancers combined among adults age 20-49 years decreased -0.7% (95% CI = -1.0% to -0.4%) among men and increased among women (1.3%, 95% CI = 0.7% to 1.9%). The death rate for (per 100 000) adults age 20-49 years for all cancer sites combined during 2012 to 2016 was 22.8 among men and 27.1 among women; during the same time period, death rates decreased 2.3% (95% CI = -2.4% to -2.2%) per year among men and 1.7% (95% CI = -1.8% to -1.6%) per year among women.

Conclusions: Among people of all ages and ages 20-49 years, favorable as well as unfavorable trends in site-specific cancer incidence were observed, whereas trends in death rates were generally favorable. Characterizing the cancer burden may inform research and cancer-control efforts.


Figures

Figure 1.
Figure 1.
Trends in age-standardized incidence (1999‒2015) and mortality rates (1999‒2016), all cancer sites combined, all races and ethnicities combined, by sex. Rates were age-standardized to the 2000 US standard population (19 age groups, Census P25–1130). Scattered points were observed rates; lines were fitted rates according to joinpoint regression. Incidence rates were delay-adjusted and covered 88.6% of the US population, and mortality covered the entire United States. Registries included for incidence: Alabama, Alaska, Arizona, California, Colorado, Connecticut, Delaware, Florida, Georgia, Hawaii, Idaho, Illinois, Indiana, Iowa, Kentucky, Louisiana, Maine, Maryland, Massachusetts, Michigan, Missouri, Montana, Nebraska, New Hampshire, New Jersey, New York, North Carolina, North Dakota, Ohio, Oklahoma, Oregon, Pennsylvania, Rhode Island, South Carolina, Texas, Utah, Vermont, Washington, West Virginia, Wisconsin, and Wyoming. AAPC is a weighted average of the APCs over the fixed interval (2011–2015 for incidence; 2012–2016 for mortality) using the underlying joinpoint model for the period 1999–2015 for incidence and the period 1999–2016 for mortality. Joinpoint models with up to three joinpoints for incidence and mortality are based on rates per 100 000 persons, age-standardized to the 2000 US standard population (19 age groups, Census P25–1130). For joinpoint analyses, the Joinpoint Regression Program was used (version 4.6.0.0), Bethesda, MD: Statistical Research and Applications Branch, National Cancer Institute; April 2018. AAPC = average annual percent change; APC = annual percent change; CI = confidence interval.
Figure 2.
Figure 2.
Age-standardized, delay-adjusted incidence rates and recent trends (2011–2015) for the 17 most common cancers in male individuals and the 18 most common cancers in female individuals, all races and ethnicities combined, by sex. Rates were age-standardized to the 2000 US standard population (19 age groups, Census P25–1130) and were delay-adjusted and covered 89% of the US population. Registries included in the joinpoint trend analyses: Alabama, Alaska, Arizona, California, Colorado, Connecticut, Delaware, Florida, Georgia, Hawaii, Idaho, Illinois, Indiana, Iowa, Kentucky, Louisiana, Maine, Maryland, Massachusetts, Michigan, Missouri, Montana, Nebraska, New Hampshire, New Jersey, New York, North Carolina, North Dakota, Ohio, Oklahoma, Oregon, Pennsylvania, Rhode Island, South Carolina, Texas, Utah, Vermont, Washington, West Virginia, Wisconsin, and Wyoming. Registries included in rates and recent trends (2011–2015): Alabama, Alaska, Arizona, Arkansas, California, Colorado, Connecticut, Delaware, Florida, Georgia, Hawaii, Idaho, Illinois, Indiana, Iowa, Kentucky, Louisiana, Maine, Maryland, Massachusetts, Michigan, Minnesota, Mississippi, Missouri, Montana, Nebraska, New Hampshire, New Jersey, New York, North Carolina, North Dakota, Ohio, Oklahoma, Oregon, Pennsylvania, Rhode Island, South Carolina, South Dakota, Tennessee, Texas, Utah, Vermont, Virginia, Washington, West Virginia, Wisconsin, Wyoming, and Puerto Rico. AAPC is a weighted average of the annual percent change (APCs) over the fixed interval (2011–2015) using the underlying joinpoint model for the period 1999–2015. Joinpoint models with up to three joinpoints are based on rates per 100 000 persons, age-standardized to the 2000 US standard population (19 age groups, Census P25–1130). For joinpoint analyses, the Joinpoint Regression Program was used (version 4.6.0.0), Bethesda, MD: Statistical Research and Applications Branch, National Cancer Institute; April 2018. AAPC = average annual percent change; CI = confidence interval; NOS = not otherwise specified.
Figure 3.
Figure 3.
Age-standardized death rates and recent fixed interval trends (2012–2016) for the 19 most common cancers in male individuals and the 20 most common cancers in female individuals, all races and ethnicities combined, by sex. Five-year AAPC is based on joinpoint trend, 1999–2016. AAPC = average annual percent change; CI = confidence interval; NOS = not otherwise specified. Rates were age-standardized to the 2000 US standard population (19 age groups, Census P25–1130). AAPC is a weighted average of the annual percent change over the fixed interval (2012–2016) using the underlying joinpoint model for the period 1999–2016. Joinpoint models with up to three joinpoints are based on rates per 100 000 persons, age-standardized to the 2000 US standard population (19 age groups, Census P25–1130). For joinpoint analyses, the Joinpoint Regression Program was used (version 4.6.0.0), Bethesda, MD: Statistical Research and Applications Branch, National Cancer Institute; April 2018.
Figure 4.
Figure 4.
Trends in age-standardized incidence (1999‒2015) and mortality rates (1999‒2016), all cancer sites combined, all races and ethnicities combined, by sex, ages 20–49 years. Rates were age-standardized to the 2000 US standard population (19 age groups, Census P25–1130). Scattered points were observed rates; lines were fitted rates according to joinpoint regression. Incidence rates were delay-adjusted and covered 88.6% of the US population, and mortality covered the entire United States. Registries included for incidence: Alabama, Alaska, Arizona, California, Colorado, Connecticut, Delaware, Florida, Georgia, Hawaii, Idaho, Illinois, Indiana, Iowa, Kentucky, Louisiana, Maine, Maryland, Massachusetts, Michigan, Missouri, Montana, Nebraska, New Hampshire, New Jersey, New York, North Carolina, North Dakota, Ohio, Oklahoma, Oregon, Pennsylvania, Rhode Island, South Carolina, Texas, Utah, Vermont, Washington, West Virginia, Wisconsin, and Wyoming. AAPC is a weighted average of APCs over the fixed interval (2011–2015 for incidence; 2012–2016 for mortality) using the underlying joinpoint model for the period 1999–2015 for incidence and the period 1999–2016 for mortality. Joinpoint models with up to three joinpoints for incidence and mortality are based on rates per 100 000 persons, age-standardized to the 2000 US standard population (19 age groups, Census P25–1130). For joinpoint analyses, the Joinpoint Regression Program was used (version 4.6.0.0), Bethesda, MD: Statistical Research and Applications Branch, National Cancer Institute; April 2018. AAPC = average annual percent change; APC = annual percent change; CI = confidence interval.
Figure 5.
Figure 5.
Age-standardized, delay-adjusted incidence rates, and fixed-interval trends (2011–2015) for most common cancers, ages 20–49 years by sex, for areas in the United States with high-quality incidence data. AAPC = 5-year average annual percent change; CI = confidence interval; CNS = central nervous system; NOS = not otherwise specified; ONS = other nervous system. §Rates are per 100 000 persons and were age-standardized to the 2000 US standard population (19 age groups, Census P25–1130) and delay-adjusted. ¥Counts in parentheses after the bars are the delay-adjusted counts observed in the 48 registries with high-quality data for 2015. AAPC is a weighted average of the APCs over the fixed interval 2011–2015 using the underlying joinpoint model for the period 1999–2015, except for breast (in situ), which used the period 2001–2015, and nonmalignant brain, which used the period 2008–2015. The maximum number of joinpoints was based on the length of the time period: three for the period 1999–2015, two for the period 2001–2015 (in situ breast cancer), and one for the period 2008–2015 (nonmalignant CNS tumors). For joinpoint analyses, the Joinpoint Regression Program was used (version 4.6.0.0), Bethesda, MD: Statistical Research and Applications Branch, National Cancer Institute; April 2018. Registries included in the joinpoint models (1999–2015) for invasive cancers (41 states): Alabama, Alaska, Arizona, California, Colorado, Connecticut, Delaware, Florida, Georgia, Hawaii, Idaho, Illinois, Indiana, Iowa, Kentucky, Louisiana, Maine, Maryland, Massachusetts, Michigan, Missouri, Montana, Nebraska, New Hampshire, New Jersey, New York, North Carolina, North Dakota, Ohio, Oklahoma, Oregon, Pennsylvania, Rhode Island, South Carolina, Texas, Utah, Vermont, Washington, West Virginia, Wisconsin, and Wyoming. Registries included in rates for invasive cancers (2011–2015) (47 states and 1 territory): Alabama, Alaska, Arizona, Arkansas, California, Colorado, Connecticut, Delaware, Florida, Georgia, Hawaii, Idaho, Illinois, Indiana, Iowa, Kentucky, Louisiana, Maine, Maryland, Massachusetts, Michigan, Minnesota, Mississippi, Missouri, Montana, Nebraska, New Hampshire, New Jersey, New York, North Carolina, North Dakota, Ohio, Oklahoma, Oregon, Pennsylvania, Rhode Island, South Carolina, South Dakota, Tennessee, Texas, Utah, Vermont, Virginia, Washington, West Virginia, Wisconsin, Wyoming, and Puerto Rico. Registries included in the joinpoint models (2001–2015) for breast in situ (43 states covering 87.6% of the population of the United States and Puerto Rico): Alabama, Alaska, Arizona, Arkansas, California, Colorado, Connecticut, Delaware, Florida, Georgia, Hawaii, Idaho, Illinois, Indiana, Iowa, Kentucky, Louisiana, Maine, Maryland, Massachusetts, Michigan, Missouri, Montana, Nebraska, New Hampshire, New Jersey, New York, North Carolina, North Dakota, Ohio, Oklahoma, Oregon, Pennsylvania, Rhode Island, South Carolina, South Dakota, Texas, Utah, Vermont, Washington, West Virginia, Wisconsin, Wyoming. Registries included in the joinpoint models (2008–2015) for nonmalignant CNS tumors (46 states and 1 territory covering 97.5% of the population of the United States and Puerto Rico): Alabama, Alaska, Arizona, Arkansas, California, Colorado, Connecticut, Delaware, Florida, Georgia, Hawaii, Idaho, Illinois, Indiana, Iowa, Kentucky, Louisiana, Maine, Maryland, Massachusetts, Michigan, Mississippi, Missouri, Montana, Nebraska, New Hampshire, New Jersey, New York, North Carolina, North Dakota, Ohio, Oklahoma, Oregon, Pennsylvania, Rhode Island, South Carolina, South Dakota, Tennessee, Texas, Utah, Vermont, Virginia, Washington, West Virginia, Wisconsin, Wyoming, and Puerto Rico.
Figure 6.
Figure 6.
Age-standardized death rates and fixed-interval trends (2012–2016) for the most common causes of cancer death ages 20–49 years, by sex. Five-year AAPC is based on joinpoint trend from 1999–2016. AAPC = 5-year average annual percent change; CI = confidence interval; NOS = not otherwise specified. §Rates are per 100 000 persons and were age-standardized to the 2000 US standard population (19 age groups, Census P25–1130) and delay-adjusted. AAPC is a weighted average of the annual percent change over the fixed interval 2012–2016, using the underlying joinpoint model for the period 1999–2016. Joinpoint models with up to three joinpoints are based on rates per 100 000 persons, age-standardized to the 2000 US standard population (19 age groups, Census P25–1130). For joinpoint analyses, the Joinpoint Regression Program was used (version 4.6.0.0), Bethesda, MD: Statistical Research and Applications Branch, National Cancer Institute; April 2018.

Comment in

References

    1. Wingo PA, Ries LA, Rosenberg HM, Miller DS, Edwards BK.. Cancer incidence and mortality, 1973-1995: a report card for the U.S. Cancer. 1998;82(6):1197–1207. - PubMed
    1. Wingo PA, Ries LA, Giovino GA, et al. Annual report to the nation on the status of cancer, 1973-1996, with a special section on lung cancer and tobacco smoking. J Natl Cancer Inst. 1999;91(8):675–690. - PubMed
    1. Ries LA, Wingo PA, Miller DS, et al. The annual report to the nation on the status of cancer, 1973-1997, with a special section on colorectal cancer. Cancer. 2000;88(10):2398–2424. - PubMed
    1. Howe HL, Wingo PA, Thun MJ, et al. Annual report to the nation on the status of cancer (1973 through 1998), featuring cancers with recent increasing trends. J Natl Cancer Inst. 2001;93(11):824–842. - PubMed
    1. Edwards BK, Howe HL, Ries LA, et al. Annual report to the nation on the status of cancer, 1973-1999, featuring implications of age and aging on U.S. cancer burden. Cancer. 2002;94(10):2766–2792. - PubMed

Publication types

MeSH terms