. 2019 Sep;112(3):800-819.
doi: 10.1111/mmi.14317. Epub 2019 Jun 12.

Adaptation of the group A Streptococcus adhesin Scl1 to bind fibronectin type III repeats within wound-associated extracellular matrix: implications for cancer therapy

Affiliations

Adaptation of the group A Streptococcus adhesin Scl1 to bind fibronectin type III repeats within wound-associated extracellular matrix: implications for cancer therapy

Dudley H McNitt et al. Mol Microbiol. 2019 Sep.

Abstract

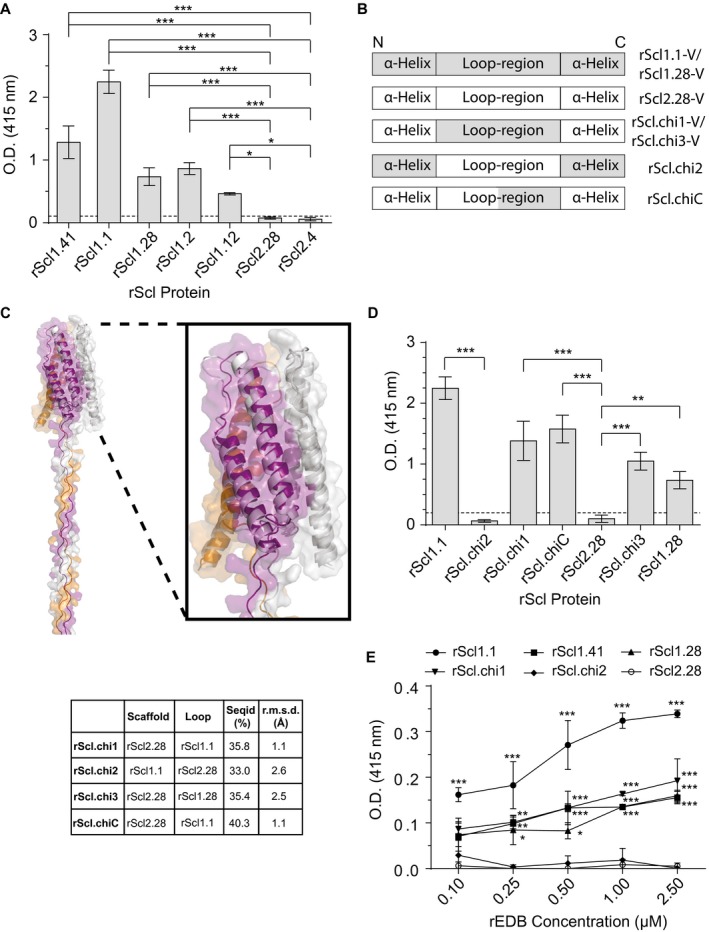
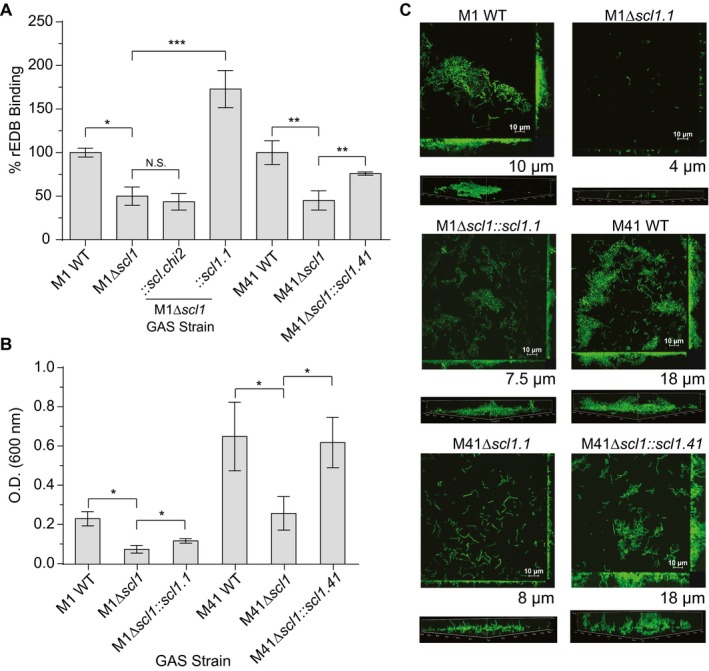
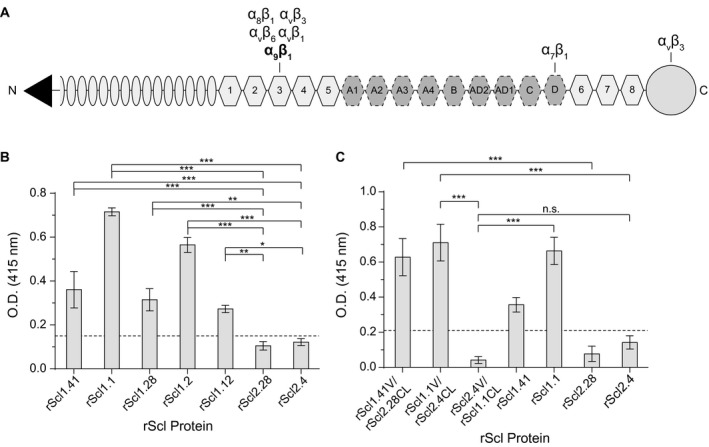
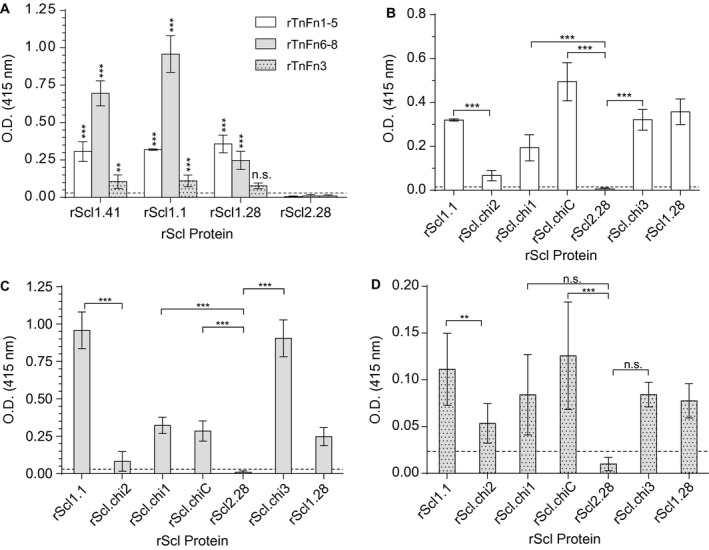
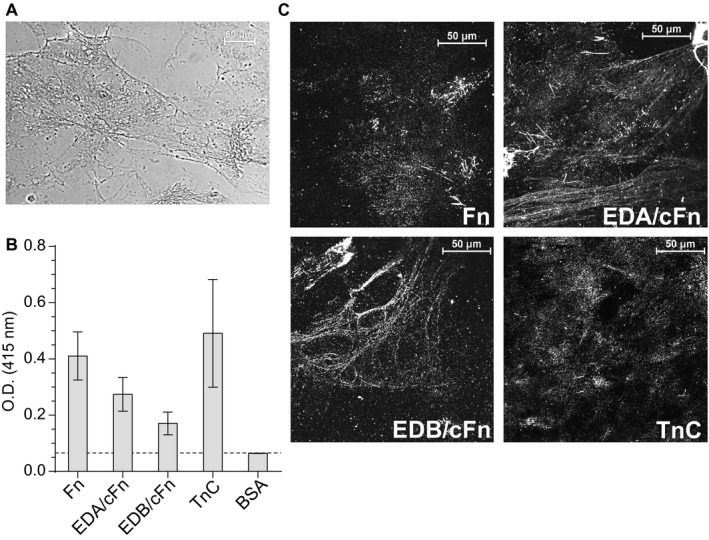
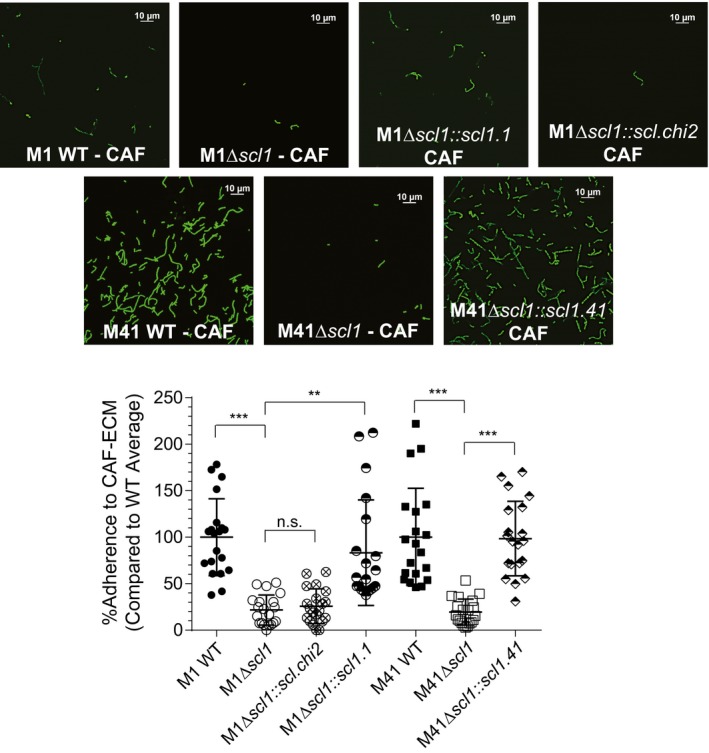
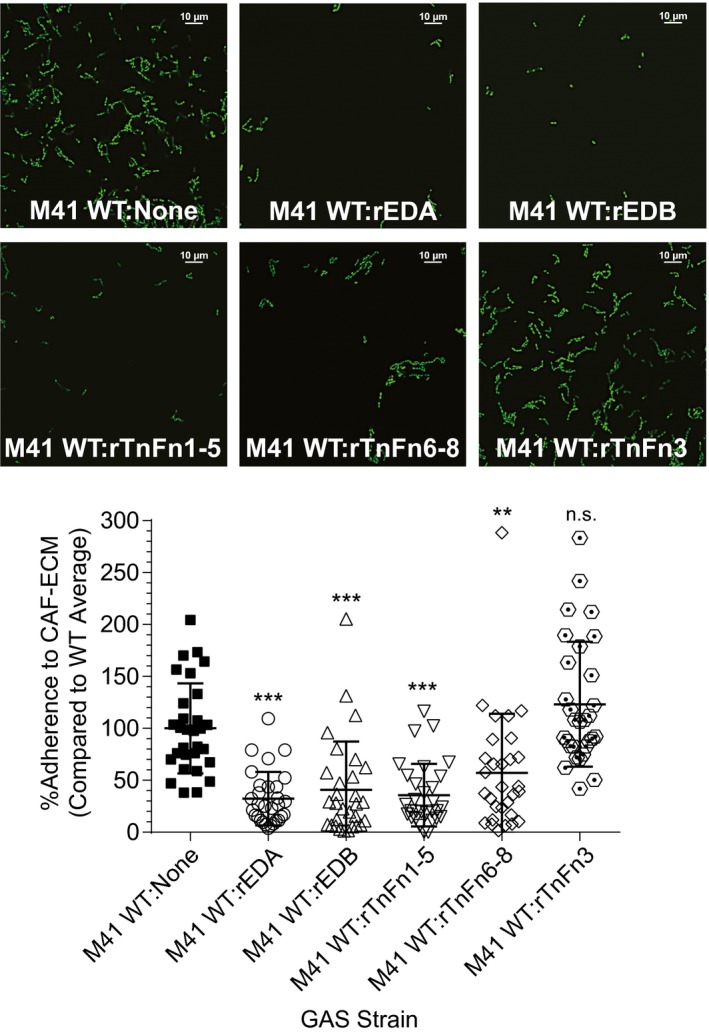
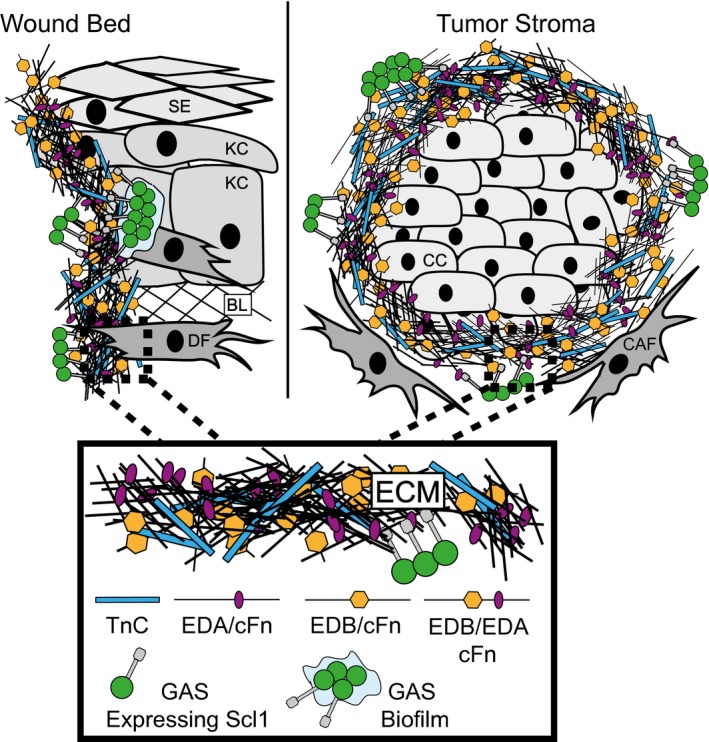
The human-adapted pathogen group A Streptococcus (GAS) utilizes wounds as portals of entry into host tissue, wherein surface adhesins interact with the extracellular matrix, enabling bacterial colonization. The streptococcal collagen-like protein 1 (Scl1) is a major adhesin of GAS that selectively binds to two fibronectin type III (FnIII) repeats within cellular fibronectin, specifically the alternatively spliced extra domains A and B, and the FnIII repeats within tenascin-C. Binding to FnIII repeats was mediated through conserved structural determinants present within the Scl1 globular domain and facilitated GAS adherence and biofilm formation. Isoforms of cellular fibronectin that contain extra domains A and B, as well as tenascin-C, are present for several days in the wound extracellular matrix. Scl1-FnIII binding is therefore an example of GAS adaptation to the host's wound environment. Similarly, cellular fibronectin isoforms and tenascin-C are present in the tumor microenvironment. Consistent with this, FnIII repeats mediate GAS attachment to and enhancement of biofilm formation on matrices deposited by cancer-associated fibroblasts and osteosarcoma cells. These data collectively support the premise for utilization of the Scl1-FnIII interaction as a novel method of anti-neoplastic targeting in the tumor microenvironment.


Conflict of interest statement

The authors report no conflicts of interest with the contents of this article.

Figures

Figure 1
Figure 1
Scl1‐V domain binds fibronectin type III repeat, extra domain B (EDB), via surface‐exposed loops. Recombinant extra domain B (rEDB) was tested for binding to recombinant streptococcal collagen‐like proteins (rScl). A. rEDB binding to Scl1‐ and Scl2‐derived rScl constructs. rScl proteins were immobilized onto Strep‐Tactin‐coated microplate wells and incubated with rEDB. Primary anti‐His‐tag mAb and HRP‐conjugated secondary Ab were used for ligand detection by ELISA. Graph bars indicate the mean OD415nm normalized against BSA controls. Statistical analysis was calculated using a one‐way ANOVA, from three independent experiments, each performed in triplicate wells (N = 3 ± SD); *P ≤ 0.05, ***P ≤ 0.001. Statistical significance evaluates the differences in rEDB binding by rScl1 proteins, as compared to ECM‐binding negative rScl2.28 and rScl2.4 control proteins. Dashed line indicates threshold OD415nm +2SD values recorded for binding‐negative rScl2.28 control protein. B. Schematic representation of the variable (V) domains in recombinant Scl constructs used. Homotrimeric rScl1.1‐ and rScl1.28‐V domains (gray box), and rScl2.28‐V domain (white box) each consists of three conserved pairs of anti‐parallel α‐helices, with interconnecting loops (McNitt et al., 2018). Chimeric proteins were generated by replacing either the entire (rScl.chi1‐3) or partial (rScl.chiC) loop sequences between different constructs. C. I‐TASSER modeling of chimeric rScl proteins. Left, far‐out view of a representative I‐TASSER model of Scl.chi1, including the V domain and the first 16 triplets of the CL domain. Right insert, close‐up view of the Scl.chi1‐V domain. The three monomers are colored purple, orange and gray in both models. In close‐up view, white depicts Scl2.28, the loop‐host Scl protein of Scl.chi1. Bottom, I‐TASSER model sequence identities and root mean square deviations from Scl2.3, room mean square deviations performed using DALI server. D. rEDB binding to chimeric rScl constructs. ELISA was performed as described in panel A. Statistical analysis was calculated using a one‐way ANOVA, from three independent experiments, each performed in triplicate wells (N = 3 ± SD); **P ≤ 0.01, ***P ≤ 0.001. Statistical significance evaluates the differences in rEDB binding between chimeric proteins and their respective loop‐hosts: rScl.chi1, rScl.chiC and rScl.chi3 compared to binding‐negative control protein rScl2.28, and rScl.chi2 to binding‐positive control protein rScl1.1. Dashed line indicates threshold OD415nm +2SD values recorded for binding‐negative rScl2.28 control protein. E. Concentration‐dependent binding of rEDB to rScl proteins. rScl proteins, immobilized onto Strep‐Tactin coated microplate wells, were incubated with increasing concentrations of rEDB (0.1–2.5 µM) and detected by ELISA, as described above. Statistical analysis was calculated using a two‐way ANOVA, from three independent experiments, each performed in triplicate wells (N = 3 ± SD); *P ≤ 0.05, **P ≤ 0.01, ***P ≤ 0.001. Statistical significance evaluates the differences in rEDB binding by rScl1 proteins, rScl.chi1 and rScl.chi2, as compared with ECM‐binding negative rScl2.28 control protein. [Colour figure can be viewed at wileyonlinelibrary.com]
Figure 2
Figure 2
Scl1‐EDB binding mediates GAS adherence and biofilm formation. Binding of rEDB to whole GAS cells was compared between WT and Δscl1 mutants, as well as the contribution of surface Scl1 to GAS biofilm formation on rEDB‐coated surfaces. A. rEDB binding to whole GAS cells. Isogenic WT and Δscl1 mutants of the M1‐ and M41‐type GAS strains were used, as well as the M1Δscl1 mutant complemented for the expression of native Scl1.1 (Δscl1::scl1.1) or the chimeric Scl.chi2 (Δscl1::scl.chi2) proteins, and M41Δscl1 mutant complemented for the expression of native Scl1.41 variant (Δscl1::scl1.41). rEDB binding to whole GAS cells was detected by flow cytometry with primary anti‐His‐tag mAb; binding to GAS WT cells was set as 100%. Statistical analysis was calculated using Student's two‐tailed t‐test from three independent experiments (N = 3 ± SD); *P ≤ 0.05, **P ≤ 0.01, ***P ≤ 0.001. B. Assessment of biofilm formation on rEDB‐coated surfaces. M1 and M41 WT, Δscl1 isogenic mutants, and Δscl1 mutants complemented for the expression of native Scl1 variants were compared. Biofilm formation was evaluated spectrophotometrically following crystal violet staining. Graphic bars indicate the mean OD600nm normalized against BSA controls. Statistical analysis was calculated using Student's two‐tailed t‐test from three independent experiments (N = 3 ± SD); *P ≤ 0.05. C. Microscopy imaging of GAS biofilms formed on rEDB coating. The same set of GFP‐expressing GAS strains shown in panel B were grown on rEDB‐coated glass coverslips for 24 h. Two‐dimensional orthogonal views of GAS biofilms are representative of Z stacks from 15 fields over two experiments. Average vertical thickness is indicated in micrometers below two‐dimensional orthogonal views, taken from 15 arbitrary fields over two experiments. [Colour figure can be viewed at wileyonlinelibrary.com]
Figure 3
Figure 3
Characterization of rScl1 and rScl2 binding to tenascin‐C (TnC). For ligand binding by ELISA, rScl proteins were immobilized onto Strep‐Tactin‐coated microplate wells and incubated with full‐length TnC. Primary anti‐TnC mAb and HRP‐conjugated secondary Ab were used for ligand detection. Graph bars indicate the mean OD415nm normalized against BSA controls. Statistical analysis was calculated using a one‐way ANOVA, from three independent experiments (unless noted otherwise), each performed in triplicate wells (N = 3 ± SD); *P ≤ 0.05, **P ≤ 0.01, ***P ≤ 0.001. Dashed line indicates threshold OD415nm +2SD values recorded for binding‐negative rScl2.28 control protein. A. Schematic representation of full‐length TnC. Depicted are from the N‐terminus: assembly domain (triangle), epidermal growth factor‐like repeats (ovals), constitutively expressed fibronectin type III repeats 1‐5 and 6‐8 (light hexagons), alternatively spliced fibronectin type III repeats (dark hexagons), and fibrinogen‐related domain (circle). Known integrin‐binding domains are marked above the model. B. TnC binding to recombinant Scl1‐ and Scl2 ‐derived constructs. rScl1 and rScl2 panel represents diverse Scl1 and Scl2 variants originating from strains of diverse M types. Statistical significance evaluates the differences in TnC binding by rScl1 proteins from M41, M1, M28, M2 and M12 strains, as compared to rScl2 control proteins from M28 and M4 strains. C. Identification of the Scl1 domain responsible for TnC binding. A set of rScl proteins were tested for binding to TnC by ELISA that included the original rScl1 (rScl1.41, rScl.1) and rScl2 (rScl2.28, rScl2.4) proteins, as well as constructs generated via domain swapping; domain compositions for those rScl constructs are shown underneath the graph. Statistical significance evaluates the differences in TnC binding, as depicted on the graph. Two independent experiments were performed, using triplicate wells.
Figure 4
Figure 4
Characterization of rScl1 binding to recombinant fibronectin type III repeats in tenascin‐C (rTnFnIII). For ligand binding by ELISA, rScl proteins were immobilized onto Strep‐Tactin‐coated microplate wells and incubated with recombinant TnC fragments comprising of rTnFnIII repeats. Primary anti‐rTnFnIII (anti‐His‐tag) mAb and HRP‐conjugated secondary Ab were used for ligand detection. Graph bars indicate the mean OD415nm normalized against BSA controls. Statistical analysis was calculated using a one‐way ANOVA from three independent experiments, each performed in triplicate wells (N = 3 ± SD); **P ≤ 0.01, ***P ≤ 0.001. Dashed line indicates threshold OD415nm +2SD values recorded for binding‐negative rScl2.28 control protein. A. Binding of rTnFnIII to original rScl1 and rScl2 proteins. Statistical significance evaluates the difference in rTnFnIII binding by rScl1 proteins, as compared to TnC‐binding‐negative rScl2.28 control protein. B–D. Binding of rTnFnIII constructs to original and chimeric rScl proteins. rScl binding by rTnFn1‐5 (B), rTnFn6‐8 (C) and rTnFn3 (D) is shown.
Figure 5
Figure 5
Characterization of extracellular matrices deposited by cancer‐associated fibroblasts (CAFs). CAFs were isolated from a stage IV laryngeal primary tumor and grown to confluency. Matrices were prepared after the removal of cells by treatment with EGTA and were then evaluated for the presence of EDA‐ and EDB‐containing fibronectins and TnC. A. Visualization of the overall structure of ECM deposited by CAFs. Ponceau S staining reveals complex fibrillary network of the matrices used in this study. B. Characterization of the ECM deposited by CAFs. The presence of total Fn, EDA/cFn, EDB/cFn and TnC was assessed by ELISA with specific mAbs and secondary HRP‐conjugated antibody. Graph bars indicate the mean OD415nm from three independent experiments, each with triplicate wells (N = 3 ± SD). Dashed line indicates threshold OD415nm +2SD values recorded for BSA control wells. C. Immunofluorescent visualization of the ECM deposited by CAFs. CAF‐deposited matrices prepared on glass coverslips were incubated with primary mAbs specific for Fn, EDA/cFn, EDB/cFn and TnC, followed by secondary Ab conjugated with Alexa Fluor® 568. Images were taken using confocal microscope with 60× objective; representative images are shown from two independent experiments, imaging 10 arbitrary fields per coverslip.
Figure 6
Figure 6
Scl1‐mediated GAS attachment to ECM‐deposited by cancer‐associated fibroblasts (CAFs). Isogenic WT M1 and M41 GAS strains, their Δscl1 mutants, and trans‐complemented strains to restore Scl1 expression in each mutant, or express Scl.chimera2, were compared for the attachment to CAF‐derived ECM. GFP‐GAS strains were inoculated onto CAF‐derived ECM coatings, allowed to attach for 1 h, and imaged using fluorescent confocal microscope with 100x objective. Top, representative images of attached strains are shown. Bottom, quantification of GAS attachment. Bacteria were counted in 20 random fields, and the average from all 20 fields was calculated with WT binding set as a 100%. Statistical significance was calculated using a one‐way ANOVA from three independent experiments, each performed in duplicate wells (N = 3 ± SD); **P ≤ 0.01, ***P ≤ 0.001. Statistical analysis evaluates the difference between adherence to CAF‐derived matrices by the WT and their respective isogenic Δscl1 mutants. Each symbol shown represents one imaged‐field. [Colour figure can be viewed at wileyonlinelibrary.com]
Figure 7
Figure 7
Specificity of Scl1‐mediated GAS attachment to cancer‐associated fibroblast matrices. WT GFP‐M41 strain was pre‐incubated with recombinant ECM ligands for 30 min, prior to attachment assay on CAF‐derived ECM. Recombinant ECM constructs included rEDA, rEDB, rTnFn1‐5, rTnFn6‐8 and rTnFn3. GAS were allowed to attach for 1 h and then imaged using fluorescent confocal microscope with 100× objective. Top, representative images and Bottom, quantification of GAS attachment with WT binding set as 100%. Bacteria were counted in 30 random fields, and the average from all 30 fields was calculated. Percentage based off of the average number of counted bacteria for the parental WT strain. Statistical significance was calculated using a one‐way ANOVA from two independent experiments, each performed in duplicate wells (N = 3 ± SD); **P ≤ 0.01, ***P ≤ 0.001. Statistical analysis evaluates the difference in adherence between WT GAS and WT GAS pre‐incubated with rECM competitor. Each symbol represents one imaged‐field. [Colour figure can be viewed at wileyonlinelibrary.com]
Figure 8
Figure 8
Model of GAS colonization of wound and tumor microenvironments. The wound and tumor microenvironments are enriched in isoforms of cellular fibronectin (cFn) that contain extra domain A (EDA) and extra domain B (EDB), as well as tenascin‐C (TnC). Left, GAS gains access to the host via portal of entry, such as through a breach in keratinized squamous epithelium (SE), into a tissue environment that contains keratinocytes (KC), basal lamina (BL) ECM and dermal fibroblasts (DF). Within wound, cells such as DFs deposit cFn isoforms that contain EDA and EDB, as well as TnC. GAS‐Scl1 adhesin binds EDA and EDB of cFn, and TnC, promoting call attachment and tissue microcolony formation within the wound. Right, Cancer cells (CC) are surrounded by cancer‐associated fibroblasts (CAFs), which deposit cFn isoforms that contain EDA and/or EDB, and TnC, recognized by GAS‐Scl1. Enlarged insert, close‐up view of the wound‐ and tumor‐associated ECM. [Colour figure can be viewed at wileyonlinelibrary.com]

Similar articles

Cited by

References

    1. Aukhil, I. , Joshi, P. , Yan, Y. and Erickson, H.P. (1993) Cell‐ and heparin‐binding domains of the hexabrachion arm identified by tenascin expression proteins. Journal of Biological Chemistry, 268, 2542–2553. - PubMed
    1. Bachert, B.A. , Choi, S.J. , LaSala, P.R. , Harper, T.I. , McNitt, D.H. , Boehm, D.T. , et al (2016) Unique footprint in the scl1.3 locus affects adhesion and biofilm formation of the invasive M3‐type group A Streptococcus . Frontiers in Cellular and Infection Microbiology, 6, 90. - PMC - PubMed
    1. Balza, E. , Sassi, F. , Ventura, E. , Parodi, A. , Fossati, S. , Blalock, W. , et al (2009) A novel human fibronectin cryptic sequence unmasked by the insertion of the angiogenesis‐associated extra type III domain B. International Journal of Cancer, 125, 751–758. - PubMed
    1. Berisio, R. , Vitagliano, L. , Mazzarella, L. and Zagari, A. (2002) Crystal structure of the collagen triple helix model [(Pro‐Pro‐Gly)10]3 . Protein Science, 11, 262–270. - PMC - PubMed
    1. Birchler, M.T. , Milisavlijevic, D. , Pfaltz, M. , Neri, D. , Odermatt, B. , Schmid, S. , et al (2003) Expression of the extra domain B of fibronectin, a marker of angiogenesis, in head and neck tumors. Laryngoscope, 113, 1231–1237. - PubMed

Publication types

MeSH terms