

Continuous monitoring of aerial bioburden within intensive care isolation rooms and identification of high-risk activities
- PMID: 31145931
- PMCID: PMC7114667
- DOI: 10.1016/j.jhin.2019.05.010
Continuous monitoring of aerial bioburden within intensive care isolation rooms and identification of high-risk activities
Abstract
Background: The spread of pathogens via the airborne route is often underestimated, and little is known about the extent to which airborne microbial contamination levels vary throughout the day and night in hospital facilities.
Aims: To evaluate airborne contamination levels within intensive care unit (ICU) isolation rooms over 10-24-h periods in order to improve understanding of the variability of environmental aerial bioburden, and the extent to which ward activities may contribute.
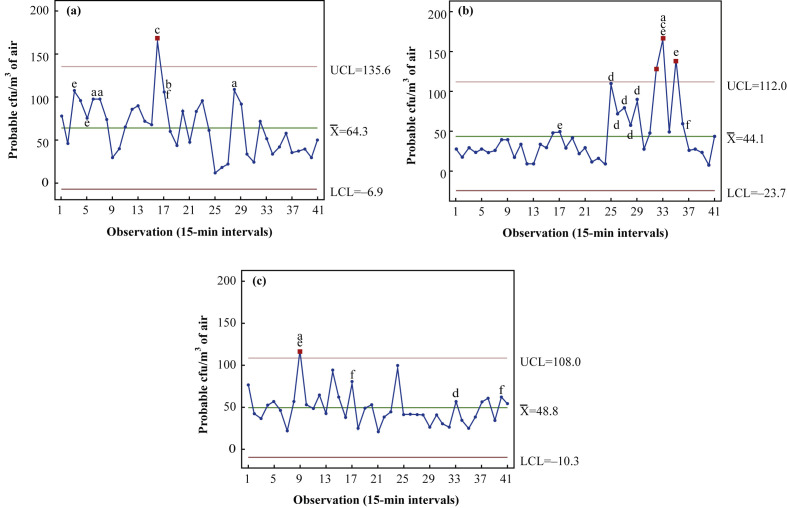
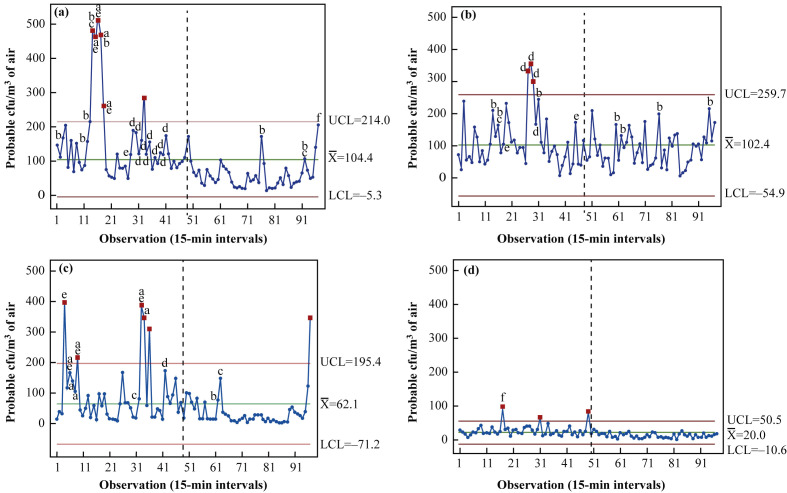
Methods: Environmental air monitoring was conducted within occupied and vacant inpatient isolation rooms. A sieve impactor sampler was used to collect 500-L air samples every 15 min over 10-h (08:00-18:00 h) and 24-h (08:00-08:00 h) periods. Samples were collected, room activity was logged, and bacterial contamination levels were recorded as colony-forming units (cfu)/m3 air.
Findings: A high degree of variability in levels of airborne contamination was observed across all scenarios in the studied isolation rooms. Air bioburden increased as room occupancy increased, with air contamination levels highest in rooms occupied for the longest time during the study (10 days) (mean 104.4 cfu/m3, range 12-510 cfu/m3). Counts were lowest in unoccupied rooms (mean 20 cfu/m3) and during the night.
Conclusion: Peaks in airborne contamination were directly associated with an increase in activity levels. This study provides the first clear evidence of the extent of variability in microbial airborne levels over 24-h periods in ICU isolation rooms, and found direct correlation between microbial load and ward activity.
Keywords: Air sampling; Airborne; Bacteria; Bioburden; Contamination; Environment.
Copyright © 2019 The Healthcare Infection Society. Published by Elsevier Ltd. All rights reserved.
Figures
Comment in
-
Quality of hospital air.J Hosp Infect. 2020 Mar;104(3):300-301. doi: 10.1016/j.jhin.2019.11.013. Epub 2019 Nov 22. J Hosp Infect. 2020. PMID: 31765669 No abstract available.
References
-
- House of Commons Public Accounts Committee . Authority of the House of Commons; London: 2009. Reducing healthcare-associated infections in hospitals in England. Fifty-second report of Session 2008–9.https://publications.parliament.uk/pa/cm200809/cmselect/cmpubacc/812/812... Available at: [last accessed July 2017]
-
- Mirhoseini S.H., Nikaeen M., Shamsizadeh Z., Khanahmad H. Hospital air: a potential route for transmission of infections caused by β-lactam-resistant bacteria. Am J Infect Control. 2016;44:898–904. - PubMed
-
- Department of Health . Specialised ventilation for healthcare premises. Part A: design and validation. The Stationery Office; London: 2007. Health technical memorandum HTM 03e01.
-
- Fitzgerald D., Haas D.W. Mycobacterium tuberculosis. In: Mandell G.L., Bennett J.E., Dolin R., editors. Principles and practice of infectious diseases. 6th edition. Churchill Livingstone; Philadelphia: 2005. pp. 2852–2886.
Publication types
MeSH terms
LinkOut - more resources
Full Text Sources
