. 2019 Aug:94:372-391.
doi: 10.1016/j.actbio.2019.05.064. Epub 2019 May 27.

In vitro aged, hiPSC-origin engineered heart tissue models with age-dependent functional deterioration to study myocardial infarction

Affiliations

In vitro aged, hiPSC-origin engineered heart tissue models with age-dependent functional deterioration to study myocardial infarction

Aylin Acun et al. Acta Biomater. 2019 Aug.

Abstract

Deaths attributed to ischemic heart disease increased by 41.7% from 1990 to 2013. This is primarily due to an increase in the aged population, however, research on cardiovascular disease (CVD) has been overlooking aging, a well-documented contributor to CVD. The use of young animals is heavily preferred due to lower costs and ready availability, despite the prominent differences between young and aged heart structure and function. Here we present the first human induced pluripotent stem cell (hiPSC)-derived cardiomyocyte (iCM)-based, in vitro aged myocardial tissue model as an alternative research platform. Within 4 months, iCMs go through accelerated senescence and show cellular characteristics of aging. Furthermore, the model tissues fabricated using aged iCMs, with stiffness resembling that of aged human heart, show functional and pharmacological deterioration specific to aged myocardium. Our novel tissue model with age-appropriate physiology and pathology presents a promising new platform for investigating CVD or other age-related diseases. STATEMENT OF SIGNIFICANCE: In vitro and in vivo models of cardiovascular disease are aimed to provide crucial insight on the pathology and treatment of these diseases. However, the contribution of age-dependent cardiovascular changes is greatly underestimated through the use of young animals and premature cardiomyocytes. Here, we developed in vitro aged cardiac tissue models that mimic the aged heart tissue microenvironment and cellular phenotype and present the first evidence that age-appropriate in vitro disease models can be developed to gain more physiologically-relevant insight on development, progression, and amelioration of cardiovascular diseases.

Keywords: Aging; Human induced pluripotent stem cell; Reperfusion injury; Tissue engineering.


Conflict of interest statement

7. Disclosure

Authors report no competing financial interests

Figures

Fig. 1.
Fig. 1.
iCM differentiation efficiency characterization. (A) The beating efficiency (%) per differentiation of F-iCMs and E-iCMs. (B) The FACS analysis against TNNT2 of F-iCMs and E-iCMs showing differentiation efficiency of each differentiation batch represented as TNNT2 positive cell (%). (C) The spontaneous beat rate per E-iCMs and F-iCMs at different days of culture. The TNNT immunostaining of (D) F-iCMs, and (E) E-iCMs on different days of culture. Cell nuclei are stained with DAPI (blue). (Scale bars = 20 μm) (n≥6). (For interpretation of the references to colour in this figure legend, the reader is referred to the web version of this article.)
Fig. 2.
Fig. 2.
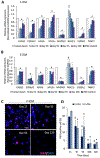
Molecular characterization of iCMs. RT-qPCR analysis of relative mRNA expression of cardiac markers CASQ2, COX6A2, MYH6, MYL2v, MYOM3, NKX2.5, S100A1, and TNNT2 in 65-year-old human heart and (A) F-iCMs, and (B) E-iCMs at different culture ages. Expression in human heart was normalized to 1 for easier comparison. * represents p < 0.05 significant difference in expression of a single target compared to day 21 (One-way ANOVA followed by Tukey’s multiple comparisons test) (n = 3), # indicates p < 0.05, significant difference in NKX2.5 expression of iCMs compared to 65-year-old human heart (Student’s t-test) (For clarity, only the statistical comparison of day 21 to all other groups and comparison of NKX2.5 expression to 65-year-old human heart is shown) (C) Immunostaining of FiCMs at different culture ages for ki67. (Scale bar = 20 um) (D) The quantification of ki67 positive cell (%) of F-iCMs and E-iCMs at different culture ages. * represents p < 0.05, significant difference when ki67 positive cell (%) on day 21F-iCMs is compared to F-iCMs at different culture ages. # represents (p < 0.05) significant difference when ki67 positive cell (%) on day 21 E-iCMs is compared to E-iCMs at different culture ages. (Student’s t-test) (n≥6).
Fig. 3.
Fig. 3.
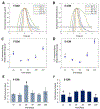
Mechanical characterization of iCMs. (A) The heatmaps showing the beating velocity magnitude (A.U.) and distribution in F-iCMs and E-iCMs at different days of culture. The X and y-axes represent the dimensions of the video (μm). The beat velocity (μm/s) represented with corresponding contraction waveform and frequency on days 35, 55, and 100 of culture (B) of F-iCMs, and (C) of E-iCMs. (D) Average beating velocity (μm/s) of F-iCMs and E-iCMs. * represents p < 0.05, statistical significance compared to day 55 of the same cell line (Student’s t-test) (n = 5).
Fig. 4.
Fig. 4.
Functional characterization of iCMs. The fluorescence intensity representing the change in Ca2 + transient in a single beat in (A) F-iCMs and (B) E-iCMs at different culture ages. The average Ca2 + transient decay (peak to 80% decay) in (C) F-iCMs and (D) E-iCMs from day 21 to day 120 of culture. * indicates p < 0.05, significant difference compared to Ca2 + transient decay on day 55. (Student’s t-test, n = 3). The fold increase in bpm in response to isoproterenol treatment (1 μM) in (E) F-iCMs and in (F) EiCMs at different days of culture. # indicates p < 0.05, significant difference compared to fold increase in bpm on day 55 (One-way ANOVA followed by Tukey’s multiple comparisons test) (n = 3).
Fig. 5.
Fig. 5.
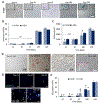
Characterization of aged phenotype of iCMs. (A) The senescence associated β-galactosidase assay images of F-iCMs at different days of culture (blue staining indicates senescence). (B) The senescent cell (%) in F-iCMs and E-iCMs on different days of culture. (Scale bar = 200 μm) (C) Cell area (μm2) of F-iCMs and E-iCMs at different culture ages. (D) The sudan black b (SBB) staining of F-iCMs on day 35 and 100, and of 40 and 65-year-old human heart sections. (Scale bar = 200 μm) (red arrowheads indicating lipofuscin granules) (E) Immunostaining of F-iCMs against p21 at different days of culture. (Scale bar = 50 μm) (F) Quantification of p21 positive cell (%) of F-iCMs and E-iCMs at different culture ages. * indicates p < 0.05, the values for F-iCMs and E-iCMs of same age are significantly different (Student’s t-test), # indicates p < 0.05, significant difference compared to day 120 (One-way ANOVA followed by Tukey’s multiple comparisons test), Ɨ indicates p < 0.05, significant difference compared to day 100, (One-way ANOVA followed by Tukey’s multiple comparisons test) (n≥6). (For interpretation of the references to colour in this figure legend, the reader is referred to the web version of this article.)
Fig. 6.
Fig. 6.
Short term and long-term viability of soft, intermediate, and stiff young and aged tissues. (A) The live/dead images of young and aged tissues 24 h after encapsulation. (B) The live cell (%) of young and aged tissues on day 1 of culture. The change in live cell (%) with time in (C) soft, (D) intermediate, and (E) stiff young and aged tissues. (F) The lifetime of soft, intermediate, and stiff aged and young tissues. * indicates p < 0.05, significant difference compared to stiff tissue (One-way ANOVA followed by Tukey’s multiple comparisons test), # indicates p < 0.05, significant difference compared to intermediate tissue (Student’s t-test) (n≥3) (Scale bars = 200 μm).
Fig. 7.
Fig. 7.
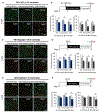
Stress response of young and aged, soft, intermediate and stiff tissues. (A, C, E) Live/dead images and (B, D, F) normalized survival (%) of young and aged tissues with different stiffness after exposure to (A, B) 16 h H2O2 + 2 h normoxia, (C, D) 48 h hypoxia + 24 h normoxia, (E, F) 48 h hypoxia + 2 h normoxia. * indicates p < 0.05, significant difference compared to young tissue at same stiffness, student’s t-test, # indicates p < 0.05, stiff tissue survival is significantly different than soft tissues (Oneway ANOVA followed by Tukey’s multiple comparisons test), Ɨ indicates p < 0.05, stiff tissue survival is significantly different than intermediate tissues (One-way ANOVA followed by Tukey’s multiple comparison’s test) (n≥3) (Scale bars = 200 μm).
Fig. 8.
Fig. 8.
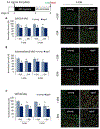
Effect of EHI on survival of young and aged tissues at different stiffness under 48 h hypoxia + 2 h normoxia. The normalized survival (left) and corresponding live/dead images (right) of (A) soft, (B) intermediate, and (C) stiff young and aged tissues with and without EHI (+EHI and −EHI, respectively). * indicates p < 0.05, aged tissue survival is significantly different than young tissue under same condition (Student’s t-test), # indicates p < 0.05, young tissue survival is significantly different under −EHI vs + EHI conditions (Student’s t-test) (Scale bars = 100 μm).
Fig. 9.
Fig. 9.
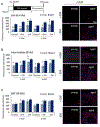
Effect of EHI on ROS production in young and aged tissues at different stiffness under 48 h hypoxia + 2 h normoxia. The ROS level quantified as the fluorescence intensity measurements (left) and corresponding ROS assay images (right) of (A) soft, (B) intermediate, and (C) stiff young and aged tissues with and without EHI (+EHI and −EHI, respectively). * indicates p < 0.05, ** indicates p < 0.01, ROS levels is significantly different than aged tissues under the same conditions (Student’s t-test), # indicates p < 0.05, ROS levels in young tissue is significantly different under −EHI vs + EHI conditions (Student’s t-test) (Scale bars = 200 μm).

Similar articles

Cited by

References

    1. A.H. Association, Heart disease, stroke and research statistics at-a-glance, AHA Website. (2016) 1–5. doi:10.1007/s13398-014-0173-7.2. - DOI
    1. Strait JB, Lakatta EG, Aging-associated cardiovascular changes and their relationship to heart failure, Heart Fail. Clin 8 (2012) 143–164. doi:10.1016/j.hfc.2011.08.011. - DOI - PMC - PubMed
    1. Lieber SC, Aubry N, Pain J, Diaz G, Kim S-J, Vatner SF, Aging increases stiffness of cardiac myocytes measured by atomic force microscopy nanoindentation, Am. J. Physiol. Heart Circ. Physiol 287 (2004) H645–651. doi:10.1152/ajpheart.00564.2003. - DOI - PubMed
    1. Anversa P, Palackal T, Sonnenblick EH, Olivetti G, Meggs LG, Capasso JM, Myocyte cell loss and myocyte cellular hyperplasia in the hypertrophied aging rat heart, Circ. Res 67 (1990) 871–885. - PubMed
    1. Bernhard D, Laufer G, The Aging Cardiomyocyte: A Mini-Review, Gerontology. 54 (2008) 24–31. doi:10.1159/000113503. - DOI - PubMed

Publication types