

Assessment of imaging Cherenkov and scintillation signals in head and neck radiotherapy
- PMID: 31146269
- PMCID: PMC7123963
- DOI: 10.1088/1361-6560/ab25a3
Assessment of imaging Cherenkov and scintillation signals in head and neck radiotherapy
Abstract
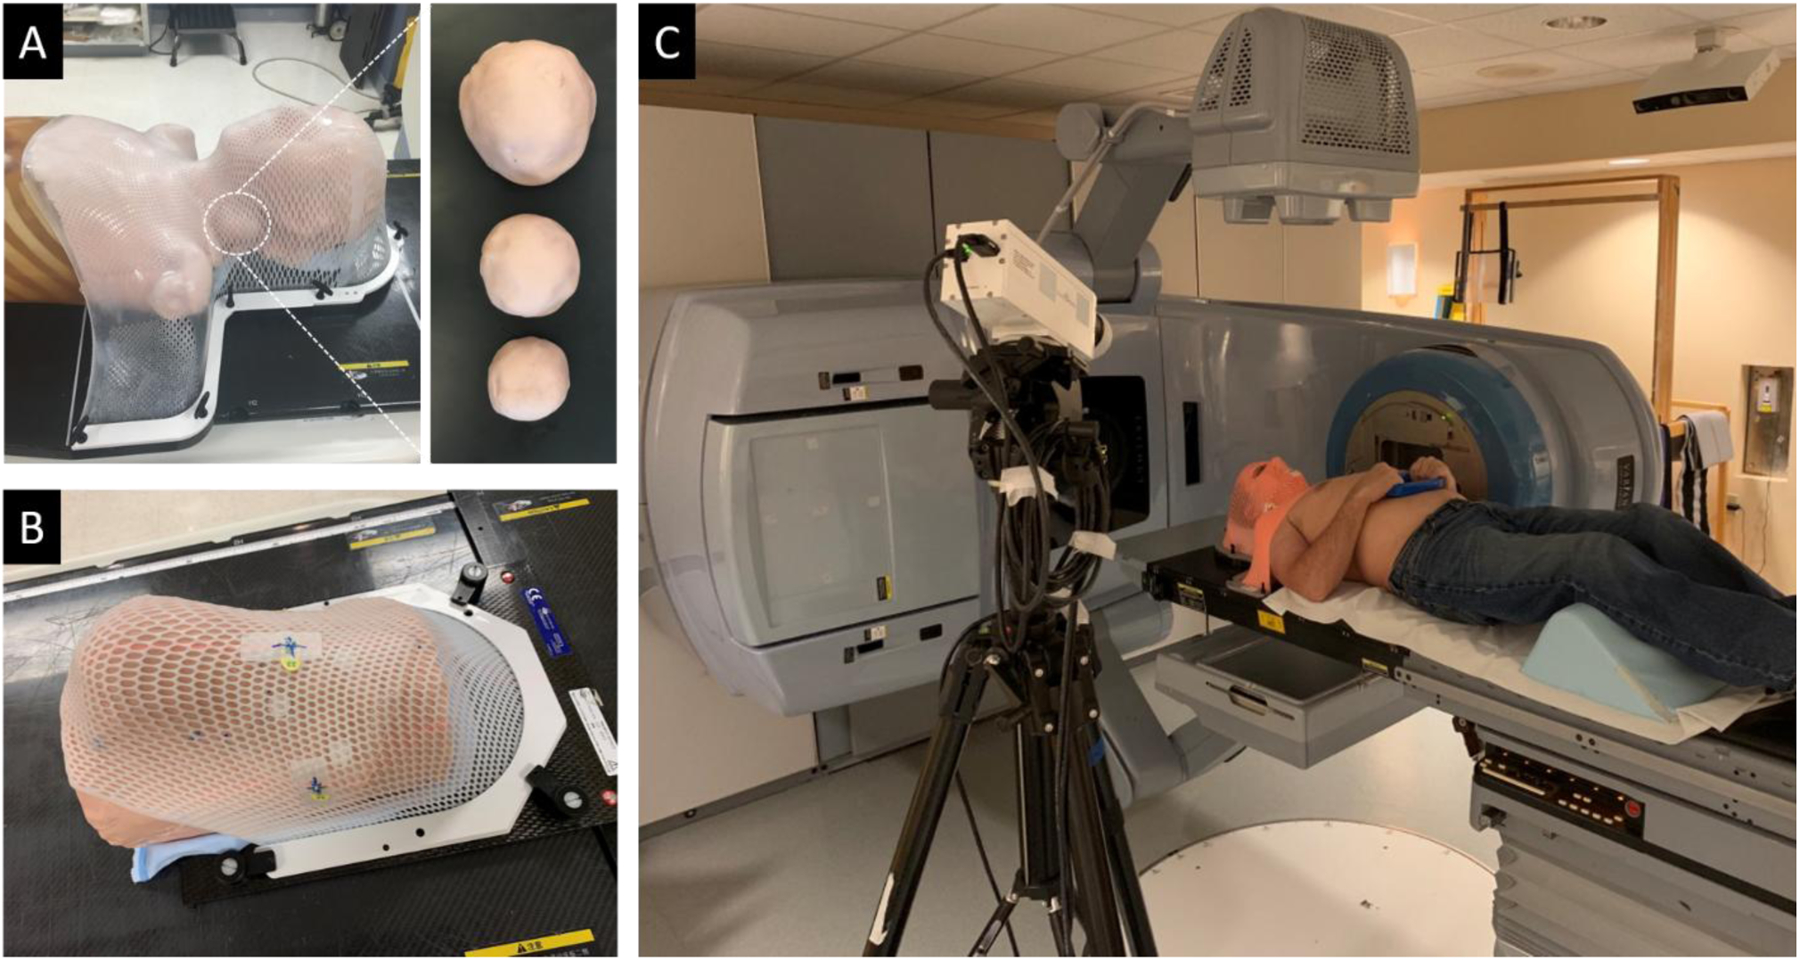
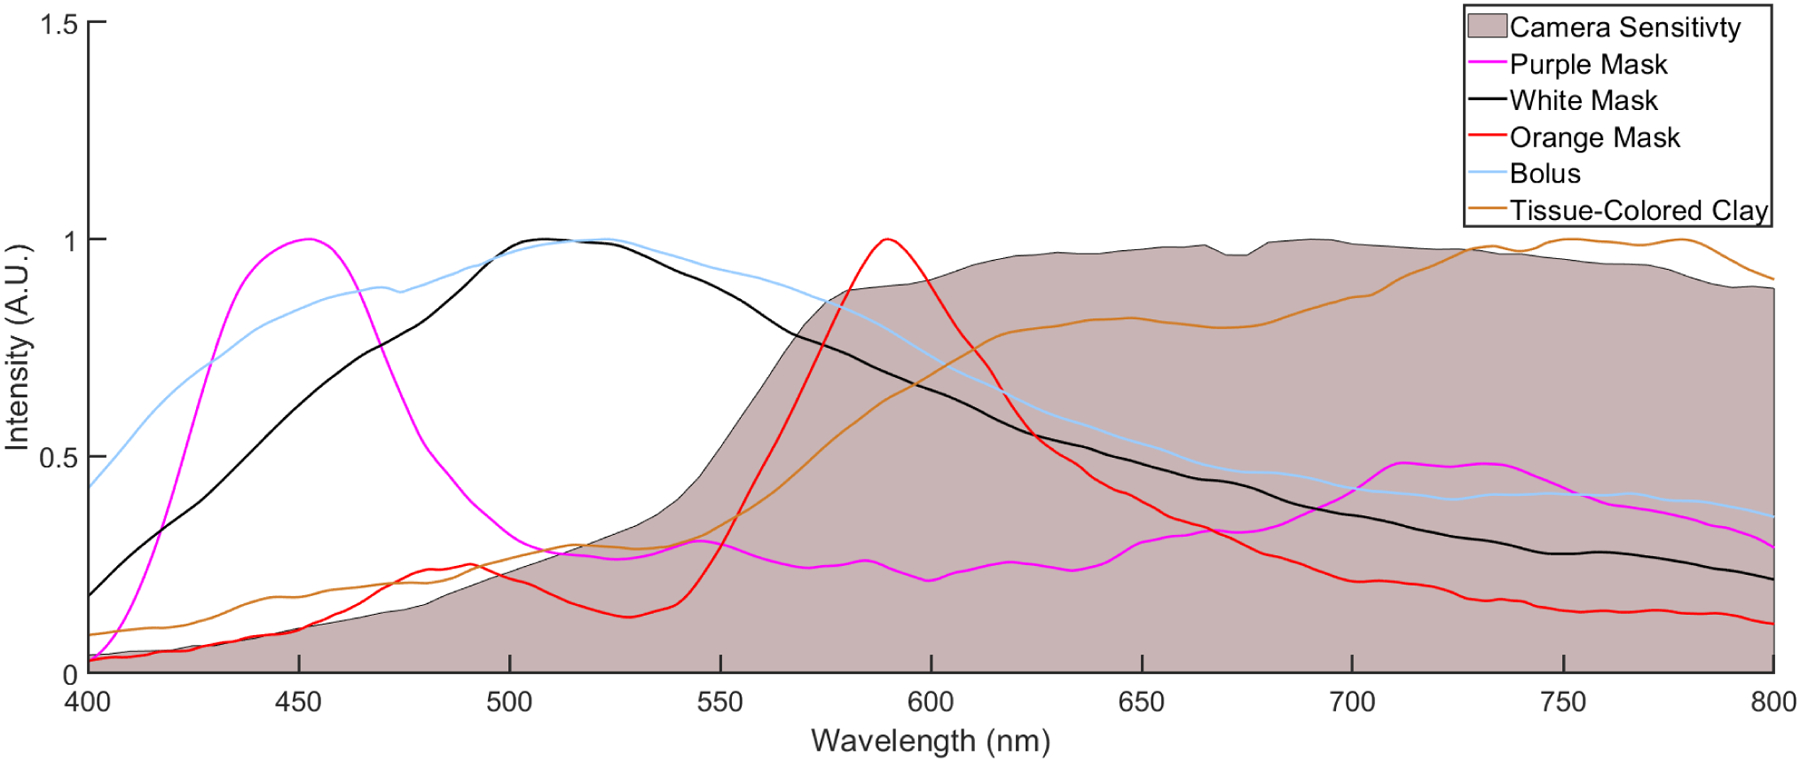
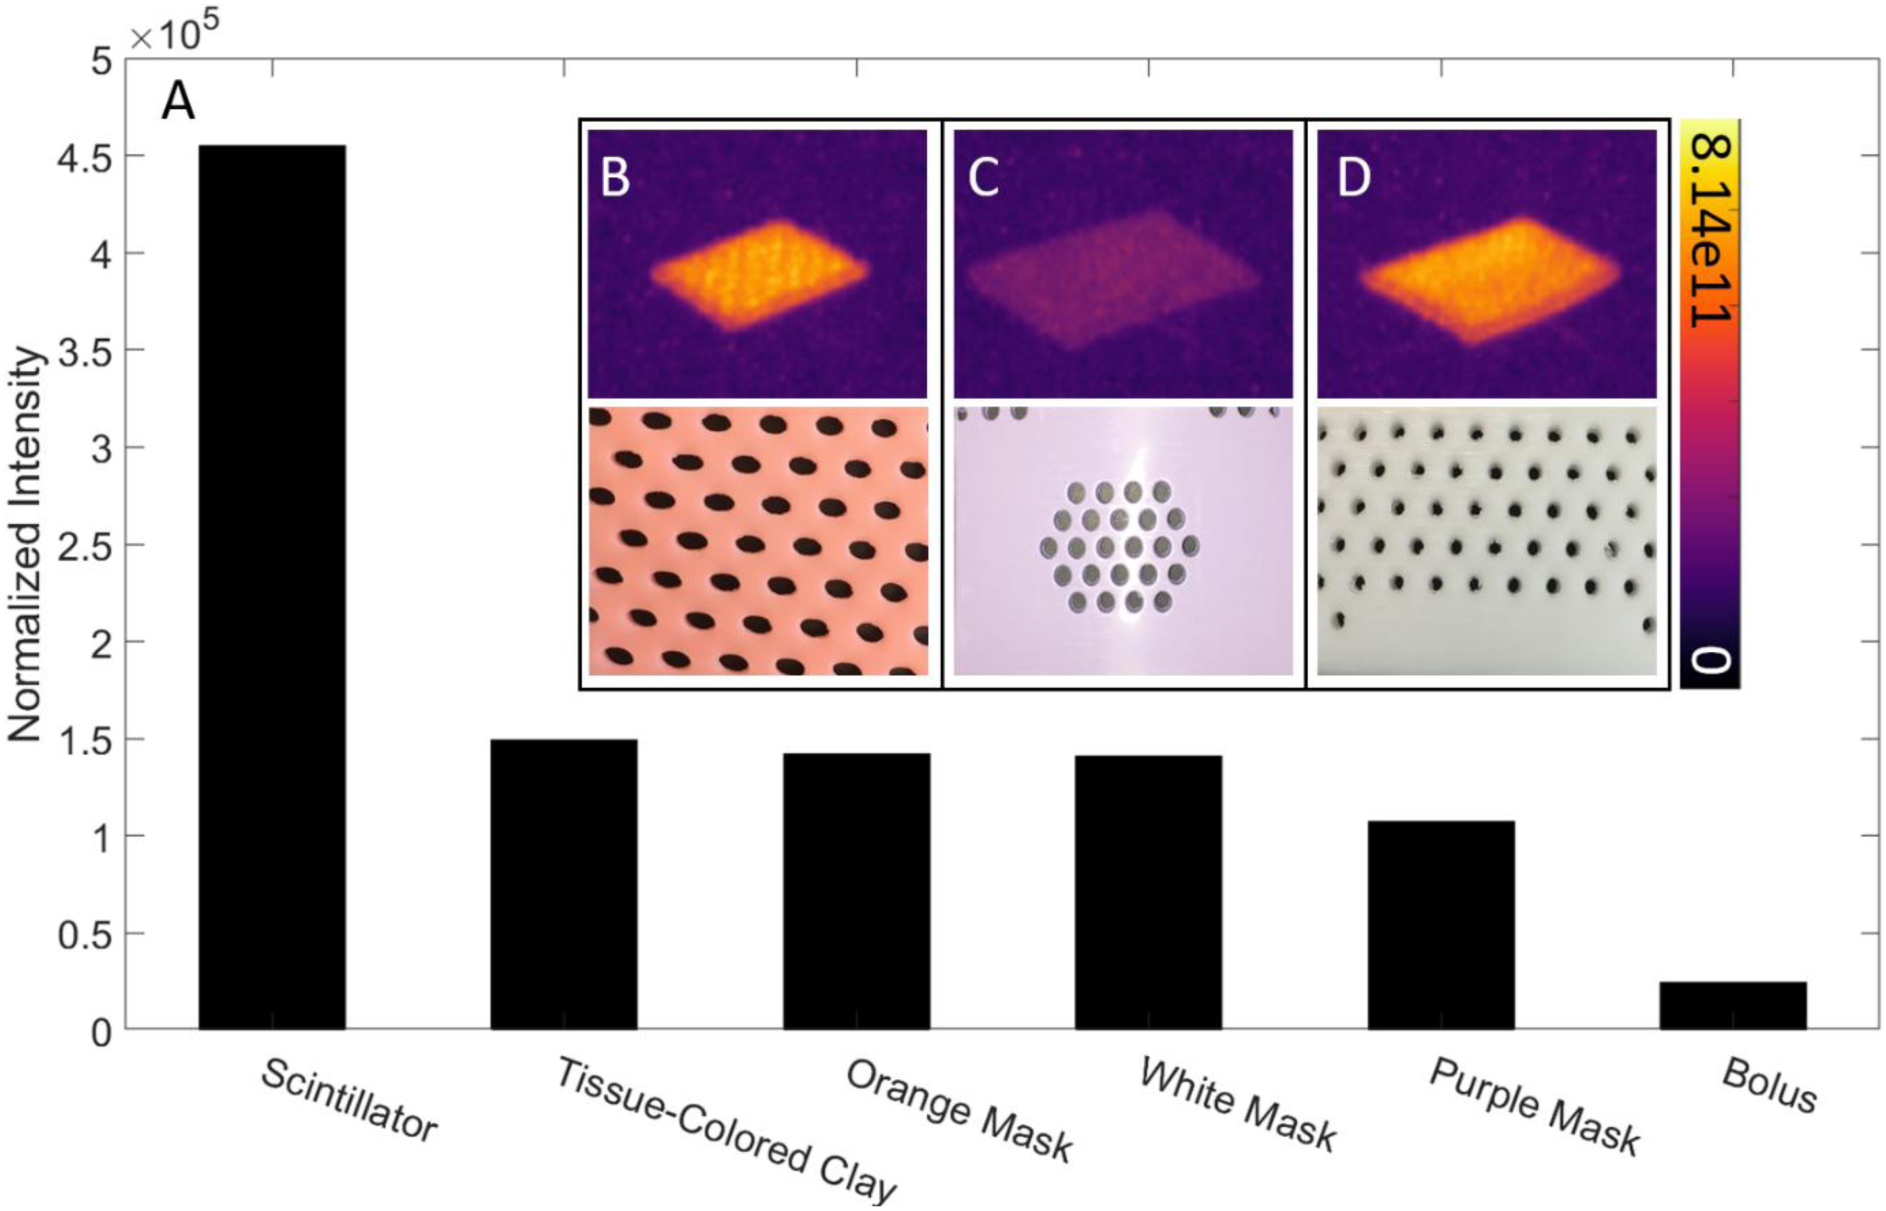
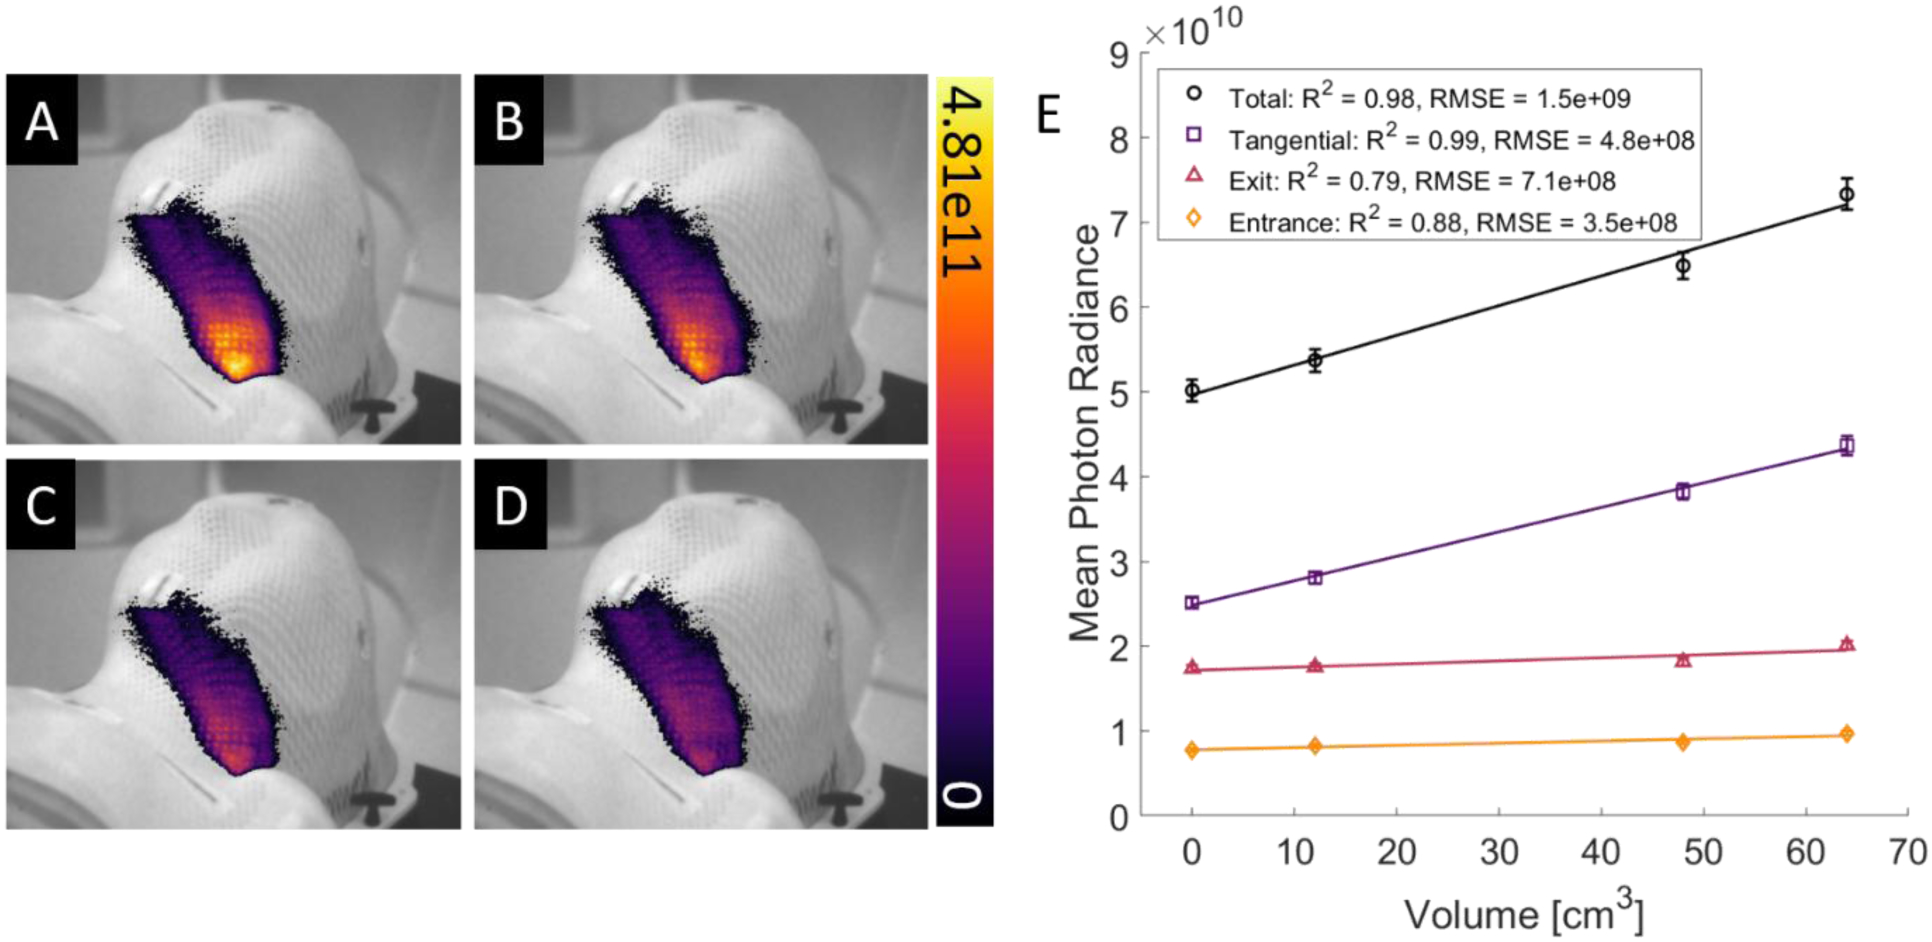
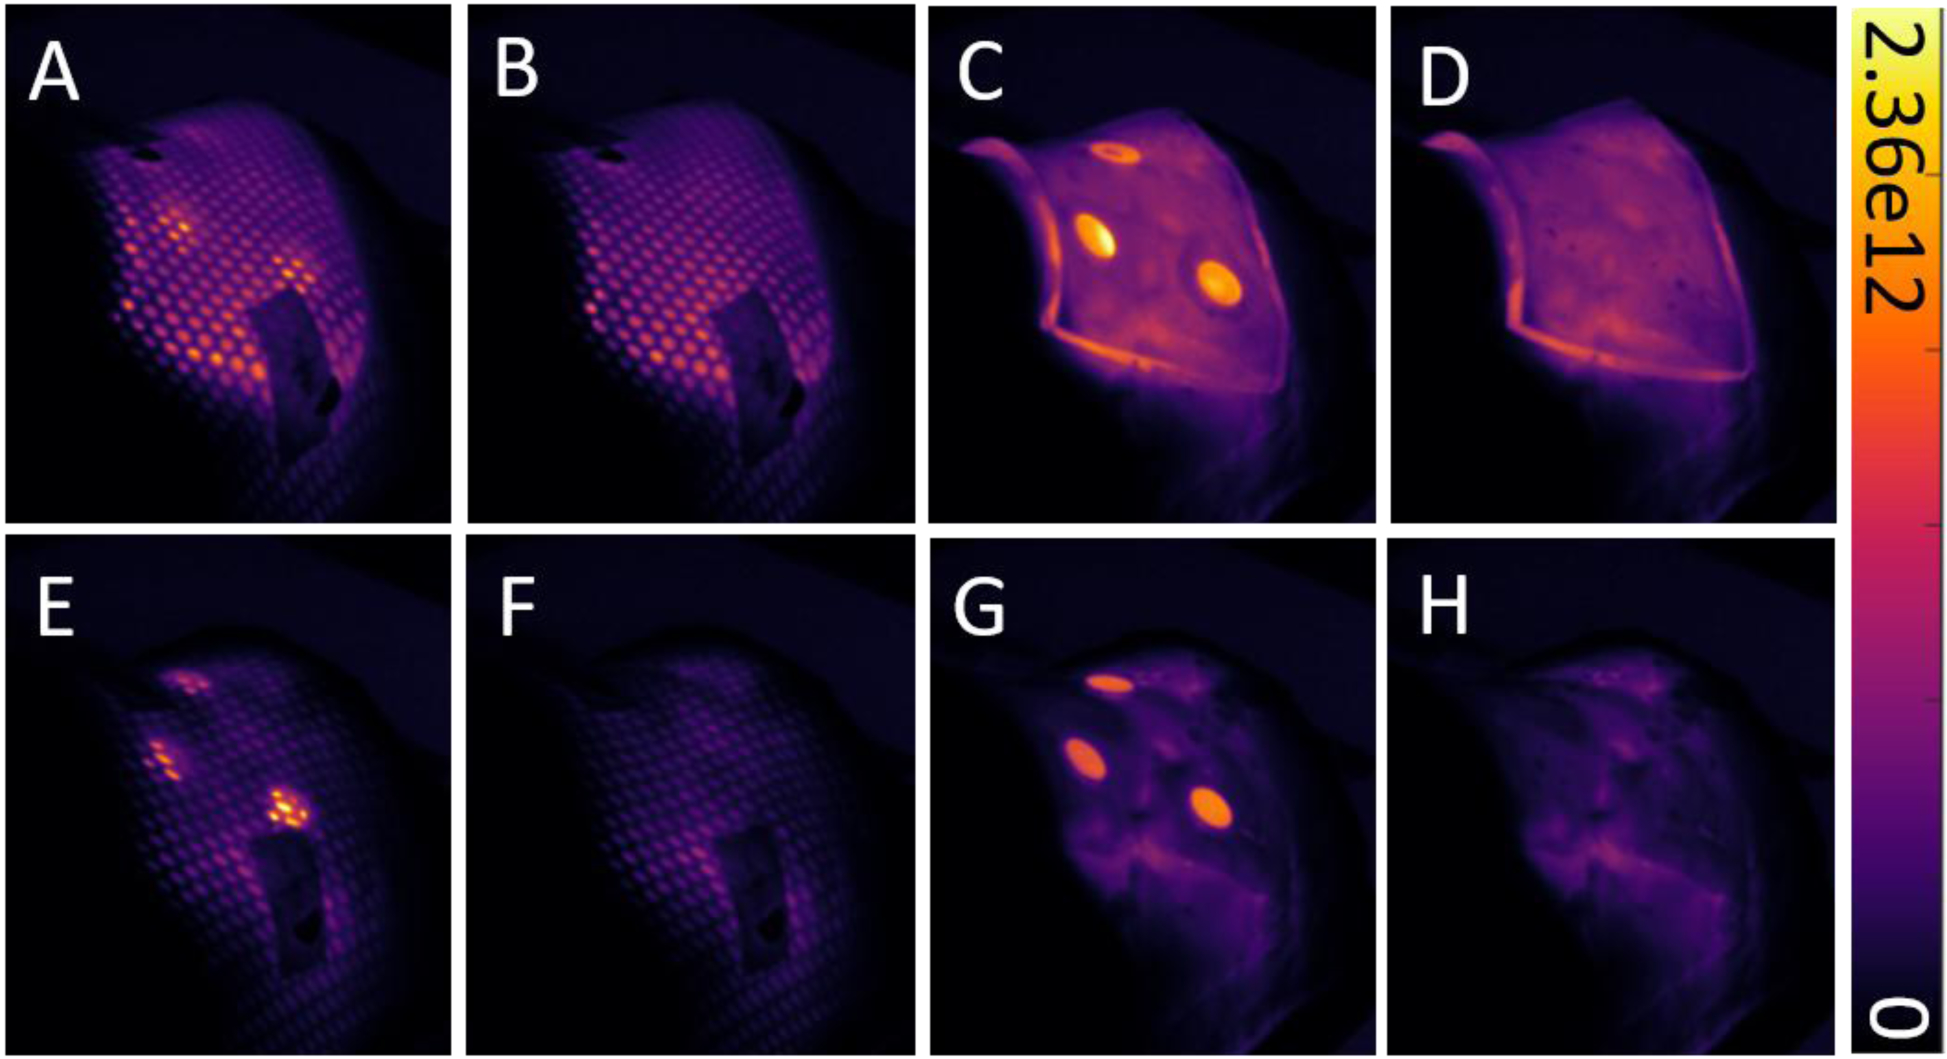
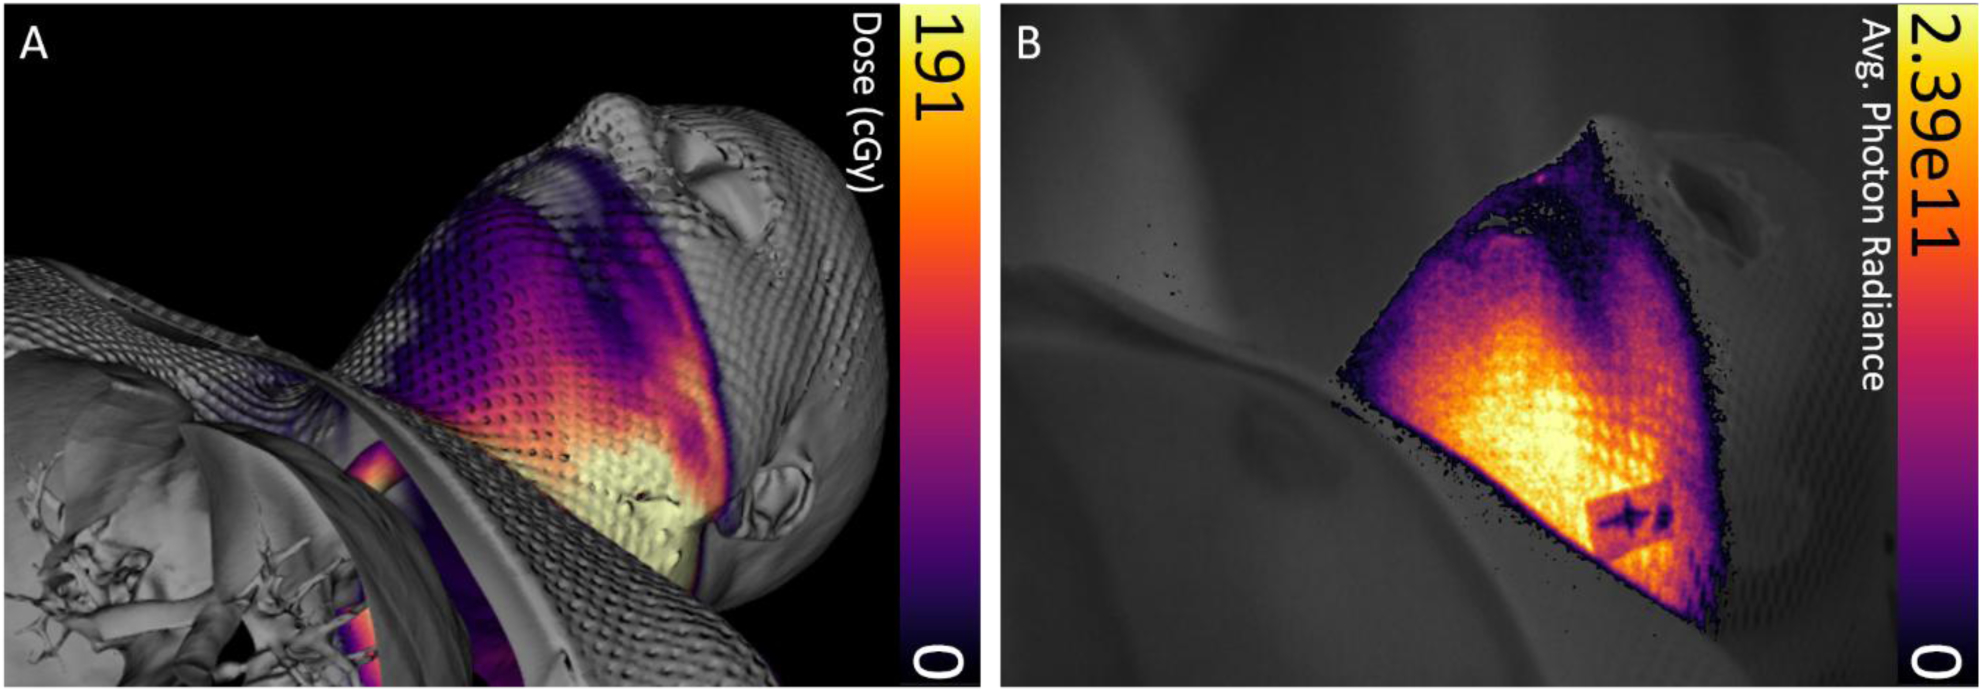
The goal of this study was to test the utility of time-gated optical imaging of head and neck (HN) radiotherapy treatments to measure surface dosimetry in real-time and inform possible interfraction replanning decisions. The benefit of both Cherenkov and scintillator imaging in HN treatments is direct daily feedback on dose, with no change to the clinical workflow. Emission from treatment materials was characterized by measuring radioluminescence spectra during irradiation and comparing emission intensities relative to Cherenkov emission produced in phantoms and scintillation from small plastic targets. HN treatment plans were delivered to a phantom with bolus and mask present to measure impact on signal quality. Interfraction superficial tumor reduction was simulated on a HN phantom, and cumulative Cherenkov images were analyzed in the region of interest (ROI). HN human patient treatment was imaged through the mask and compared with the dose distribution calculated by the treatment planning system. The relative intensity of radioluminescence from the mask was found to be within 30% of the Cherenkov emission intensity from tissue-colored clay. A strong linear relationship between normalized cumulative Cherenkov intensity and tumor size was established ([Formula: see text]). The presence of a mask above a scintillator ROI was found to decrease mean pixel intensity by >40% and increase distribution spread. Cherenkov imaging through mask material is shown to have potential for surface field verification and tracking of superficial anatomy changes between treatment fractions. Imaging of scintillating targets provides a direct imaging of surface dose on the patient and through transparent bolus material. The first imaging of a patient receiving HN radiotherapy was achieved with a signal map which qualitatively matches the surface dose plan.
Conflict of interest statement
Conflict of Interest / Disclosure:
B Pogue is the president and co-founder of DoseOptics LLC, manufacturing the C-Dose camera provided for this research. P Bruza is the principal investigator in SBIR subaward B02463 (prime award NCI R44CA199681, DoseOptics LLC).
Figures
References
-
- Zeidan Omar A., et al. “Evaluation of image-guidance protocols in the treatment of head and neck cancers.” International Journal of Radiation Oncology* Biology* Physics 67.3 (2007): 670–677. - PubMed
-
- Gros Sébastien AA, et al. “A novel surrogate to identify anatomical changes during radiotherapy of head and neck cancer patients.” Medical physics 44.3 (2017): 924–934. - PubMed
-
- Jr Barker, Jerry L, et al. “Quantification of volumetric and geometric changes occurring during fractionated radiotherapy for head-and-neck cancer using an integrated CT/linear accelerator system.” International Journal of Radiation Oncology* Biology* Physics 59.4 (2004): 960–970. - PubMed
-
- Juloori Aditya, et al. “Adaptive radiation therapy for head and neck cancer.” Applied Radiat Oncol 4.3 (2015): 12–17.
Publication types
MeSH terms
Grants and funding
LinkOut - more resources
Full Text Sources
Medical