. 2019 Jul 9;140(2):147-163.
doi: 10.1161/CIRCULATIONAHA.118.038362. Epub 2019 May 31.

Single-Cell Analysis of the Normal Mouse Aorta Reveals Functionally Distinct Endothelial Cell Populations

Affiliations

Single-Cell Analysis of the Normal Mouse Aorta Reveals Functionally Distinct Endothelial Cell Populations

Aditya S Kalluri et al. Circulation. .

Abstract

Background: The cells that form the arterial wall contribute to multiple vascular diseases. The extent of cellular heterogeneity within these populations has not been fully characterized. Recent advances in single-cell RNA-sequencing make it possible to identify and characterize cellular subpopulations.

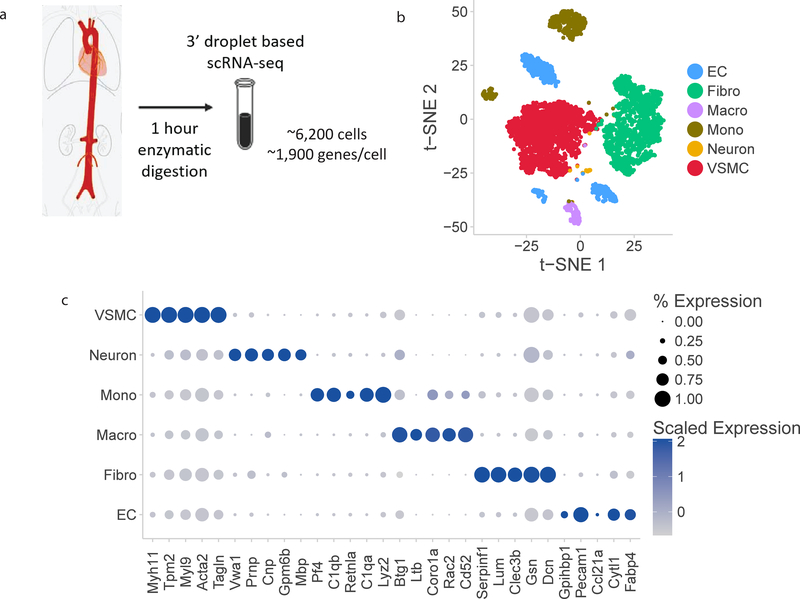
Methods: We validate a method for generating a droplet-based single-cell atlas of gene expression in a normal blood vessel. Enzymatic dissociation of 4 whole mouse aortas was followed by single-cell sequencing of >10 000 cells.

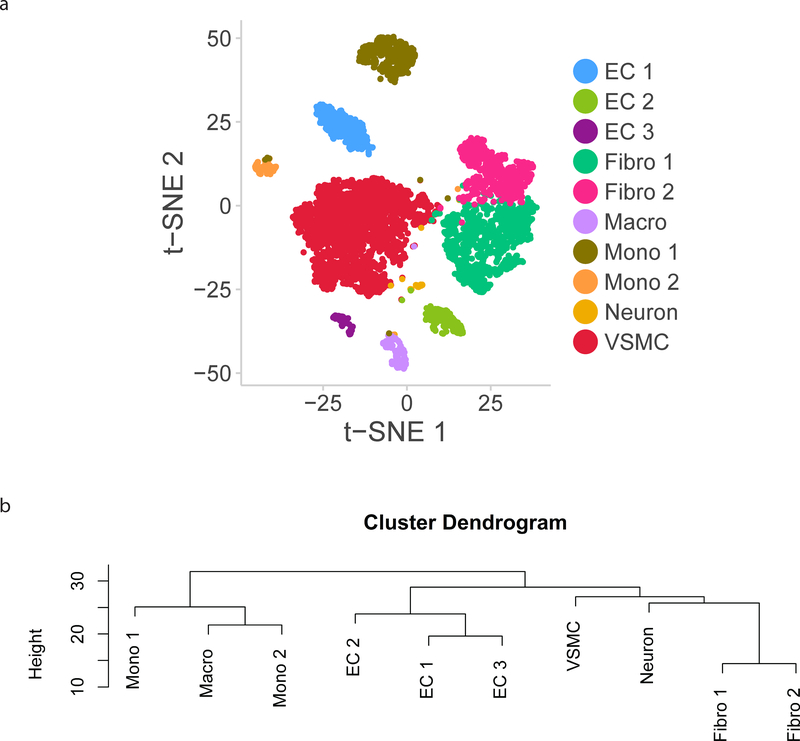
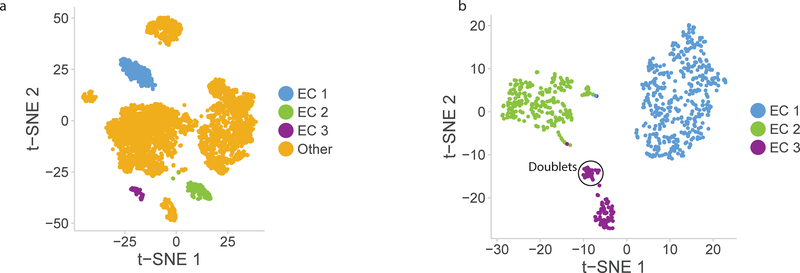
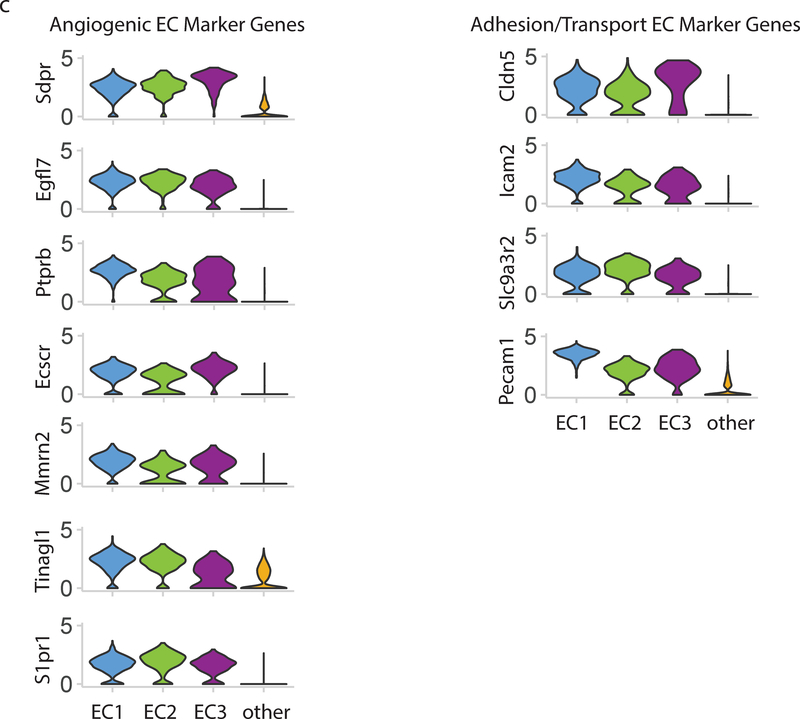
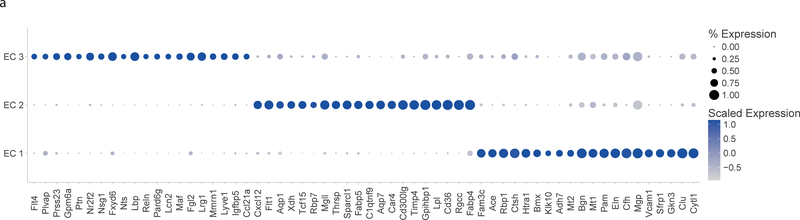
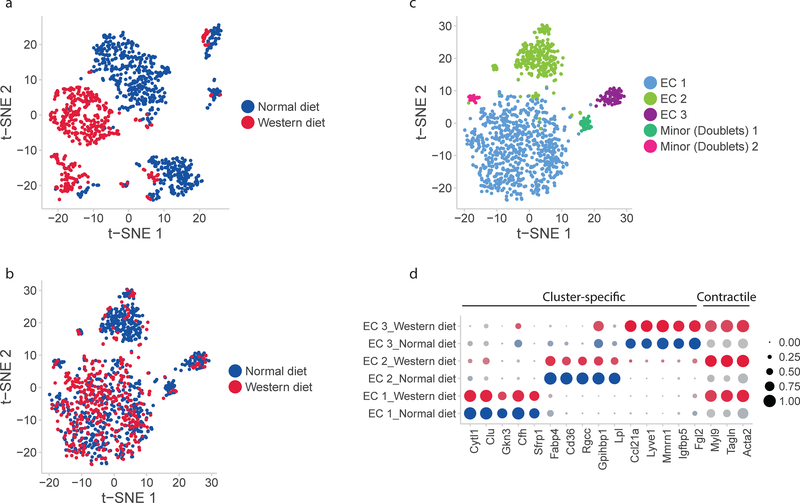
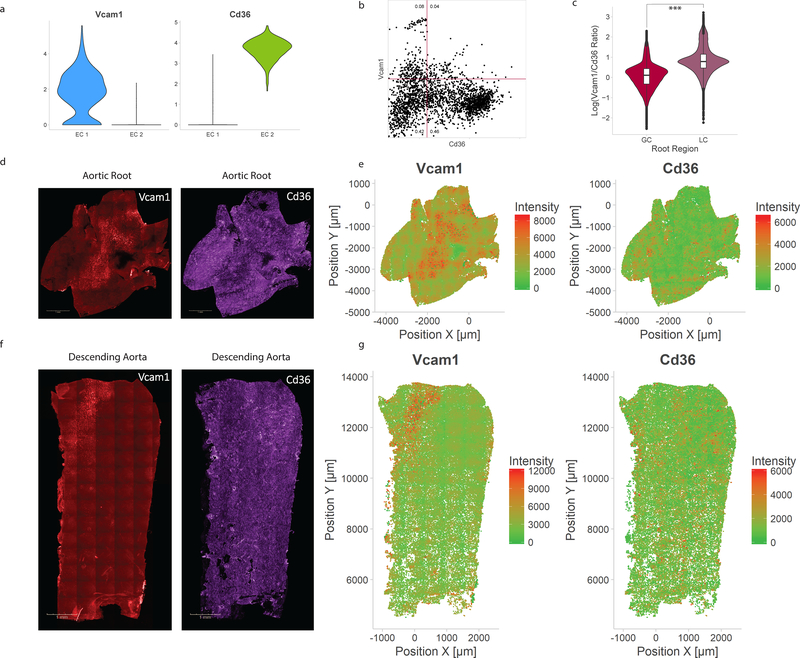
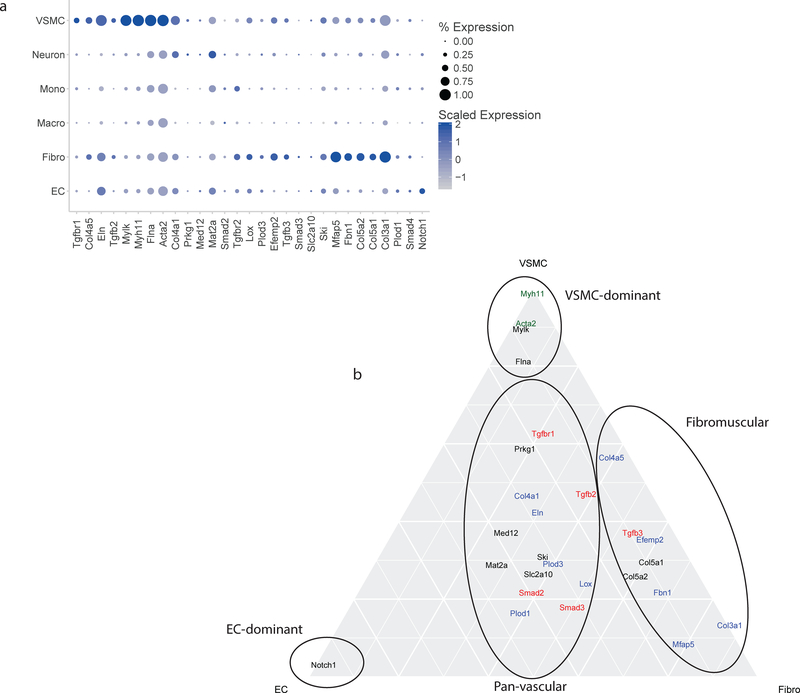
Results: Clustering analysis of gene expression from aortic cells identified 10 populations of cells representing each of the main arterial cell types: fibroblasts, vascular smooth muscle cells, endothelial cells (ECs), and immune cells, including monocytes, macrophages, and lymphocytes. The most significant cellular heterogeneity was seen in the 3 distinct EC populations. Gene set enrichment analysis of these EC subpopulations identified a lymphatic EC cluster and 2 other populations more specialized in lipoprotein handling, angiogenesis, and extracellular matrix production. These subpopulations persist and exhibit similar changes in gene expression in response to a Western diet. Immunofluorescence for Vcam1 and Cd36 demonstrates regional heterogeneity in EC populations throughout the aorta.

Conclusions: We present a comprehensive single-cell atlas of all cells in the aorta. By integrating expression from >1900 genes per cell, we are better able to characterize cellular heterogeneity compared with conventional approaches. Gene expression signatures identify cell subpopulations with vascular disease-relevant functions.

Keywords: aortic diseases; biology; endothelial cells; sequence analysis, RNA; transcriptome.


Figures

Figure 1:
Figure 1:
Single cell RNA-sequencing atlas of aortic cells types. a) Schematic overview of experimental approach. Four mouse aortas were dissected from aortic root to femoral take-off, enzymatically dissociated for 1 hour at 37ºC, and then the single cell suspension was sequenced at a depth of 1,900 median genes per cell using droplet-based RNA-sequencing methods. b) t-SNE representation of single cell gene expression shows the 7 identified major aortic cell types. c) Dotplot demonstrates the top markers of each aortic cell type. Dot size corresponds to proportion of cells within the group expressing each transcript and dot color corresponds to expression level. d) Heatmap identifying all genes with log fold change>2 for each aortic cell type relative to all other cells. EC indicates endothelial cells; Fibro, fibroblasts; Macro, macrophages; Mono, monocytes; VSMC, vascular smooth muscle cells.
Figure 1:
Figure 1:
Single cell RNA-sequencing atlas of aortic cells types. a) Schematic overview of experimental approach. Four mouse aortas were dissected from aortic root to femoral take-off, enzymatically dissociated for 1 hour at 37ºC, and then the single cell suspension was sequenced at a depth of 1,900 median genes per cell using droplet-based RNA-sequencing methods. b) t-SNE representation of single cell gene expression shows the 7 identified major aortic cell types. c) Dotplot demonstrates the top markers of each aortic cell type. Dot size corresponds to proportion of cells within the group expressing each transcript and dot color corresponds to expression level. d) Heatmap identifying all genes with log fold change>2 for each aortic cell type relative to all other cells. EC indicates endothelial cells; Fibro, fibroblasts; Macro, macrophages; Mono, monocytes; VSMC, vascular smooth muscle cells.
Figure 2:
Figure 2:
Subpopulations within cell types identified from single cell RNA-sequencing. a) t-SNE demonstrating 12 clusters identified as comprising the aorta. b) Dendrogram summarizing similarity between aortic cell subpopulations. c) Heatmap identifying markers of each cellular subpopulation. EC indicates endothelial cells; Fibro, fibroblasts; Macro, macrophages; Mono, monocytes; VSMC, vascular smooth muscle cells.
Figure 2:
Figure 2:
Subpopulations within cell types identified from single cell RNA-sequencing. a) t-SNE demonstrating 12 clusters identified as comprising the aorta. b) Dendrogram summarizing similarity between aortic cell subpopulations. c) Heatmap identifying markers of each cellular subpopulation. EC indicates endothelial cells; Fibro, fibroblasts; Macro, macrophages; Mono, monocytes; VSMC, vascular smooth muscle cells.
Figure 3:
Figure 3:
Endothelial cells cluster into 3 distinct populations. a) t-SNE plot of EC subpopulations highlighted relative to other aortic cell types. The three EC subpopulations have distinct transcriptional profiles compared with each other and with all other aortic cells. b) t-SNE plot of all VE-Cadherin positive cells in mouse aorta. EC subpopulations were extracted from whole aorta data, and separately analyzed. In this t-SNE plot the 3 subpopulations are re-identified along with a small (5%) population of doublet cells which are an artifact of droplet-based single cell RNA-sequencing. c) Multiple genes show EC-specific expression and are expressed in all 3 EC subpopulations. Genetic markers expressed in all EC clusters compared with all other cells are divided into angiogenic EC marker genes and adhesion/transport EC marker genes. Violin plot y-axis demonstrates normalized transcript expression values.
Figure 3:
Figure 3:
Endothelial cells cluster into 3 distinct populations. a) t-SNE plot of EC subpopulations highlighted relative to other aortic cell types. The three EC subpopulations have distinct transcriptional profiles compared with each other and with all other aortic cells. b) t-SNE plot of all VE-Cadherin positive cells in mouse aorta. EC subpopulations were extracted from whole aorta data, and separately analyzed. In this t-SNE plot the 3 subpopulations are re-identified along with a small (5%) population of doublet cells which are an artifact of droplet-based single cell RNA-sequencing. c) Multiple genes show EC-specific expression and are expressed in all 3 EC subpopulations. Genetic markers expressed in all EC clusters compared with all other cells are divided into angiogenic EC marker genes and adhesion/transport EC marker genes. Violin plot y-axis demonstrates normalized transcript expression values.
Figure 4:
Figure 4:
Gene expression signatures of EC subpopulations. a) Top 20 genes with specific expression for each EC subpopulation. Dot plot shows the percentage of cells expressing each gene (dot size) and the expression level (dot color). b) Differential expression of transcription factors by EC subpopulation. c) Expression of PPAR-G targets in EC 1 and EC 2 subpopulations. *** indicates Mann-Whitney U-test p-value < 0.001.
Figure 4:
Figure 4:
Gene expression signatures of EC subpopulations. a) Top 20 genes with specific expression for each EC subpopulation. Dot plot shows the percentage of cells expressing each gene (dot size) and the expression level (dot color). b) Differential expression of transcription factors by EC subpopulation. c) Expression of PPAR-G targets in EC 1 and EC 2 subpopulations. *** indicates Mann-Whitney U-test p-value < 0.001.
Figure 5:
Figure 5:
Pathway analysis of EC subpopulations. a) GO-annotated EC development and differentiation gene set scores in endothelial subpopulations and non-endothelial aortic cells (Other). b) Functional gene sets identified from Reactome pathway enrichment and subpopulation markers differentiate the two major EC populations EC 1 and EC 2. *** indicates Mann-Whitney U-test p-value < 0.001. c) Angiogenic tip cell gene set score differentiates EC 1 and EC 2. *** indicates Mann-Whitney U-test p-value < 0.001.
Figure 6:
Figure 6:
Conserved and diet-dependent markers of EC subpopulations. a) Unaligned normal- and Western diet EC scRNAseq profiles represented in a PCA-based space with t-SNE. b) Aligned normal- and Western diet scRNAseq profiles represented with CCA and t-SNE. c) Conserved subpopulations of ECs identified in both datasets. d) Conserved diet-independent markers of EC subpopulation and pan-subpopulation markers of diet-induced change. Diet-independent subpopulation markers are the same as those identified previously while Western diet induces contractile proteins Myl9, Tagln, and Acta2 in all EC subpopulations.
Figure 7:
Figure 7:
Histological correlates of identified EC subpopulations. a) Violin plot comparison of Vcam1, an EC 1-associated marker, and Cd36, an EC 2-associated marker. b) Flow cytometry of mouse aortic endothelial cells demonstrating heterogeneity corresponding to subpopulation markers, with both Vcam1+/Cd36 and Vcam1/Cd36+ populations. Numbers indicate fraction of cells in each quadrant. c) Quantification of log-transformed Vcam1/Cd36 ratio in greater (GC) and lesser (LC) curvatures of aortic root. *** indicates Mann-Whitney U-test p-value < 0.001. d) Representative immunofluorescence microscopy images for Vcam1 and Cd36 in the aortic root. e) Quantification of Vcam1 fluorescence intensity and Cd36 fluorescence intensity in the aortic root. f) Representative immunofluorescence microscopy images for Vcam1 and Cd36 in the descending aorta. g) Quantification of Vcam1 fluorescence intensity and Cd36 fluorescence intensity in the descending aorta.
Figure 8:
Figure 8:
Expression of aortopathy genes by cell identity. a) Expression of thirty genes associated with Mendelian aortopathy by cell type. The majority of these genes have highest expression in VSMCs. Several show highest expression in fibroblasts. Two genes (Mat2a and Notch1) have highest expression in ECs. b) Ternary plot to show expression of aortopathy genes in ECs, VSMCs, and fibroblasts. Several genes are exclusively expressed in VSMCs, while the majority show expression predominantly in VSMCs and fibroblasts. Genes with contractile function are in green, TFGb response genes are in red, ECM-related genes are in blue, and unassigned genes are in black. EC indicates endothelial cells; Fibro, fibroblasts; VSMC, vascular smooth muscle cells.

Similar articles

Cited by

References

    1. Cines DB, Pollak ES, Buck CA, Loscalzo J, Zimmerman GA, McEver RP, Pober JS, Wick TM, Konkle BA, Schwartz BS, Barnathan ES, McCrae KR, Hug BA, Schmidt AM, Stern DM. Endothelial cells in physiology and in the pathophysiology of vascular disorders. Blood. 1998;91:3527–3561. - PubMed
    1. Owens GK, Kumar MS, Wamhoff BR. Molecular regulation of vascular smooth muscle cell differentiation in development and disease. Physiol Rev. 2004;84:767–801. - PubMed
    1. Aird WC. Endothelial cell heterogeneity. Cold Spring Harb Perspect Med. 2012;2:a006429. - PMC - PubMed
    1. Macosko EZ, Basu A, Satija R, Nemesh J, Shekhar K, Goldman M, Tirosh I, Bialas AR, Kamitaki N, Martersteck EM, Trombetta JJ, Weitz DA, Sanes JR, Shalek AK, Regev A, McCarroll SA. Highly Parallel Genome-wide Expression Profiling of Individual Cells Using Nanoliter Droplets. Cell. 2015;161:1202–1214. - PMC - PubMed
    1. Butler A, Hoffman P, Smibert P, Papalexi E, Satija R. Integrating single-cell transcriptomic data across different conditions, technologies, and species. Nat Biotech. 2018;36:411–420. - PMC - PubMed

Publication types