

doi: 10.1073/pnas.1900192116.
Epub 2019 May 30.
Segregation through the multiscalar lens
Affiliations
- PMID: 31147462
- PMCID: PMC6589646
- DOI: 10.1073/pnas.1900192116
Item in Clipboard
Segregation through the multiscalar lens
Proc Natl Acad Sci U S A.
.
Abstract
We introduce a mathematical framework that allows one to carry out multiscalar and multigroup spatial exploratory analysis across urban regions. By producing coefficients that integrate information across all scales and that are normalized with respect to theoretical maximally segregated configurations, this framework provides a practical and powerful tool for the comparative empirical analysis of urban segregation. We illustrate our method with a study of ethnic mixing in the Los Angeles metropolitan area.
Keywords: multiscalar analysis; segregation; spatial statistics.
Conflict of interest statement
The authors declare no conflict of interest.
Figures
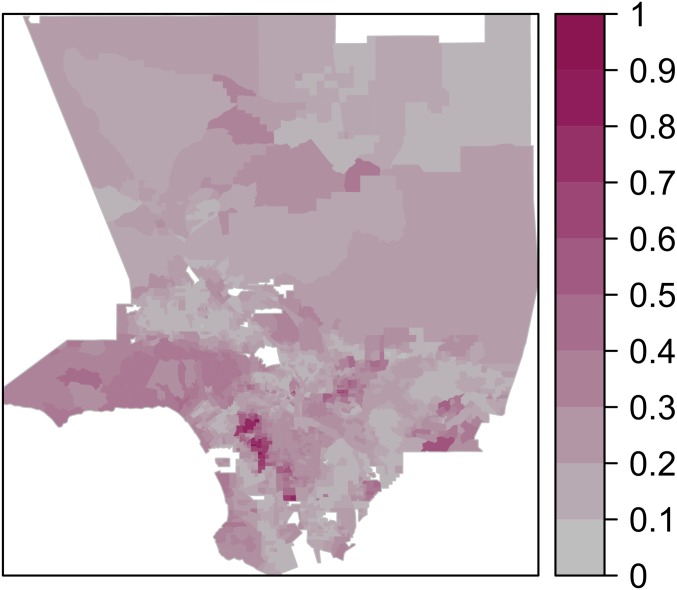
A map of the Los Angeles area with tracts colored according to the KL divergence between their ethnic composition and that of the whole region. Darker colors represent greater divergence. Values have been normalized by their maximum, so that they scale from 0 to 1. (Four ethnic groups are considered: Whites, Hispanics, Asians, and Blacks. Data are from the 2010 US Census.)
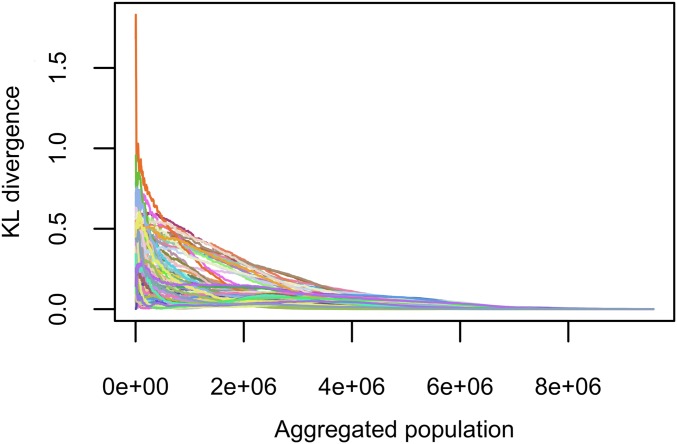
Trajectories for KL divergence, starting from some (10%) of the tracts in the Los Angeles area. Abscissae are expressed in terms of the aggregated population around the starting point. All trajectories converge to 0, but some do so quickly, while others reach 0 only at much larger scales.
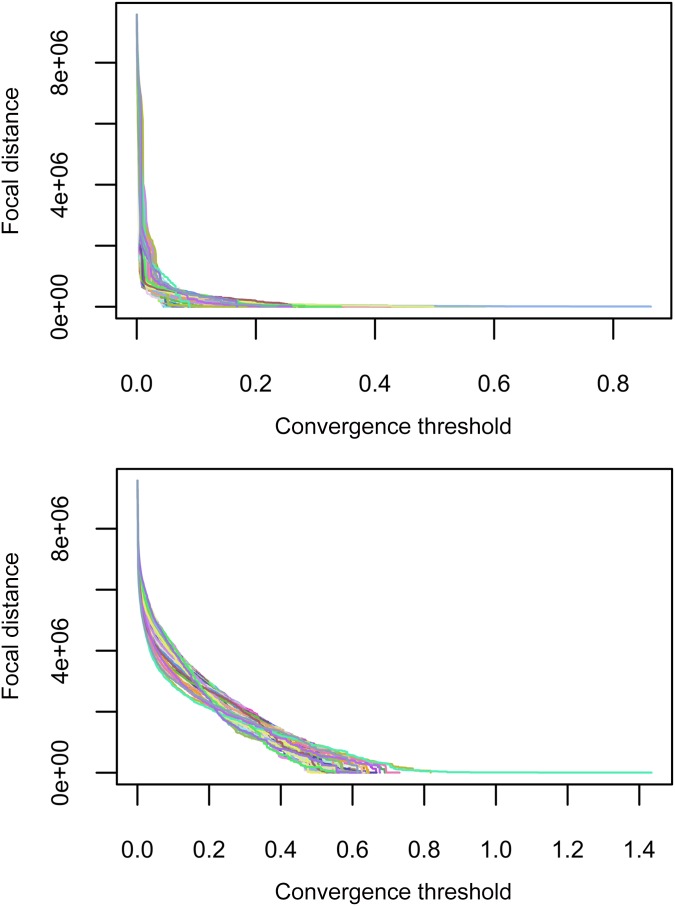
Focal distance curves, starting from some of the tracts in the Los Angeles area. Ordinates are focal distances expressed in terms of the aggregated population around the starting point. They represent aggregation sizes at which the corresponding KL trajectories (Fig. 2) converge, for each value of the convergence threshold . We give exemplars of two types of behavior. (Upper) Sharply decreasing curves correspond to points with short focal distances, even for small values of . (Lower) Slower-decreasing curves correspond to points with long focal distances, even for larger values of . The distortion coefficient at a given point in the city is then defined (Eq. 4) to be proportional to the area under the corresponding focal distance curve: The higher the curve, the larger the coefficient.
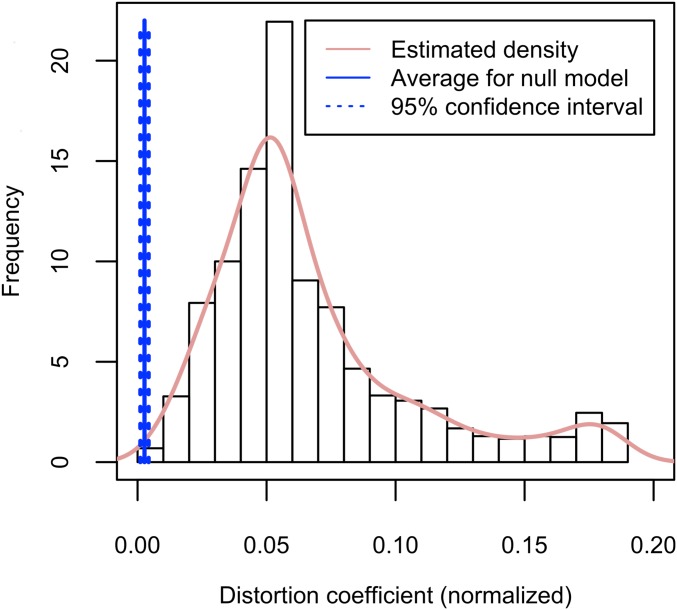
Histogram and estimated density (pink solid line) of normalized distortion coefficients in Los Angeles area. The solid blue vertical line corresponds to the average value of distortion coefficients in a null model obtained by random (spatial) permutations. The dashed line indicates a 95% confidence interval around the average in the null model.
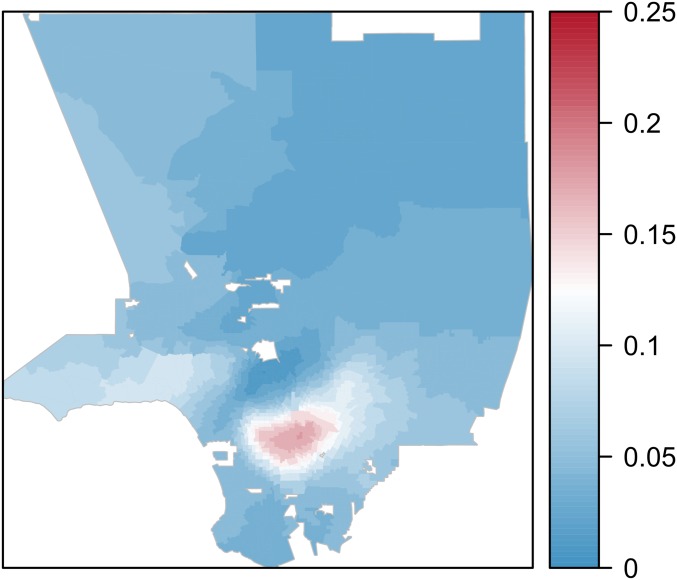
A map of the Los Angeles area with tracts colored according to their distortion coefficients for the ethnic composition of the population.
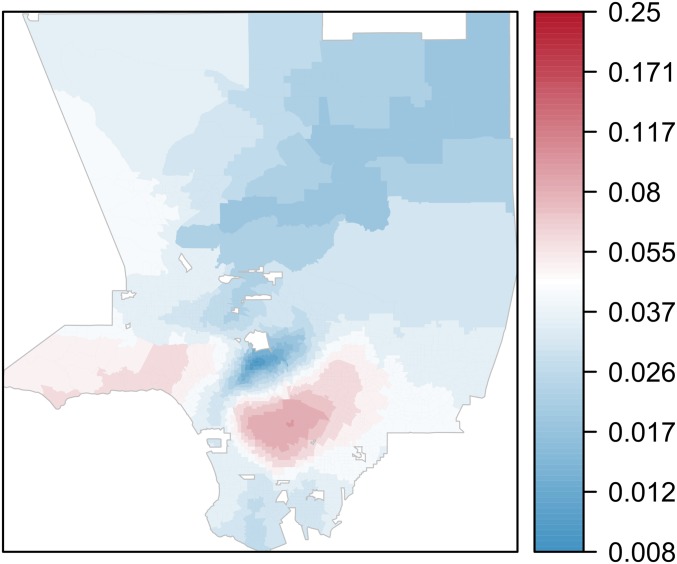
Same as Fig. 5 but with a logarithmic color scale, allowing one to see finer details in the variation of distortion coefficients across space.
Comment in
-
Communicating racial segregation: Abstract versus concrete.Proc Natl Acad Sci U S A. 2019 Nov 5;116(45):22435-22436. doi: 10.1073/pnas.1912395116. Epub 2019 Oct 15. Proc Natl Acad Sci U S A. 2019. PMID: 31615883 Free PMC article. No abstract available.
-
Reply to Stepinski and Dmowska: Segregation beyond scale and across space: Arbitrary versus objective analysis.Proc Natl Acad Sci U S A. 2019 Nov 5;116(45):22437. doi: 10.1073/pnas.1914910116. Epub 2019 Oct 15. Proc Natl Acad Sci U S A. 2019. PMID: 31615884 Free PMC article. No abstract available.
References
-
- Cowgill D. O., Cowgill M. S., An index of segregation based on block statistics. Am. Sociol. Rev. 16, 825–831 (1951).
-
- Duncan O. D., Duncan B., A methodological analysis of segregation indexes. Am. Sociol. Rev. 20, 210–217 (1955).
-
- Farley R., Taeuber K. E., Population trends and residential segregation since 1960. Science 159, 953–956 (1968). - PubMed
-
- Cortese C. F., Falk R. F., Cohen J. K., Further considerations on the methodological analysis of segregation indices. Am. Sociol. Rev. 41, 630–637, (1976).
-
- White M. J., The measurement of spatial segregation. Am. J. Sociol. 88, 1008–1018 (1983).
LinkOut - more resources
Full Text Sources
