

Oligogenic inheritance of a human heart disease involving a genetic modifier
- PMID: 31147515
- PMCID: PMC6557373
- DOI: 10.1126/science.aat5056
Oligogenic inheritance of a human heart disease involving a genetic modifier
Abstract
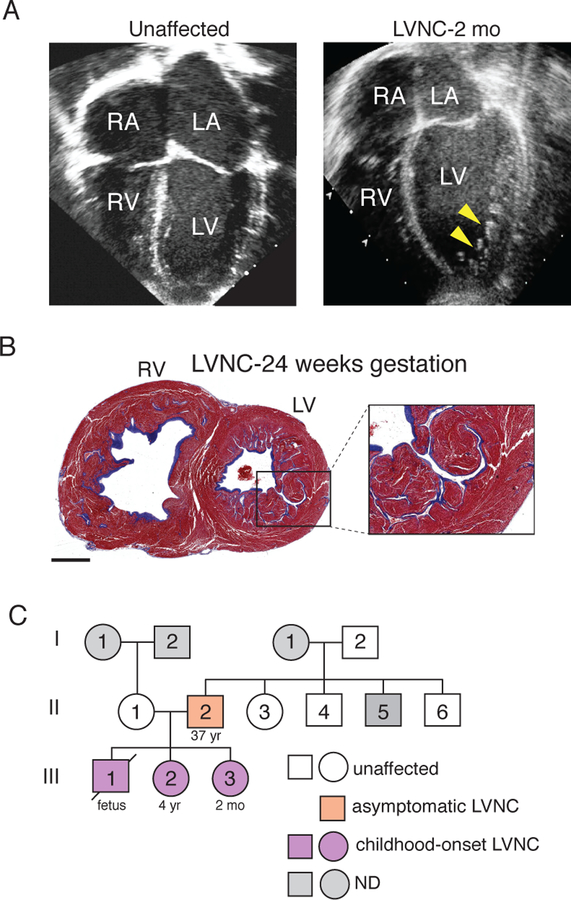
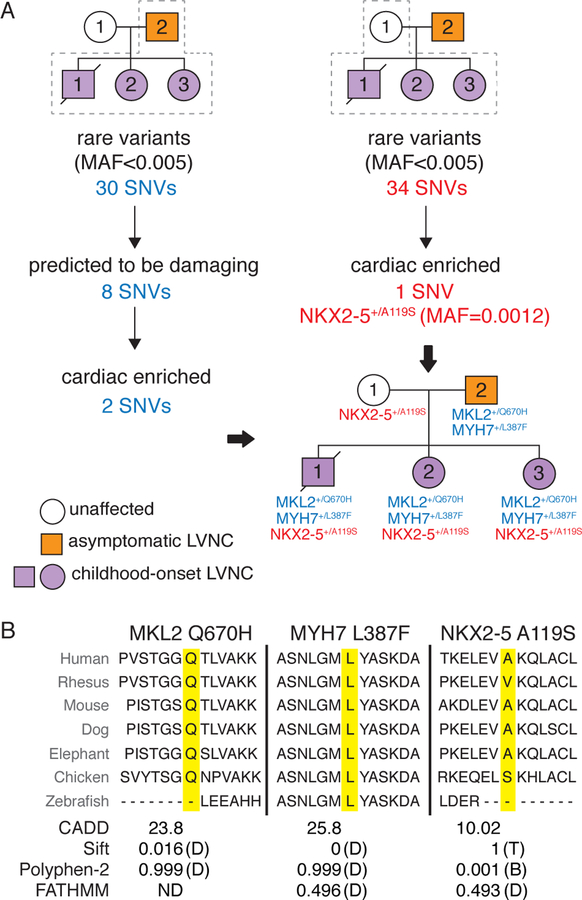
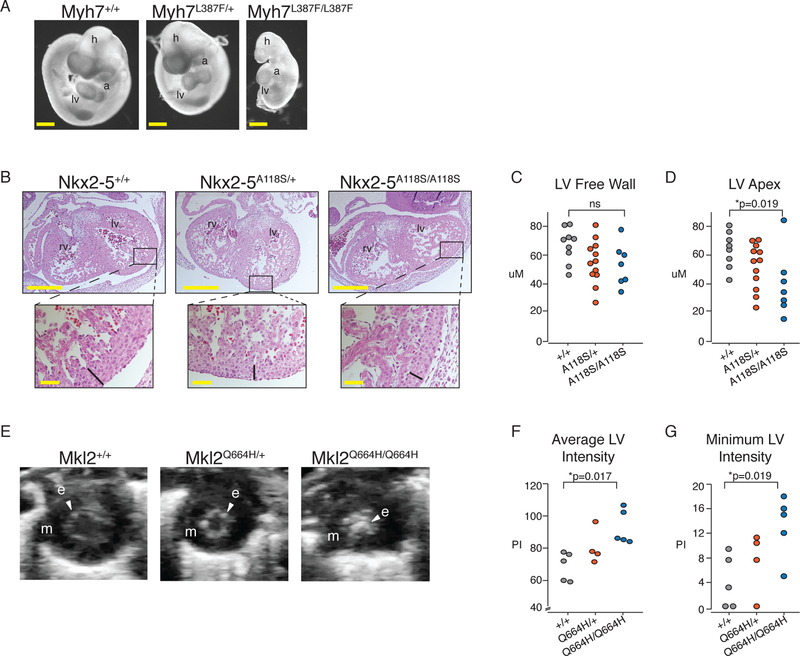
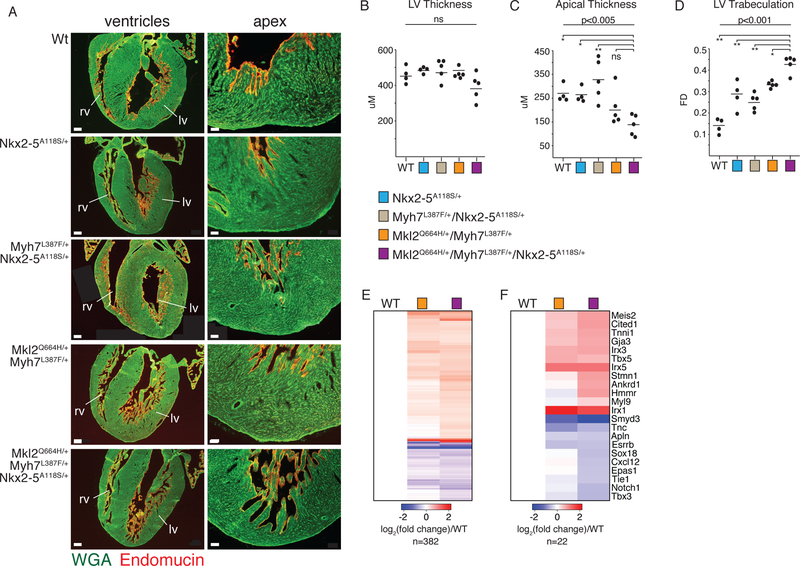
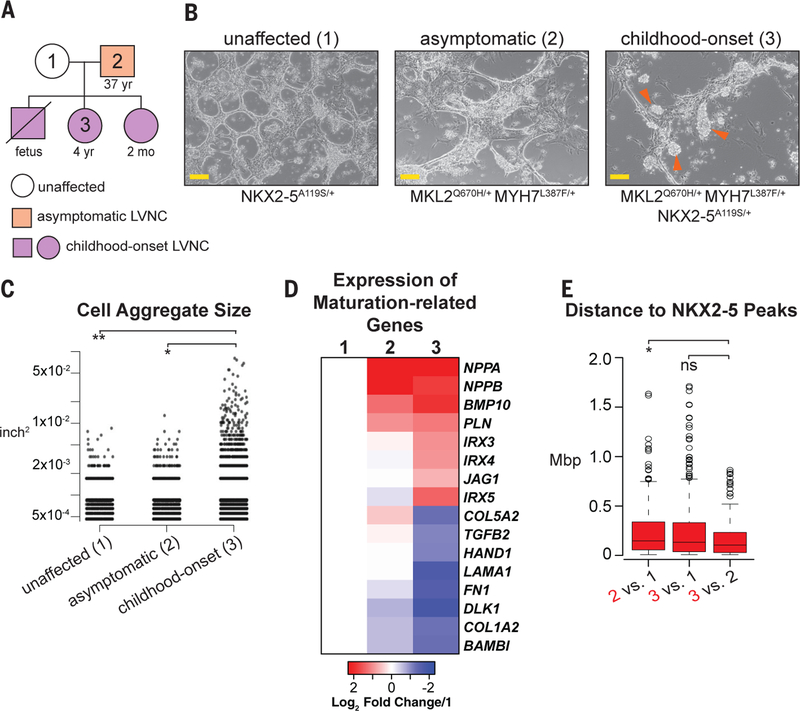
Complex genetic mechanisms are thought to underlie many human diseases, yet experimental proof of this model has been elusive. Here, we show that a human cardiac anomaly can be caused by a combination of rare, inherited heterozygous mutations. Whole-exome sequencing of a nuclear family revealed that three offspring with childhood-onset cardiomyopathy had inherited three missense single-nucleotide variants in the MKL2, MYH7, and NKX2-5 genes. The MYH7 and MKL2 variants were inherited from the affected, asymptomatic father and the rare NKX2-5 variant (minor allele frequency, 0.0012) from the unaffected mother. We used CRISPR-Cas9 to generate mice encoding the orthologous variants and found that compound heterozygosity for all three variants recapitulated the human disease phenotype. Analysis of murine hearts and human induced pluripotent stem cell-derived cardiomyocytes provided histologic and molecular evidence for the NKX2-5 variant's contribution as a genetic modifier.
Copyright © 2019 The Authors, some rights reserved; exclusive licensee American Association for the Advancement of Science. No claim to original U.S. Government Works.
Conflict of interest statement
Figures
Similar articles
-
Determining the Pathogenicity of a Genomic Variant of Uncertain Significance Using CRISPR/Cas9 and Human-Induced Pluripotent Stem Cells.Circulation. 2018 Dec 4;138(23):2666-2681. doi: 10.1161/CIRCULATIONAHA.117.032273. Circulation. 2018. PMID: 29914921 Free PMC article.
-
Biallelic mutation in MYH7 and MYBPC3 leads to severe cardiomyopathy with left ventricular noncompaction phenotype.Hum Mutat. 2019 Aug;40(8):1101-1114. doi: 10.1002/humu.23757. Epub 2019 Apr 24. Hum Mutat. 2019. PMID: 30924982
-
A Human Hereditary Cardiomyopathy Shares a Genetic Substrate With Bicuspid Aortic Valve.Circulation. 2023 Jan 3;147(1):47-65. doi: 10.1161/CIRCULATIONAHA.121.058767. Epub 2022 Nov 3. Circulation. 2023. PMID: 36325906
-
MYH7 in cardiomyopathy and skeletal muscle myopathy.Mol Cell Biochem. 2024 Feb;479(2):393-417. doi: 10.1007/s11010-023-04735-x. Epub 2023 Apr 20. Mol Cell Biochem. 2024. PMID: 37079208 Review.
-
CRISPR/Cas9 gene-editing strategies in cardiovascular cells.Cardiovasc Res. 2020 Apr 1;116(5):894-907. doi: 10.1093/cvr/cvz250. Cardiovasc Res. 2020. PMID: 31584620 Review.
Cited by
-
A Membrane-Tethered Ubiquitination Pathway Regulates Hedgehog Signaling and Heart Development.Dev Cell. 2020 Nov 23;55(4):432-449.e12. doi: 10.1016/j.devcel.2020.08.012. Epub 2020 Sep 22. Dev Cell. 2020. PMID: 32966817 Free PMC article.
-
CRISPR Modeling and Correction of Cardiovascular Disease.Circ Res. 2022 Jun 10;130(12):1827-1850. doi: 10.1161/CIRCRESAHA.122.320496. Epub 2022 Jun 9. Circ Res. 2022. PMID: 35679361 Free PMC article. Review.
-
Genetic Modifiers and Rare Mendelian Disease.Genes (Basel). 2020 Feb 25;11(3):239. doi: 10.3390/genes11030239. Genes (Basel). 2020. PMID: 32106447 Free PMC article. Review.
-
Potential digenic inheritance of familial hypertrophic cardiomyopathy identified by whole-exome sequencing.Mol Genet Genomic Med. 2020 Mar;8(3):e1150. doi: 10.1002/mgg3.1150. Epub 2020 Jan 20. Mol Genet Genomic Med. 2020. PMID: 31960626 Free PMC article.
-
Endocardial/endothelial angiocrines regulate cardiomyocyte development and maturation and induce features of ventricular non-compaction.Eur Heart J. 2021 Nov 1;42(41):4264-4276. doi: 10.1093/eurheartj/ehab298. Eur Heart J. 2021. PMID: 34279605 Free PMC article.
References
-
- Kilpinen H, Dermitzakis ET, Hum. Mol. Genet 21, R24–R28 (2012). - PubMed
Publication types
MeSH terms
Substances
Grants and funding
LinkOut - more resources
Full Text Sources
Other Literature Sources
Medical
Molecular Biology Databases
