. 2019 Jul 31;39(31):6150-6161.
doi: 10.1523/JNEUROSCI.2767-18.2019. Epub 2019 May 30.

Neuronal Encoding in a High-Level Auditory Area: From Sequential Order of Elements to Grammatical Structure

Affiliations

Neuronal Encoding in a High-Level Auditory Area: From Sequential Order of Elements to Grammatical Structure

Aurore Cazala et al. J Neurosci. .

Abstract

Sensitivity to the sequential structure of communication sounds is fundamental not only for language comprehension in humans but also for song recognition in songbirds. By quantifying single-unit responses, we first assessed whether the sequential order of song elements, called syllables, in conspecific songs is encoded in a secondary auditory cortex-like region of the zebra finch brain. Based on a habituation/dishabituation paradigm, we show that, after multiple repetitions of the same conspecific song, rearranging syllable order reinstated strong responses. A large proportion of neurons showed sensitivity to song context in which syllables occurred providing support for the nonlinear processing of syllable sequences. Sensitivity to the temporal order of items within a sequence should enable learning its underlying structure, an ability considered a core mechanism of the human language faculty. We show that repetitions of songs that were ordered according to a specific grammatical structure (i.e., ABAB or AABB structures; A and B denoting song syllables) led to different responses in both anesthetized and awake birds. Once responses were decreased due to song repetitions, the transition from one structure to the other could affect the firing rates and/or the spike patterns. Our results suggest that detection was based on local differences rather than encoding of the global song structure as a whole. Our study demonstrates that a high-level auditory region provides neuronal mechanisms to help discriminate stimuli that differ in their sequential structure.SIGNIFICANCE STATEMENT Sequence processing has been proposed as a potential precursor of language syntax. As a sequencing operation, the encoding of the temporal order of items within a sequence may help in recognition of relationships between adjacent items and in learning the underlying structure. Taking advantage of the stimulus-specific adaptation phenomenon observed in a high-level auditory region of the zebra finch brain, we addressed this question at the neuronal level. Reordering elements within conspecific songs reinstated robust responses. Neurons also detected changes in the structure of artificial songs, and this detection depended on local transitions between adjacent or nonadjacent syllables. These findings establish the songbird as a model system for deciphering the mechanisms underlying sequence processing at the single-cell level.

Keywords: artificial grammar; auditory perception; multielectrode; sequence; songbirds.


Figures

Figure 1.
Figure 1.
Schematic diagram of the series of songs used as stimuli. Except the Song-Id series, which consisted of 60 song iterations, the three other series consisted of 50 song iterations followed by 10 iterations of the same song in which syllables were reordered (Song-Diff series) or organized into a different structure (AABB-ABAB and ABAB-AABB series). Sets of two series were used: A, a Song-Id and its respective Song-Diff series built from the same syllables; B, an AABB-ABAB and an ABAB-AABB series built from distinct syllables.
Figure 2.
Figure 2.
Two distinct cell types in NCM: BS and NS cells. A, Spontaneous FR (spike/s) of the populations of BS and NS neurons. Error bar indicates mean ± SD. B, Representative example of spike clustering that distinguishes a BS (green) from an NS neuron (blue). C, Example of a spike waveform of these two neurons.
Figure 3.
Figure 3.
From one cell to another, song-driven spiking events can occur at different times during the presentation of a song stimulus. Neuronal responses of 5 BS and 5 NS cells are shown as raster plots (first 10 iterations). Top, The spectrogram of the song. BS neurons (A) produced more precise spike trains than NS neurons (B). Songs consisted of five distinct syllables (called from A to E). All the syllables of a given song can potentially elicit changes in spiking activity.
Figure 4.
Figure 4.
Reordering the syllables within a conspecific song affects the modulation of single-unit responses. Responses (Z score values) of the whole population of cells (A), the subset of NS cells (B), and the subset of BS cells (C) to repeated songs of either the Song-Diff (orange lines) or the Song-Id (green lines) series. Z score values were calculated per block of 10 song iterations. Changes in syllable order occurred at the beginning of the sixth block of the Song-Diff series. Thick line indicates mean. Shaded area represents SEM. *p < 0.05. D, Responses of a representative BS neuron to 50 presentations of a song consisting of five distinct syllables (ABCDE) followed by 10 presentations of the same song in which syllables are in the same order (Song-Id series) or arranged according to a new one (Song-Diff series; here BCAED). Neuronal responses are shown as raster plots (middle, 60 iterations) and peristimulus histograms (bottom) that are time-aligned with song spectrograms (top, the song repeated 50 times; bottom, the same song or the song with reordered syllables). Dotted lines indicate song onset.
Figure 5.
Figure 5.
Reordering song syllables affects responses of three example BS cells. A, Spiking activity was suppressed after moving the syllable A from the first to the fourth position (ABCDE: initial order of syllables; BCEAD: new order in Song-Diff series; iterations: 51–60; blue arrows). There is reinstatement of responses to the syllable B after syllable reordering (red arrows). B, Reordering song syllables suppressed responses to the syllable D (EDCBA: initial order; AECBD: new order; blue arrows) and reinstated responses to syllable E (red arrows). C, Suppression of responses to the syllable C that remained to the same position after syllable reordering (ABCDE: initial order; EDCBA: new order; blue arrows). The preceding syllables were different. Neuronal responses are shown as raster plots (middle, 60 iterations) and peristimulus histograms (bottom) that are time-aligned with the song spectrograms. Spectrograms of songs used as stimuli: Top, During the first 50 iterations. Bottom, During the 10 last ones. Dotted blue lines indicate song onset.
Figure 6.
Figure 6.
Responses of six example neurons to the playback of ABAB and AABB song stimuli. Neuronal responses are shown as raster plots (the first 10 iterations) that are time-aligned with the song spectrograms. Song-driven spiking events can occur at different times during both ABAB and AABB songs. Dotted blue lines indicate song onset. All the syllables of a given song can elicit changes in spiking activity.
Figure 7.
Figure 7.
Responses driven by ABAB and AABB song stimuli in anesthetized birds. Responses (Z score values) of the whole population of cells (A), the subset of NS cells (B), and the subset of BS cells (C) across the successive blocks of AABB-ABAB and ABAB-AABB series. Z score values were calculated per block of 10 song iterations. BS cells detected the transition from AABB to ABAB structure. Thick line indicates mean. Shaded area represents SEM. *p < 0.05. D, Responses of a representative BS neuron to the playback of AABB and ABAB songs. Neuronal responses are shown as raster plots (middle, 60 iterations) and peristimulus histograms (bottom) that are time-aligned with song spectrograms. Spectrograms of songs used as stimuli: Top, During the first 50 iterations. Bottom, During the 10 last ones. Dotted blue lines indicate song onset. There is an increase in the response to the first syllable B (red arrow) when song structure changed from AABB to ABAB.
Figure 8.
Figure 8.
Responses driven by ABAB and AABB song stimuli in awake birds. A, Changes in multiunit activity across the successive blocks of AABB-ABAB (blue line) and ABAB-AABB (red line) series. A third series, the ABAB-ABAB series (purple line), was also played back. Thick line indicates mean. Shaded area represents SEM. B, Responses of a representative single unit (BS neuron) to the two structured songs. There is a reset in responses when the song structure changed from AABB to ABAB. Neuronal responses are shown as raster plots (middle, 60 iterations) and peristimulus histograms (bottom) that are time-aligned with song spectrograms (top). Spectrograms of songs used as stimuli: Top, During the first 50 iterations. Bottom, During the 10 last ones. Dotted blue lines indicate song onset. FR was averaged over the stimulus duration.
Figure 9.
Figure 9.
Variations in syllable-evoked FRs during song playbacks depend on song structure. In both anesthetized (A) and awake conditions (B), responses of the whole population of cells to the four song syllables of AABB (blue line) and ABAB (red line) songs. Thick line indicates mean. Shaded area represents SEM. Data collected before (blocks 1 and 5) and after (block 6) changes in song structure. There is a significant difference in response to the first syllable A between AABB and ABAB songs during blocks 1 and 5 (black *p < 0.001) and the lack of this difference during block 6. Responses of NS (C) and BS (D) cells during blocks 5 and 6. Responses to the central syllables A and B during block 5 (in gray) are artificially permuted. Responses to AABB and ABAB songs are represented by blue and red, respectively. *p < 0.05, for the corresponding song structure (blue and red * for AABB and ABAB songs, respectively).
Figure 10.
Figure 10.
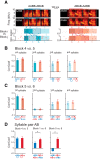
Effects of changes in song structure on temporal reliability of spike trains. A, Neuronal responses during two blocks of 10 song iterations are shown as raster plots that are time-aligned with song spectrograms. The CorrCoef index was computed by comparing the precise timing of spike trains between two blocks (i vs j) of song presentations (e.g., between iterations 1 to 10 of block i vs iterations 1 to 10 of block j). Computations were performed on spike trains elicited by individual syllables (AABB-ABAB and ABAB-AABB series: blue and red shaded areas on raster plots, respectively) or by the syllable pair AB that included the first syllable B (blue and red rectangles on raster plots). White dotted lines on spectrograms indicate individual syllables. Arrows above and below raster plots indicate the serial position of syllables before and after song transition, respectively. B, CorrCoef values (mean ± SEM) for spike trains elicited by each of the four song syllables (in bold below histograms) of the AABB (in blue) and the ABAB (in red) songs during blocks 4 and 5. C, CorrCoef values for spike trains elicited by the same syllable (in bold below histograms) before (block 5) and after (block 6) changes in song structure. Arrows below histograms indicate the serial position of the syllable within the song before and after song transition. Moving the syllable from the second to the third position affected the temporal reliability of responses driven by this syllable. D, CorrCoef values for spike trains elicited by the syllable pair AB (in bold below histograms) during two blocks (4 and 5; 5 and 6; 1 and 6). *p < 0.05.
Figure 11.
Figure 11.
Hypothetical outcomes of our study. The different scenario represent the responses of the whole population of cells to the presentation of AABB-ABAB and ABAB-AABB series during blocks 1, 5, and after changes in song structure (i.e., during block 6). A, Linearity of song responses. Neurons are only sensitive to certain acoustic features, and their responses are neither modulated by repetitions nor by changes in song structure (e.g., neurons of the songbird midbrain). B–D, Nonlinearity of song responses: repetition induces a decrease in responses. B, Neurons do not encode the temporal order of syllables within songs. C, Neurons encode the global structure of the song, syllables being groups together as a “chunk.” Changing the song structure by permuting the two central syllables A and B reinstates stronger responses to all song syllables. D, Neurons encode the transitions between syllables. Changing the song structure by permuting the two central syllables A and B affects responses to these syllables. The sensitivity to local song structure is also detected in the initial responses during block 1. Responses to the first syllable B depends on the number of syllable A that precedes it. These responses are based on a set of results obtained for BS cells. NS cells did not show any changes in responses to song syllables after changes in song structure.

References

    1. Abe K, Watanabe D (2011) Songbirds possess the spontaneous ability to discriminate syntactic rules. Nat Neurosci 14:1067–1074. 10.1038/nn.2869 - DOI - PubMed
    1. Beckers GJ, Gahr M (2010) Neural processing of short-term recurrence in songbird vocal communication. PLoS One 5:e11129. 10.1371/journal.pone.0011129 - DOI - PMC - PubMed
    1. Beckers GJ, Gahr M (2012) Large-scale synchronized activity during vocal deviance detection in the zebra finch auditory forebrain. J Neurosci 32:10594–10608. 10.1523/JNEUROSCI.6045-11.2012 - DOI - PMC - PubMed
    1. Beckers GJ, Berwick RC, Okanoya K, Bolhuis JJ (2017) What do animals learn in artificial grammar studies? Neurosci Biobehav Rev 81:238–246. 10.1016/j.neubiorev.2016.12.021 - DOI - PubMed
    1. Bekinschtein TA, Dehaene S, Rohaut B, Tadel F, Cohen L, Naccache L (2009) Neural signature of the conscious processing of auditory regularities. Proc Natl Acad Sci U S A 106:1672–1677. 10.1073/pnas.0809667106 - DOI - PMC - PubMed

Publication types