. 2019 May 30;11(11):3574-3584.
doi: 10.18632/aging.101998.

TGF-β mediates aortic smooth muscle cell senescence in Marfan syndrome

Affiliations

TGF-β mediates aortic smooth muscle cell senescence in Marfan syndrome

Wei You et al. Aging (Albany NY). .

Abstract

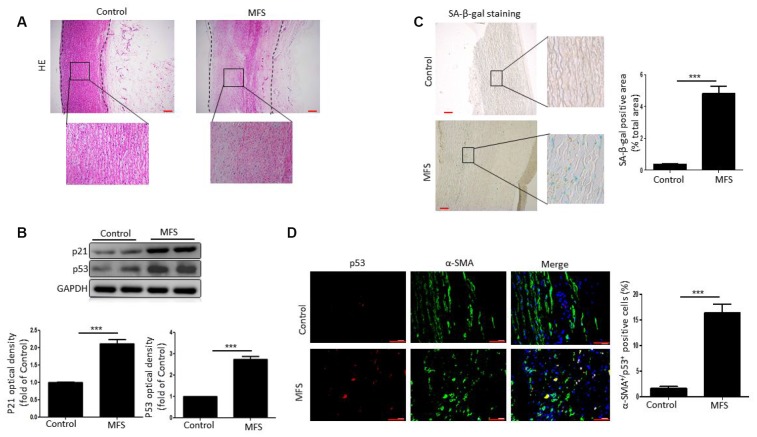
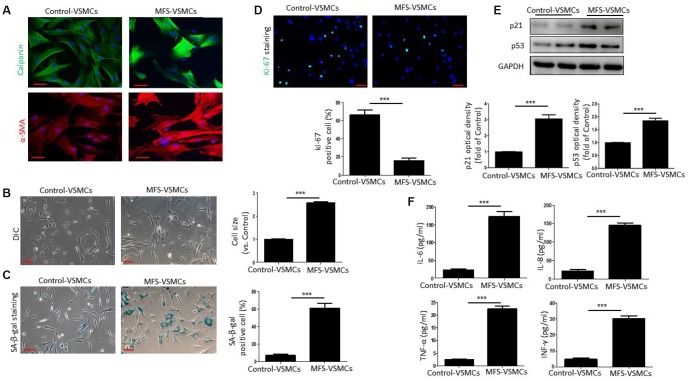
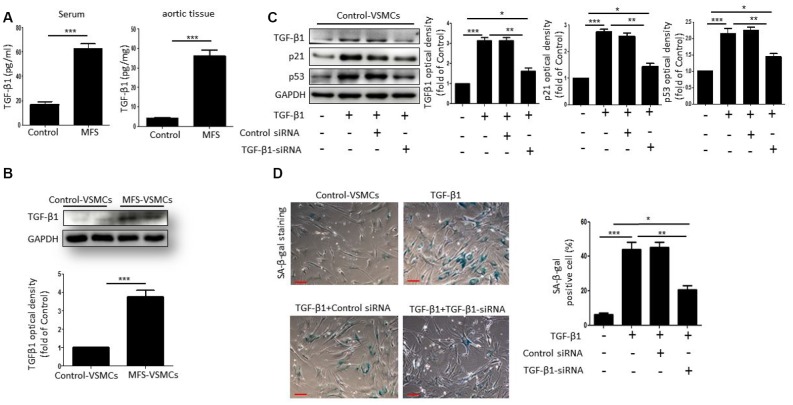
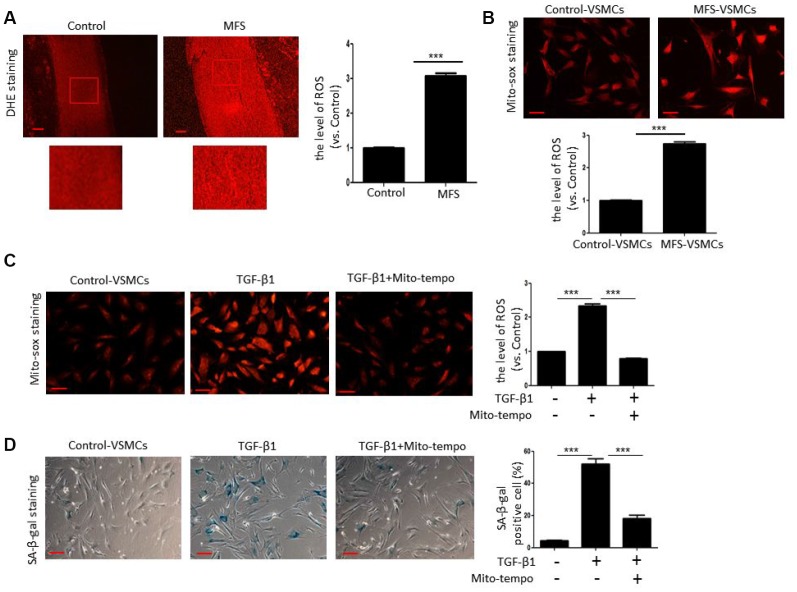
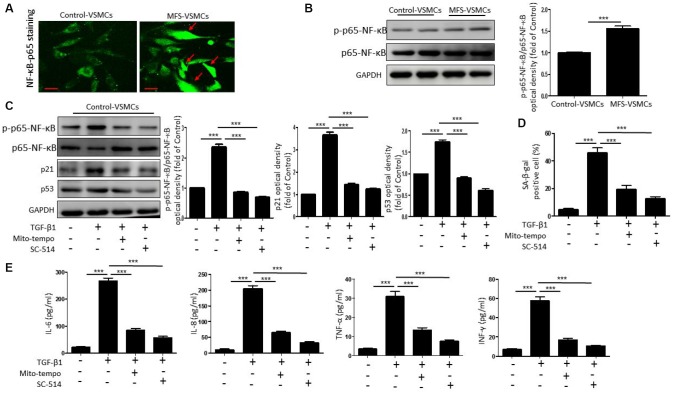
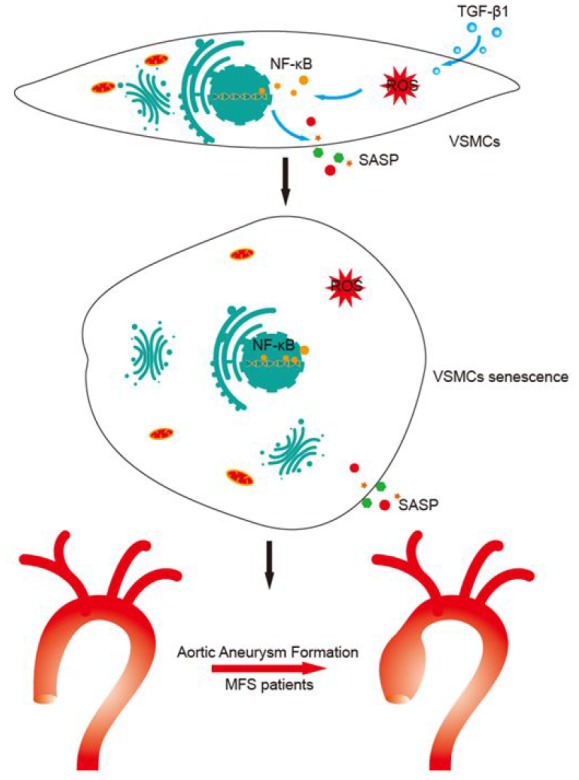
Formation of aortic aneurysms as a consequence of augmented transforming growth factor β (TGF-β) signaling and vascular smooth muscle cell (VSMC) dysfunction is a potentially lethal complication of Marfan syndrome (MFS). Here, we examined VSMC senescence in patients with MFS and explored the potential mechanisms that link VSMC senescence and TGF-β. Tissue was harvested from the ascending aorta of control donors and MFS patients, and VSMCs were isolated. Senescence-associated β-galactosidase (SA-β-gal) activity and expression of senescence-related proteins (p53, p21) were significantly higher in aneurysmal tissue from MFS patients than in healthy aortic tissue from control donors. Compared to control-VSMCs, MFS-VSMCs were larger with higher levels of both SA-β-gal activity and mitochondrial reactive oxygen species (ROS). In addition, TGF-β1 levels were much higher in MFS- than control-VSMCs. TGF-β1 induced VSMC senescence through excessive ROS generation. This effect was suppressed by Mito-tempo, a mitochondria-targeted antioxidant, or SC-514, a NF-κB inhibitor. This suggests TGF-β1 induces VSMC senescence through ROS-mediated activation of NF-κB signaling. It thus appears that a TGF-β1/ROS/NF-κB axis may mediate VSMC senescence and aneurysm formation in MFS patients. This finding could serve as the basis for a novel strategy for treating aortic aneurysm in MFS.

Keywords: Marfan syndrome; reactive oxygen species; senescence; transforming growth factor β; vascular smooth muscle cells.


Conflict of interest statement

CONFLICTS OF INTEREST: The authors declare no conflicts of interest.

Figures

Figure 1
Figure 1
VSMCs exhibit senescence in aortic aneurysm tissue from MFS patients. (A) Representative images of HE stained sections of ascending aorta from control donors and aortic aneurysm from MFS patients. Note the degeneration of the medial layer of the aortic wall in MFS patients. The box shows the location of the magnified region. Scale bar=200 μm. (B) Western blot and quantitative analysis of p53 and p21 levels in the ascending aorta of control donors and MFS patients. (C) Representative images and quantitative analysis of SA-β-gal staining in the ascending aorta from control donors and MFS patients. The box shows the location of the magnified region. Scale bar=200 μm. (D) Representative images and quantitative analysis of p53 (red) and α-SMA (green) staining in the ascending aorta from control donors and MFS patients. Scale bar=50 μm. Data are expressed as the mean±SEM; n=6. ***p<0.001.
Figure 2
Figure 2
VSMCs isolated from the ascending aorta of MFS patients exhibit cellular senescence. (A) Representative images of immunofluorescent staining for α-SMA and calponin in control- and MFS-VSMCs. Scale bar=50 μm. (B) Representative light micrographs of control- and MFS-VSMCs. Cell size is expressed relative to control. Scale bar=100 μm. (C) Representative images and quantitative analysis of SA-β-gal staining in control- and MFS-VSMCs. Numbers of SA-β-gal-positive cells are expressed as percentages of the total numbers of control- or MFS-VSMCs. Scale bar=100 μm. (D) Representative images and quantitative analysis of immunofluorescent ki-67 staining in control- and MFS-VSMCs. Numbers of ki-67-positive cells are expressed as percentages of the total numbers of control- or MFS-VSMCs. Scale bar=100 μm. (E) Western blotting and quantitative analysis of p53 and p21 levels in control- and MFS-VSMCs. (F) Concentrations of IL-6, IL-8, TNF-α and INF-γ in medium conditioned by control- or MFS-VSMCs. Data are expressed as the mean±SEM. n=3. ***p<0.001.
Figure 3
Figure 3
TGF-β1 induces cellular senescence in VSMCs. (A) TGF-β1 concentrations in serum from control donors and MFS patients was measured using an ELISA. n=6. (B) Western blotting and quantitative analysis of TGF-β1 levels in control- and MFS-VSMCs. n=3. (C) Western blotting and quantitative analysis of TGF-β1, p53 and p21 levels in control-VSMCs left untreated or treated with TGF-β1 or TGF-β1 combined with control-siRNA or TGF-β1-siRNA. n=3. (D) Representative images and quantitative analysis of SA-β-gal staining in control-VSMCs left untreated or treated with TGF-β1 or TGF-β1 combined with control-siRNA or TGF-β1-siRNA. n=3. Numbers of SA-β-gal-positive cells are expressed as percentages of the total cells. Data are expressed as the mean±SEM. *p<0.05, ***p<0.01, ***p<0.001.
Figure 4
Figure 4
TGF-β1 induces cellular senescence in VSMCs through elevation of ROS. (A) Representative images and quantitative analysis of DHE staining in the ascending aorta of control donors and MFS patients. ROS levels were analyzed and expressed relative to control. Scale bar=200 μm. n=6. (B) Representative images and quantitative analysis of Mito-sox staining of control- and MFS-VSMCs. ROS levels were analyzed and expressed relative to control. n=3. Scale bar=100 μm. (C) Representative images and quantitative analysis of Mito-sox staining in control-VSMCs left untreated or treated with TGF-β1 or TGF-β1 combined with Mito-tempo. ROS levels was analyzed and expressed relative to control. n=3. Scale bar=100 μm. (D) Representative images and quantitative analysis of SA-β-gal staining in control-VSMCs left untreated or treated with TGF-β1 or TGF-β1 combined with Mito-tempo. n=3. Scale bar=100 μm. Numbers of SA-β-gal-positive cells are expressed as percentages of the total cells. Data are expressed as the mean±SEM. ***p<0.001.
Figure 5
Figure 5
TGF-β1 induces cellular senescence in VSMCs through activation of ROS/NF-κB signaling. (A) Representative images of p65-NF-κB staining in control- and MFS-VSMCs. Scale bar=50 μm. (B) Western blotting and quantitative analysis of p-p65-NF-κB and p65-NF-κB levels in control- and MFS-VSMCs. (C) Western blotting and quantitative analysis of p-p65-NF-κB, p65-NF-κB, p53 and p21 levels in control-VSMCs treated with TGF-β1, TGF-β1+Mito-tempo or TGF-β1+SC-154. (D) Quantitative analysis of SA-β-gal staining in control-VSMCs treated with TGF-β1, TGF-β1+Mito-tempo or TGF-β1+SC-154. (E) Concentrations of IL-6, IL-8, TNF-α and INF-γ in medium conditioned by control-VSMCs treated with TGF-β1, TGF-β1+Mito-tempo or TGF-β1+SC-154. Data are expressed as the mean±SEM. n=3. ***p<0.001.
Figure 6
Figure 6
Proposed mechanisms for TGF-β1-induced VSMC senescence. This study shows that TGF-β1 induces VSMC senescence through activation of ROS/NF-κB signaling, which leads to aortic aneurysm formation in MFS patients.

References

    1. Crosas-Molist E, Meirelles T, López-Luque J, Serra-Peinado C, Selva J, Caja L, Gorbenko Del Blanco D, Uriarte JJ, Bertran E, Mendizábal Y, Hernández V, García-Calero C, Busnadiego O, et al.. Vascular smooth muscle cell phenotypic changes in patients with Marfan syndrome. Arterioscler Thromb Vasc Biol. 2015; 35:960–72. 10.1161/ATVBAHA.114.304412 - DOI - PubMed
    1. Dietz HC, Cutting GR, Pyeritz RE, Maslen CL, Sakai LY, Corson GM, Puffenberger EG, Hamosh A, Nanthakumar EJ, Curristin SM, Stetten G, Meyers DA, Francomano CA. Marfan syndrome caused by a recurrent de novo missense mutation in the fibrillin gene. Nature. 1991; 352:337–39. 10.1038/352337a0 - DOI - PubMed
    1. Siegert AM, Serra-Peinado C, Gutiérrez-Martínez E, Rodríguez-Pascual F, Fabregat I, Egea G. Altered TGF-β endocytic trafficking contributes to the increased signaling in Marfan syndrome. Biochim Biophys Acta Mol Basis Dis. 2018; 1864:554–62. 10.1016/j.bbadis.2017.11.015 - DOI - PubMed
    1. Milewicz DM, Dietz HC, Miller DC. Treatment of aortic disease in patients with Marfan syndrome. Circulation. 2005; 111:e150–57. 10.1161/01.CIR.0000155243.70456.F4 - DOI - PubMed
    1. Wortmann M, Skorubskaya E, Peters AS, Hakimi M, Böckler D, Dihlmann S. Necrotic cell debris induces a NF-κB-driven inflammasome response in vascular smooth muscle cells derived from abdominal aortic aneurysms (AAA-SMC). Biochem Biophys Res Commun. 2019; 511:343–49. 10.1016/j.bbrc.2019.02.051 - DOI - PubMed

Publication types

MeSH terms