. 2019 Aug 22;47(14):7580-7591.
doi: 10.1093/nar/gkz461.

hnRNPC regulates cancer-specific alternative cleavage and polyadenylation profiles

Affiliations

hnRNPC regulates cancer-specific alternative cleavage and polyadenylation profiles

Harry Fischl et al. Nucleic Acids Res. .

Abstract

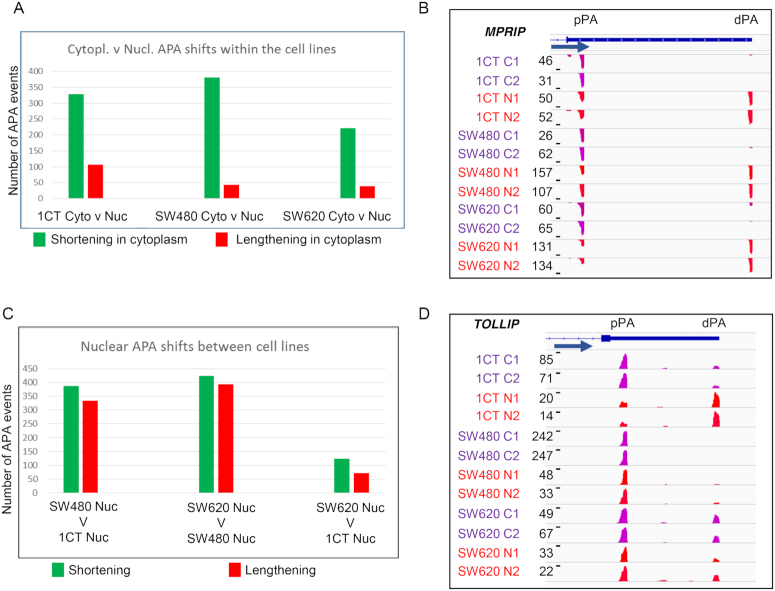
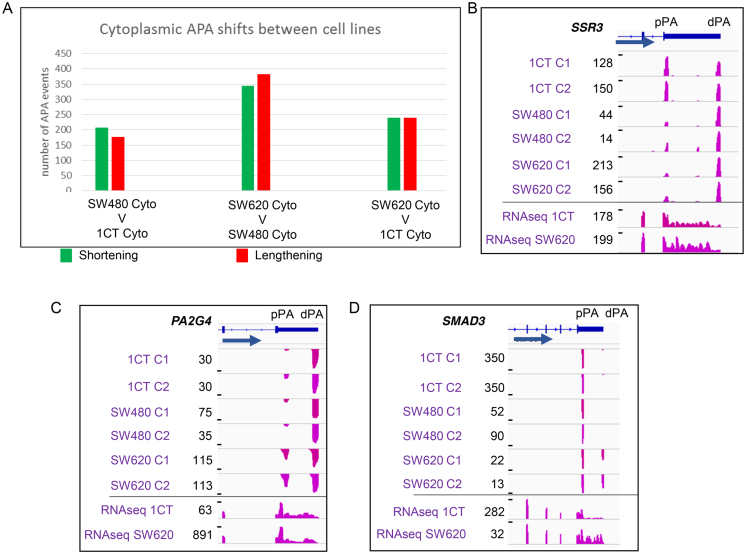
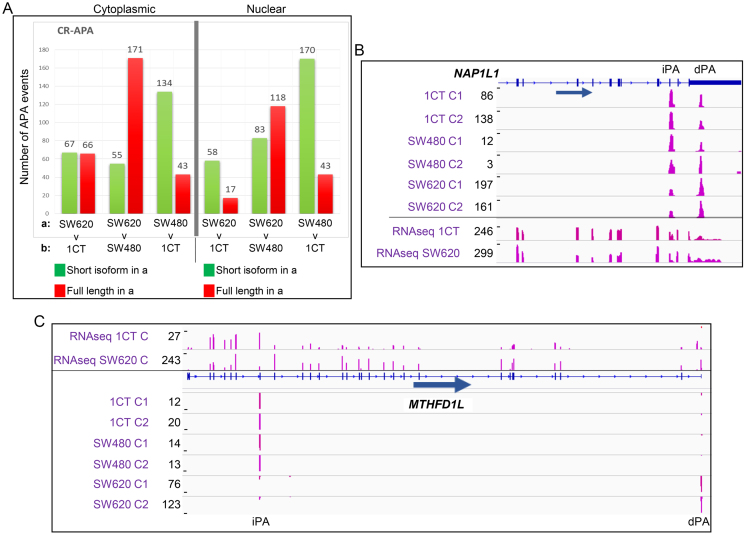
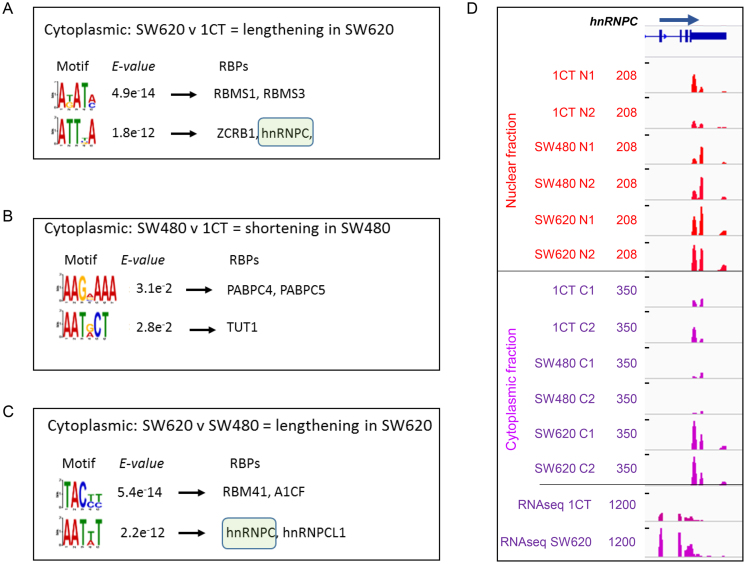
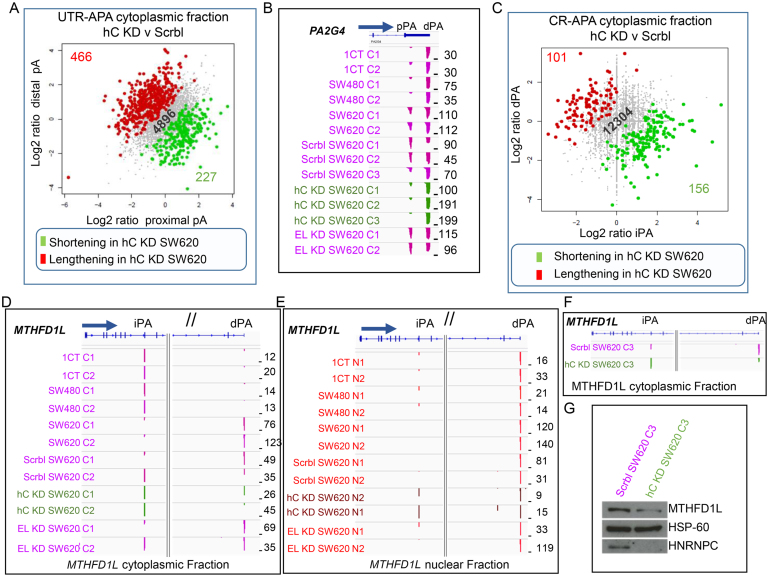
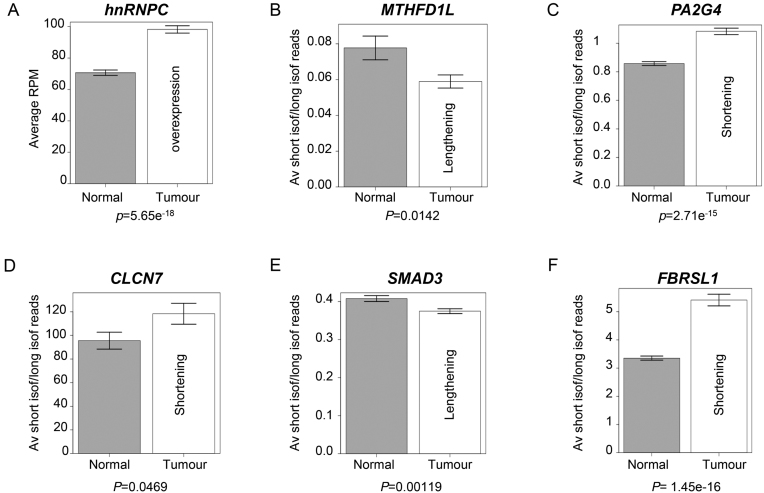
Alternative cleavage and polyadenylation (APA) can occur at more than half of all human genes, greatly enhancing the cellular repertoire of mRNA isoforms. As these isoforms can have altered stability, localisation and coding potential, deregulation of APA can disrupt gene expression and this has been linked to many diseases including cancer progression. How APA generates cancer-specific isoform profiles and what their physiological consequences are, however, is largely unclear. Here we use a subcellular fractionation approach to determine the nuclear and cytoplasmic APA profiles of successive stages of colon cancer using a cell line-based model. Using this approach, we show that during cancer progression specific APA profiles are established. We identify that overexpression of hnRNPC has a critical role in the establishment of APA profiles characteristic for metastatic colon cancer cells, by regulating poly(A) site selection in a subset of genes that have been implicated in cancer progression including MTHFD1L.


Figures

Figure 1.
Figure 1.
Nuclear and cytoplasmic UTR-APA profile comparison. (A and C) Bar charts displaying the number of events showing significant differential APA isoform representation when comparing UTR-APA isoform abundances. The identity of the samples being compared is shown under each comparison with each bar representing events where the shorter APA isoforms (green) or longer APA isoforms (red) have a significantly higher relative representation in the first sample. Significant differentially represented APA isoforms are those in which P≤0.01 (Fisher's exact test) and the isoform abundance change is ≥5% relative to total APA isoforms associated with that gene. (A) Shows the number of significant UTR-APA shortening (green) and lengthening (red) events occurring when comparing nuclear to cytoplasmic fractions for each of the three different cell lines. (B) Screenshot of MPRIP as an example of a gene that shows an overrepresentation of the proximal APA isoform in the cytoplasmic fraction, relative to the nuclear fraction, in all three colorectal cell lines analysed here. (C) Shows the number of significant UTR-APA shortening and lengthening events occurring when comparing nuclear fractions from each of the three different cell lines. (D) Screenshot of TOLLIP as an example of a gene that shows shortening in the nucleus when comparing 1CT to SW480 or SW620 cells without affecting the cytoplasmic APA profile highlighting the importance of using fractionation to make any predictions on the potential physiological impact of the profile changes observed. B&D), Read numbers in reads per million (RPM) and cell lines are indicated to the left of each track. C1, C2: cytoplasmic fractions repeat 1 and 2. N1 and N2: nuclear fractions repeat 1 and 2. Tracks show reads from sequencing the 3′ends of extracted RNAs. Gene structure, gene names and the position of the proximal (pPA) and distal (dPA) poly(A) sites are indicated above the tracks and blue arrow indicates the orientation of the respective gene. Screenshots were generated using IGV, with ‘window function’ set to ‘Mean’ and Auto scale’.
Figure 2.
Figure 2.
Comparison of UTR-APA abundances of the cytoplasmic fractions between the different cell lines. (A) The identity of the samples being compared is shown under each comparison with each bar representing events where the shorter APA isoforms (green) or longer APA isoforms (red) have a significantly higher relative representation in the first sample. Significant differentially represented APA isoforms are those in which P≤ 0.01 (Fisher's exact test) and the isoform abundance change is ≥5% relative to total APA isoforms associated with that gene. No clear trend towards either shortening (green) or lengthening (red) is apparent when the cytoplasmic APA profiles between the three different cell lines are compared. Panels B–D: Example genome browser pictures showing cell line specific changes in the overrepresentations of a particular UTR-APA isoform. Read numbers and respective cell lines are indicated to the left of each track. C1, C2: cytoplasmic fractions repeat 1 and 2. Tracks show reads from sequencing the 3′ends of extracted RNAs. Gene structure, gene names and the position of the proximal (pPA) and distal (dPA) poly(A) sites are indicated above the tracks and blue arrow indicates the orientation of the respective gene. Bottom two tracks represent full RNA-seq of SW620 and 1CT cytoplasmic polyadenylated mRNA. (B) SSR3 as an example gene that undergoes lengthening in both SW480 and SW620 when compared to 1CT cells. (C) PA2G4 and (D) SMAD3 as examples that undergo shortening (PA2G4) or lengthening (SMAD3) in SW620 cells compared to both SW480 and 1CT cells.
Figure 3.
Figure 3.
Comparison of CR-APA events across the three cell lines. (A) CR-APA profile changes when the cytoplasmic fractions (panel on the left) and nuclear fractions (panel on the right) are compared between the different cell lines. The identity of the samples being compared is shown under each comparison with each bar representing events where the shorter isoforms generated using internal poly(A) sites (green) or longer APA isoforms generated using distal poly(A) sites resulting in transcripts encoding the full-length protein (red) have a significantly higher relative representation in the first sample. Significant differentially represented APA isoforms are those in which P≤ 0.01 (Fisher's exact test) and the isoform abundance change is ≥5% relative to total APA isoforms associated with that gene. (B) NAP1L1 as an example that shows an SW620 specific overrepresentation of the full-length isoform in the cytoplasmic fraction. Top six tracks show reads from sequencing the 3′ ends of extracted cytoplasmic RNAs. Bottom two tracks show reads from full RNA-seq of SW620 and 1CT cytoplasmic polyadenylated mRNA. Gene structure and an arrow indicating the orientation of the gene are shown below the tracks. C1, C2: cytoplasmic fractions repeat 1 and 2. dPA: distal poly(A) site. IPA: internal poly(A) site. (C) MTHFD1L undergoes SW620 specific CR-APA with higher frequency of shortened transcripts in 1CT cells compared to SW620 cells where the full-length isoform is dominant. Bottom six tracks show reads from sequencing the 3′ ends of extracted cytoplasmic RNAs. Top two tracks show reads from full RNA-seq of SW620 and 1CT cytoplasmic polyadenylated mRNA. Gene structure and an arrow indicating the orientation of the gene are shown. C1, C2: cytoplasmic fractions repeat 1 and 2. dPA: distal poly(A) site. IPA: internal poly(A) site.
Figure 4.
Figure 4.
Motif analysis and interacting RBPs identified in aUTRs extracted from APA isoforms that show differential APA profiles when cytoplasmic APA isoforms are compared between: (A) isoforms that lengthen in SW620 compared to 1CT and (B) that shorten in SW480 compared to 1CT and (C) lengthen in SW620 compared to SW480. In all cases the top 2 significant overrepresented motifs were interrogated using the TOMTOM motif comparison tool to identify the corresponding interacting human RNA binding proteins with the default significance threshold set at E-value <10. The top two RBP hits for each motif are shown. No motifs were found for comparisons of SW620 compared to 1CT cells shortening in former and SW620 compared to SW480 cells shortening in former and SW480 compared to 1CT cells lengthening in former. Green boxes highlight hnRNPC hits. (D) hnRNPC is overexpressed in the nuclear (red) and cytoplasmic (purple) fractions of SW620 compared to SW480 and 1CT cells at the RNA level. Top 12 tracks show reads from sequencing the 3′ ends of extracted nuclear RNAs (tracks 1–6) or cytoplasmic RNAs (tracks 7–12). Bottom two tracks show reads from full RNA-seq of SW620 and 1CT cytoplasmic polyadenylated mRNA. C1, C2: cytoplasmic fractions repeat 1 and 2. N1, N2: nuclear fractions repeat 1 and 2. Read numbers are scaled, tracks 1–6 max = 208 RPM, tracks 7–12 max = 350 RPM, tracks 13–14 max = 1200 RPM.
Figure 5.
Figure 5.
hnRNPC knock down reverts SW620 specific UTR-APA and CR-APA changes to profiles characteristic for SW480 and 1CT cells. (A) Scatter plot of UTR-APA events in the cytoplasm of SW620 cells transfected with siRNAs targeting hnRNPC compared to SW620 cells transfected with scrambled siRNAs (combined replicates). Genes are highlighted when the shorter (green) or longer (red) isoform have a significantly higher representation (Fisher's exact P≤ 0.01) in SW620 cells with reduced levels of hnRNPC compared to SW620 cells with normal hnRNPC levels. Grey dots represent genes with UTR-APA isoforms that do not significantly differ in frequency between the nucleus and the cytoplasm. (B) PA2G4 representing an example of a gene that reverts the cytoplasmic APA profiles upon hnRNPC depletion in SW620 cells to profiles characteristic for SW480 and 1CT cells. Scrbl SW620 C1 and C2 SW620 cells transfected with scrambled siRNAs and hC KD SW620 C1 and C2 green tracks represent SW620 cells transfected with siRNAs targeting hnRNPC mRNA, EL KD SW620 C1 and C2 represent SW620 cells transfected with siRNAs targeting ELAVL1 mRNA. (C) Scatter plot of CR-APA events in the cytoplasm of SW620 cells transfected with siRNAs targeting hnRNPC compared to SW620 cells transfected with scrambled siRNAs (combined replicates). Genes are highlighted when the shorter (green) or longer (red) isoform have a significantly higher representation (Fisher's exact P≤ 0.01) in SW620 cells with reduced levels of hnRNPC compared to SW620 cells with normal hnRNPC levels. (A, C) Grey dots represent genes with APA isoforms that do not significantly differ in frequency between the nucleus and the cytoplasm. The actual numbers of genes undergoing relative shortening (green) or lengthening (red) or genes where isoforms do not change in frequency (grey) are indicated in the bottom right and top left corners and in the centre respectively. (D) Cytoplasmic CR-APA profile changes in MTHFD1L as a result of hnRNPC depletion (green tracks) in SW620 cells and (E) changes in the nuclear fraction (brown tracks). For both (D) and (E), the left panel shows the 5′ region of the MTHFD1L gene and right panels show the 3′ region of the gene. (F) Genome browser shot focusing on the cytoplasmic APA changes of the third independent biological repeat for CR-APA in the MTHFD1L gene. (G) Western blot of total protein extracts targeting full-length MTHFD1L (top panel) and hnRNPC (bottom panel) in SW620 treated with scrambled siRNAs or siRNAs targeting hnRNPC. Middle panel shows the HSP-60 loading control.
Figure 6.
Figure 6.
Comparison of APA profile shifts in RNAseq samples extracted from matched patient normal and tumour samples (34). (A) Bar chart comparing the mean read numbers aligning to the terminal exon of hnRNPC per million total aligned reads in normal and tumour samples. (B) Bar chart comparing the mean ratios of reads aligning to the terminal exon of the short and long isoforms of MTHFD1L in normal and tumour samples. (C–F) Bar charts comparing the mean ratios of reads aligning to the terminal exon of the short isoform and the aUTR for genes (C) PA2G4, (D) CLCN7, (E) SMAD3 and (F) FBRSL1 for normal and tumour samples. All bar chart error bars show the S.E.M. P-values (Student's t-test) test the significance of the difference in the means.

References

    1. Proudfoot N.J., Furger A., Dye M.J.. Integrating mRNA processing with transcription. Cell. 2002; 108:501–512. - PubMed
    1. Tian B., Hu J., Zhang H., Lutz C.S.. A large-scale analysis of mRNA polyadenylation of human and mouse genes. Nucleic Acids Res. 2005; 33:201–212. - PMC - PubMed
    1. Afonso-Grunz F., Müller S.. Principles of miRNA–mRNA interactions: beyond sequence complementarity. Cell Mol. Life Sci. 2015; 72:3127–3141. - PMC - PubMed
    1. Berkovits B.D., Mayr C.. Alternative 3′ UTRs act as scaffolds to regulate membrane protein localization. Nature. 2015; 522:363–367. - PMC - PubMed
    1. Tian B., Manley J.L.. Alternative polyadenylation of mRNA precursors. Nat. Rev. Mol. Cell Biol. 2016; 18:18–30. - PMC - PubMed

Publication types

MeSH terms

Substances

LinkOut - more resources