. 2019 Aug;18(4):e12981.
doi: 10.1111/acel.12981. Epub 2019 May 31.

Inhibition of the 60S ribosome biogenesis GTPase LSG1 causes endoplasmic reticular disruption and cellular senescence

Affiliations

Inhibition of the 60S ribosome biogenesis GTPase LSG1 causes endoplasmic reticular disruption and cellular senescence

Asimina Pantazi et al. Aging Cell. 2019 Aug.

Abstract

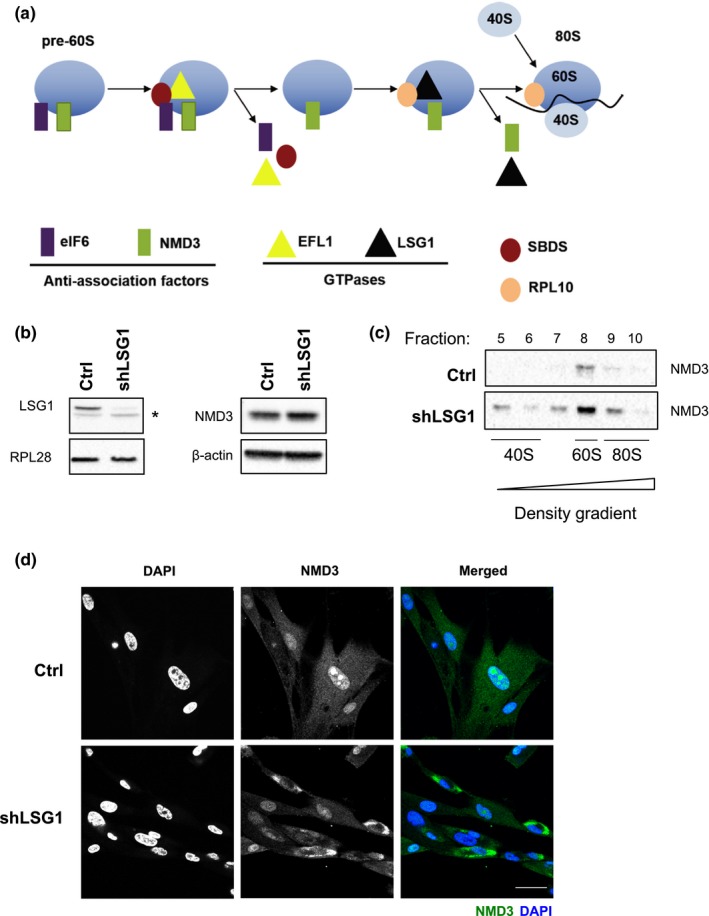
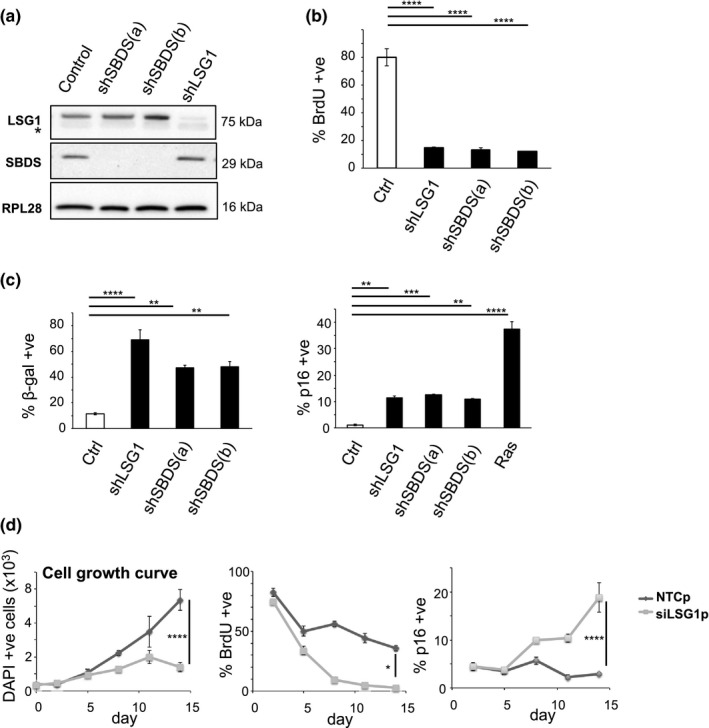
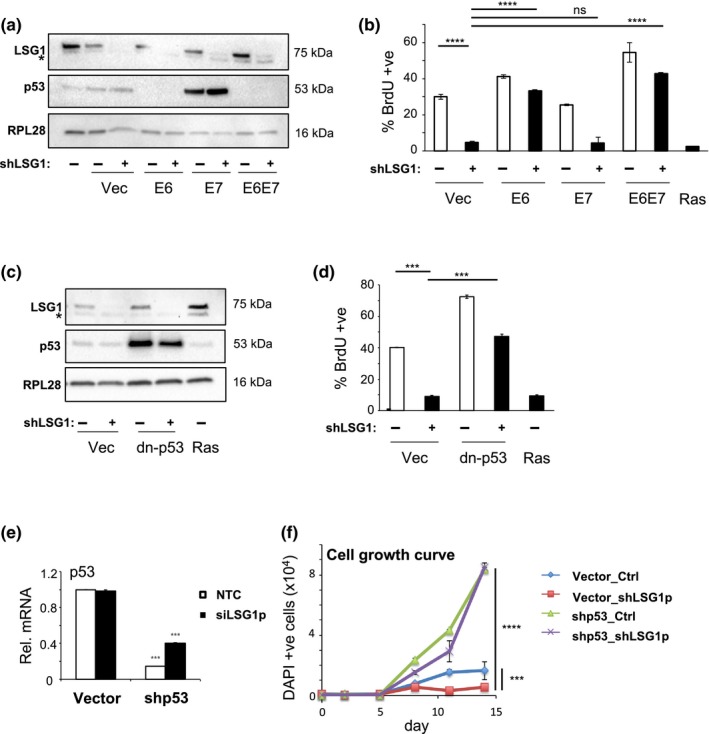
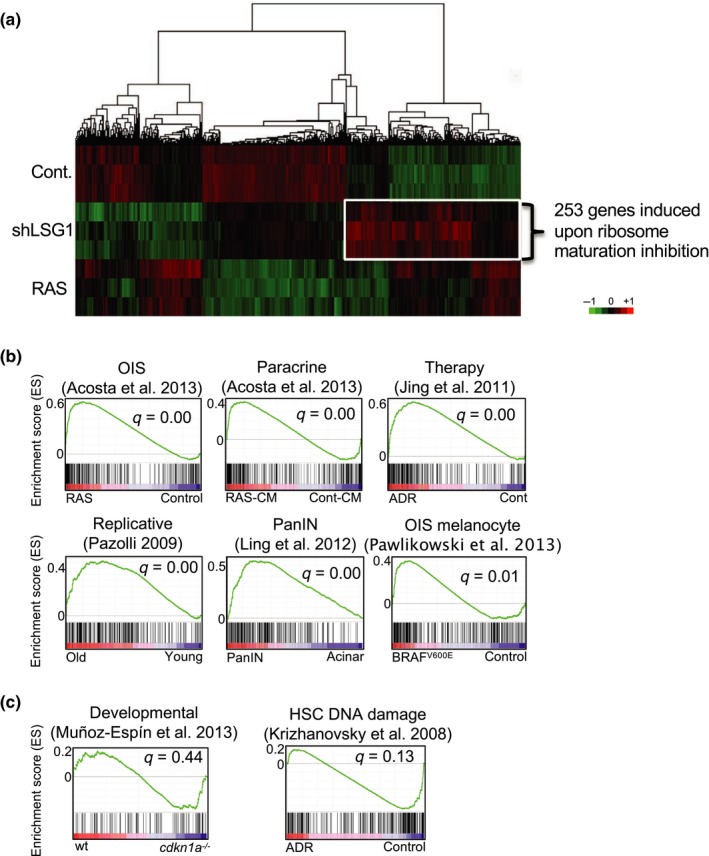
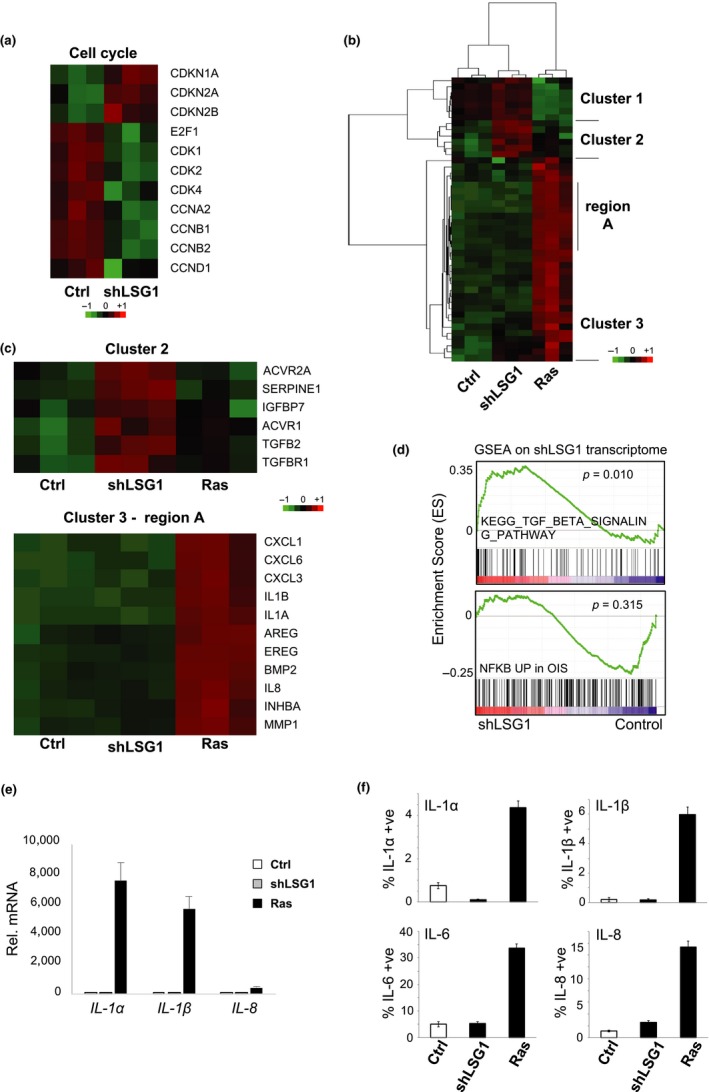
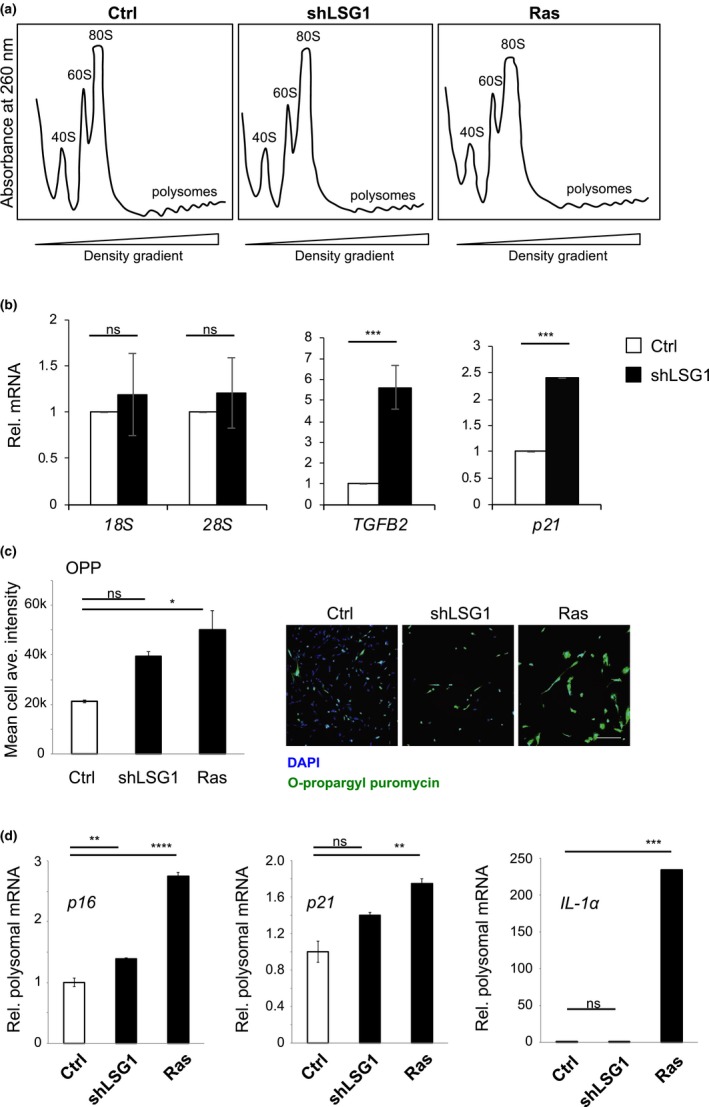
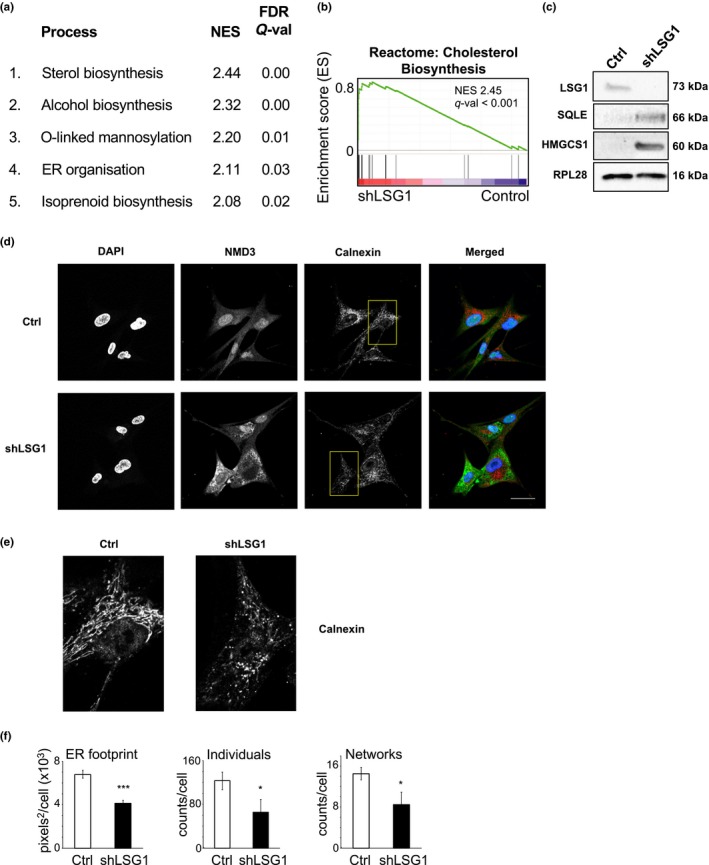
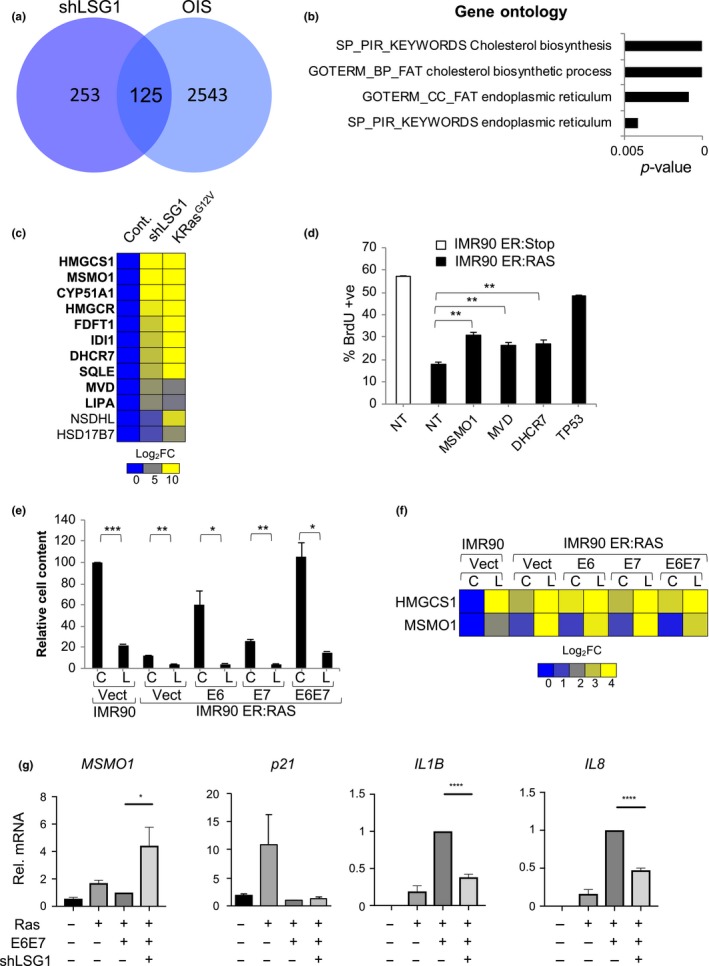
Cellular senescence is triggered by diverse stimuli and is characterized by long-term growth arrest and secretion of cytokines and chemokines (termed the SASP-senescence-associated secretory phenotype). Senescence can be organismally beneficial as it can prevent the propagation of damaged or mutated clones and stimulate their clearance by immune cells. However, it has recently become clear that senescence also contributes to the pathophysiology of aging through the accumulation of damaged cells within tissues. Here, we describe that inhibition of the reaction catalysed by LSG1, a GTPase involved in the biogenesis of the 60S ribosomal subunit, leads to a robust induction of cellular senescence. Perhaps surprisingly, this was not due to ribosome depletion or translational insufficiency, but rather through perturbation of endoplasmic reticulum homeostasis and a dramatic upregulation of the cholesterol biosynthesis pathway. The underlying transcriptomic signature is shared with several other forms of senescence, and the cholesterol biosynthesis genes contribute to the cell cycle arrest in oncogene-induced senescence. Furthermore, targeting of LSG1 resulted in amplification of the cholesterol/ER signature and restoration of a robust cellular senescence response in transformed cells, suggesting potential therapeutic uses of LSG1 inhibition.


Conflict of interest statement

None declared.

Figures

Figure 1
Figure 1
Knockdown of LSG1 inhibits NMD3 release from the ribosomal 60S subunit. (a) Schematic of the late cytoplasmic reactions of 60S subunit maturation. The cytoplasmic pre‐60S subunit carries the anti‐association factors eIF6 and NMD3. Recruitment of the factor SBDS and the GTPase EFL1 leads to eviction of eIF6 in a reaction catalysed by hydrolysis of GTP. SBDS stimulates GTP hydrolysis by EFL1, which induces a rotation in the structure of SBDS, resulting in conformational changes and eIF6 release. RPL10 and the GTPase LSG1 then bind to the subunit leading to eviction of NMD3, again catalysed by GTP hydrolysis. RPL10 is retained on the 60S subunit, and the mature 80S ribosome is formed. (Adapted from Finch et al., 2011 and Hedges et al., 2005) (b) Western blot analysis shows the knockdown of LSG1 in HEK 293 cells. The asterisk denotes a nonspecific band. RPL28 was used as a reference protein. A blot for NMD3 in IMR90 cells with β‐actin as control is also shown. (c) Western blot analysis shows the levels of NMD3 and RPS14 across sequential fractions (5–10) collected from sucrose gradients in control and shLSG1 conditions. Extracts were normalized by spectrophotometry at 254 nm prior to loading. The NMD3 in fraction 8 corresponds to the localization of 60S monomers. (d) Immunostaining for NMD3 in MRC5 cells (control and shLSG1), followed by confocal microscopy, reveals relocalization of NMD3 to the cytoplasm following LSG1 knockdown. Scale bar: 50 μm
Figure 2
Figure 2
Knockdown of LSG1 and SBDS induces senescence. (a) Western blot showing the efficiency of LSG1 and SBDS knockdown in MRC5 cells induced by the hairpins shLSG1, shSBDS(a) and shSBDS(b). The asterisk denotes a nonspecific band in the LSG1 blot. RPL28 was used as a reference protein. (b) High content imaging analysis of BrdU incorporation and immunostaining in MRC5 cells with LSG1 and SBDS downregulation, 7 days postinfection. The cells were treated with 50 mM BrdU for 16 hr. (c) The senescence‐associated β‐galactosidase assay was performed 7 days postinfection. Images were taken using phase contrast microscopy, and the number of cells that were positive for the blue precipitate was counted. The bar chart on the right shows high content imaging analysis of p16 immunostaining. Ras‐transduced cells were used as a positive control for p16 induction. (d) Time course experiment (time points: d0, d2, d5, d8, d11, d14) using a siRNA SMARTpool for LSG1 (siLSG1p). Cell growth (DAPI stain), BrdU incorporation and p16 expression were monitored throughout the time course using high content microscopy. Error bars show standard deviation of 3 biological replicates. Statistical significance was calculated using one‐way ANOVA with Dunnett's (Figure 2b,c) or Sidak's (Figure 2d) multiple comparisons tests. *p < 0.05, **p < 0.01, ***p < 0.001, and ****p < 0.0001
Figure 3
Figure 3
The senescence response induced by LSG1 knockdown is p53‐dependent. (a) Western blots for LSG1, p53 and RPL28 in MRC5 cells transduced with shLSG1 and/or HPV E6, E7 or E6E7 (the asterisk denotes a nonspecific band). (b) BrdU incorporation was measured by high content imaging in cells transduced as in (a) above. K‐RASG12V‐transduced cells were used as a positive control for growth arrest. (c) Western blots for LSG1, p53 and RPL28 in MRC5 cells transduced with shLSG1 and/or a dominant‐negative p53 construct (dn‐p53) (the asterisk denotes a nonspecific band). Ras retroviral overexpression is included as a positive control. (d) BrdU incorporation was measured by high content imaging in cells transduced as in (c) above. (e) qRT–PCR analysis of MRC5 cells transduced with shLSG1 and/or shp53 for the quantification of p53 transcript levels. (f) Time course experiment for the study of the growth levels of the above (e) cells, using high content imaging to measure DAPI stain. Time points: d0, d2, d5, d8, d11, d14. Error bars show standard deviation of 3 biological replicates. Statistical significance was calculated using two‐tailed t tests or one‐way ANOVA with Dunnett's (Figure 3b) or Sidak's (Figure 3f) multiple comparisons tests. *p < 0.05, **p < 0.01, ***p < 0.001, and ****p < 0.0001
Figure 4
Figure 4
A signature of genes induced by LSG1 knockdown is common with other senescence responses: (a) Hierarchical clustering of mRNA profiles from cells transduced with K‐RASG12V, shLSG1 and vector control (Cont.) in MRC5 cells showing genes changing significantly (Adj.p < 0.01) between shLSG1 and control (GSE128055). A signature of 253 genes induced by shLSG1 is highlighted. Data represent 3 experimental replicates. (b) GSEA plots showing that a signature of 253 genes derived from MRC5 cells undergoing shLSG1‐induced senescence (described in a.) is significantly enriched in multiple forms of senescence. (q represents false discovery rate (FDR)). (c) GSEA plots showing that a signature of 253 genes derived from MRC5 cells undergoing shLSG1‐induced senescence (described in a.) is not significantly enriched during developmental senescence or DNA damage‐induced senescence. (q represents false discovery rate (FDR))
Figure 5
Figure 5
Transcriptomic analysis reveals a robust senescent transcriptional response with a restricted SASP upon LSG1 knockdown. (a) Regulation of antiproliferative and proliferative cell cycle‐related transcripts by shLSG1 in MRC5 cells. (b) Clustering of transcript levels of SASP factors. (c) Cluster 2 contains a set of mRNAs that are specific for shLSG1 (vs. K‐RASG12V) that includes TGFB2 and related genes. Cluster 3, region A is OIS‐specific and is comprised of NF‐κB‐driven canonical SASP genes. (d) GSEA of the transcriptome of MRC5 cells transduced with shLSG1 compared to control showing significant enrichment for the TGFB signalling pathway (KEGG pathway) and no significant enrichment for the OIS‐associated NF‐κB signature (Chien et al., 2011) (e) qPCR analysis of the above cells for the quantitation of IL‐1α, IL‐1β and IL‐8 transcript levels. (f) High content imaging analysis of the SASP factors IL‐1α, IL‐1β, IL‐6 and IL‐8. KRASG12V retroviral overexpression was included as a positive control. Error bars show standard deviation of 3 biological replicates
Figure 6
Figure 6
Knockdown of LSG1 does not inhibit global translation. (a) Polysome profiling of MRC5 cells at senescence triggered by shLSG1 or K‐RASG12V after 7 days. (b) qPCR analysis of the above cells for the quantitation of ribosomal 18S and 28S transcript levels to assess total ribosomal subunit composition, alongside TGFB2 and p21 confirming the senescence response. (c) Analysis of translational activity using O‐propargyl puromycin (OPP) and high content imaging. Quantitation of mean cell average intensity from images obtained. Representative images are provided. Scale bar: 200 μm. (d) qPCR analysis of polysome‐associated transcripts for the senescence markers p16, p21 and IL‐1α. Error bars show standard deviation of 3 biological replicates. Statistical significance was calculated using two‐tailed t tests or one‐way ANOVA with Dunnett's multiple comparisons tests (Figure 6c,d). *p < 0.05 **p < 0.01, ***p < 0.001, and ****p < 0.0001
Figure 7
Figure 7
Knockdown of LSG1 leads to upregulation of cholesterol biosynthesis pathways and homeostatic alterations in the ER apparatus. (a) Gene set enrichment analysis (GSEA), ranked by normalized enrichment score (NES), revealed the top 5 upregulated biological processes as a result of LSG1 knockdown. The false discovery rate (FDR) yields the Q‐value for statistical significance. (b) GSEA diagram of the cholesterol biosynthesis signature upon LSG1 knockdown as described in (a). (c) Western blot for LSG1, RPL28 and the cholesterol biosynthesis enzymes SQLE and HMGCS1 in shLSG1‐transduced MRC5 cells. (d) Immunofluorescence staining for calnexin in MRC5 cells transduced with control and with shLSG1, imaged by confocal microscopy. Scale bar: 50 μm. (e) High magnification images of the regions indicated in (d) stained for calnexin. (f) FIJI‐based analysis of the ER skeleton in the cells above, using the MiNA plugin (Valente et al., 2017). Error bars denote SEM of three biological replicates. Statistical significance is calculated using two‐tailed t tests. *p < 0.05, **p < 0.01, and ***p < 0.001
Figure 8
Figure 8
LSG1 targeting restores the cholesterol/ER senescent programme in H‐RASG12V‐expressing cells that have bypassed senescence. (a) Venn diagram representing the number of genes commonly induced between shLSG1 knockdown induced senescence and OIS in MRC5 cells by AmpliSeq transcriptome analysis. (b) Bar graph representing the p‐value after functional annotation analysis of the most significant GO terms enriched in the 125 genes induced by shLSGI and oncogenic RAS in MRC5 cells as in a. Analysis was performed using the DAVID web resource. (c) Heat map representing mRNA fold change (Log2 scale) in the AmpliSeq expression profile of cholesterol biosynthesis genes in shLSG1‐ and RAS‐transduced MRC5 cells. Each sample represents the mean of 3 experimental replicates. Bold character genes represent significant changes in expression in both conditions. (d) BrdU proliferation assay of IMR90 ER:RAS or ER:Stop control cells 5 days after 4 hydroxytamoxifen (4OHT) treatment and siRNA SMARTpool transfection for the cholesterol biosynthesis genes MSMO1, MVD, DHCR7 and TP53 (as a positive control). Nontargeting (NT) siRNA SMARTpool was used as a negative control. Bars represent the mean of 3 experimental replicates. Error bars represent the SEM. (e) Proliferation assay showing relative cell content of cells transduced with shLSG1 (L) or control (C) lentiviral vectors in cells bypassing OIS. Bypass of OIS was achieved with retrovirus expressing HPV proteins E6, E7, E6E7 or neomycin control. Cells were seeded at low density, cultured for 14 days and stained with crystal violet (CV) as indicated. Bars represent the mean quantification of CV staining of three independent experiments. Error bars represent the SEM. (f) Heat map showing HMGCS1 and MSMO mRNA fold change (Log10 scale) by qRT–PCR from cells treated as in (e) above: C refers to control; L refers to shLSG1. (g) qRT–PCR analysis of IMR90 cells transduced with Vector control, Ras, Ras/E6E7 or Ras/E6E7/shLSG1. MSMO1, p21, IL1B and IL8 were measured. Statistical significance was calculated using two‐tailed t tests or one‐way ANOVA with Dunnett's multiple comparisons tests (Figure 8d). *p < 0.05, **p < 0.01, ***p < 0.001, and ****p < 0.0001

References

    1. Acosta, J. C. , Banito, A. , Wuestefeld, T. , Georgilis, A. , Janich, P. , Morton, J. P. , … Gil, J. (2013). A complex secretory program orchestrated by the inflammasome controls paracrine senescence. Nature Cell Biology, 15, 978–990. - PMC - PubMed
    1. Acosta, J. C. , O'Loghlen, A. , Banito, A. , Guijarro, M. V. , Augert, A. , Raguz, S. , … Gil, J. (2008). Chemokine signaling via the CXCR2 receptor reinforces senescence. Cell, 133, 1006–1018. 10.1016/j.cell.2008.03.038 - DOI - PubMed
    1. Agola, J. O. , Hong, L. , Surviladze, Z. , Ursu, O. , Waller, A. , Strouse, J. J. , … Wandinger‐Ness, A. (2012). A competitive nucleotide binding inhibitor. In vitro characterization of Rab7 GTPase inhibition. ACS Chemical Biology, 7, 1095–1108. - PMC - PubMed
    1. Barkic, M. , Crnomarkovic, S. , Grabusic, K. , Bogetic, I. , Panic, L. , Tamarut, S. , … Volarevic, S. (2009). The p53 tumor suppressor causes congenital malformations in Rpl24‐deficient mice and promotes their survival. Molecular and Cellular Biology, 29, 2489–2504. 10.1128/MCB.01588-08 - DOI - PMC - PubMed
    1. Barlow, J. L. , Drynan, L. F. , Hewett, D. R. , Holmes, L. R. , Lorenzo‐Abalde, S. , Lane, A. L. , … McKenzie, A. N. J. (2010). A p53‐dependent mechanism underlies macrocytic anemia in a mouse model of human 5q‐ syndrome. Nature Medicine, 16, 59–66. 10.1038/nm.2063 - DOI - PMC - PubMed

Publication types

MeSH terms