. 2019 May 31;9(1):8151.
doi: 10.1038/s41598-019-44613-5.

Response of an actin network in vesicles under electric pulses

Affiliations

Response of an actin network in vesicles under electric pulses

Dayinta L Perrier et al. Sci Rep. .

Abstract

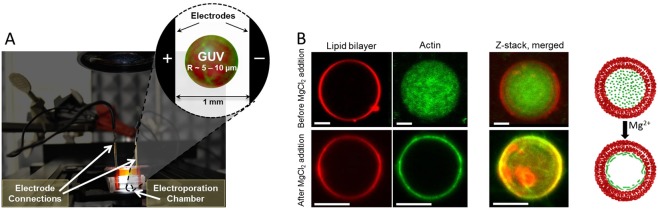
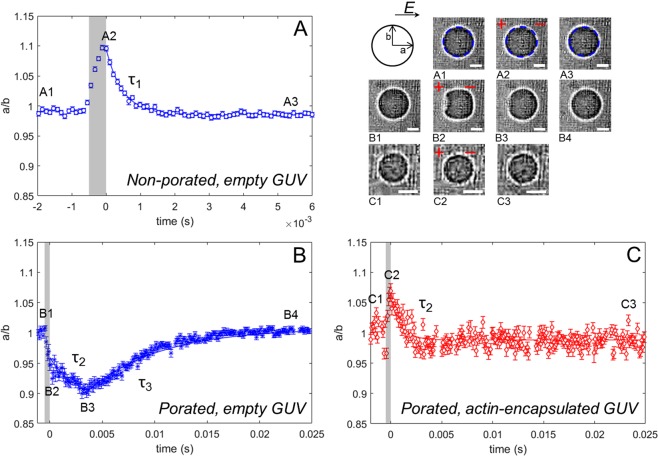
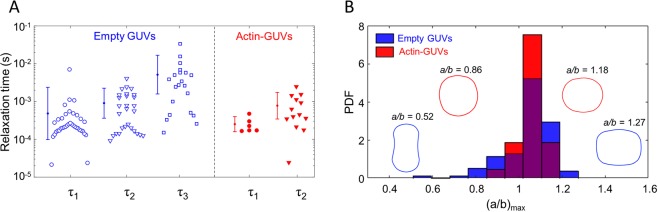
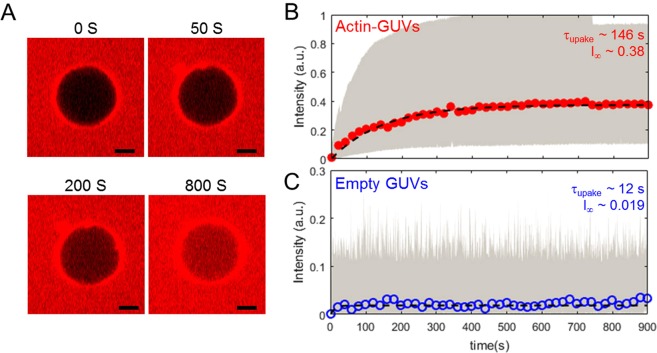
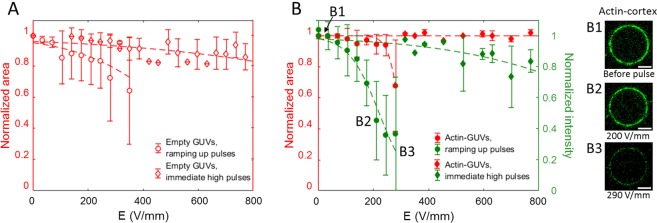
We study the role of a biomimetic actin network during the application of electric pulses that induce electroporation or electropermeabilization, using giant unilamellar vesicles (GUVs) as a model system. The actin cortex, a subjacently attached interconnected network of actin filaments, regulates the shape and mechanical properties of the plasma membrane of mammalian cells, and is a major factor influencing the mechanical response of the cell to external physical cues. We demonstrate that the presence of an actin shell inhibits the formation of macropores in the electroporated GUVs. Additionally, experiments on the uptake of dye molecules after electroporation show that the actin network slows down the resealing process of the permeabilized membrane. We further analyze the stability of the actin network inside the GUVs exposed to high electric pulses. We find disruption of the actin layer that is likely due to the electrophoretic forces acting on the actin filaments during the permeabilization of the GUVs. Our findings on the GUVs containing a biomimetic network provide a step towards understanding the discrepancies between the electroporation mechanism of a living cell and its simplified model of the empty GUV.


Conflict of interest statement

The authors declare no competing interests.

Figures

Figure 1
Figure 1
The electroporation setup. (A) Photograph of the electroporation setup, with a schematic of the GUV in between the electrodes shown in the inset, not drawn to scale. (B) Confocal fluorescence microscopy images of a GUV (red signal, ex/em 560 nm/583 nm) before and after the addition of 19 mM MgCl2, showing that actin polymerizes and accumulates underneath the lipid bilayer membrane (green signal, ex/em 495 nm/519 nm). The scale bar in all images is 5 μm.
Figure 2
Figure 2
The relaxation dynamics of GUVs with and without an encapsulated actin shell. (A) The dynamics of a non-porated empty GUV, where deformation and a single relaxation (τ1) is observed. The blue dotted lines in the snapshots of A1–A3 show the results of the tracking method used to determine radii a and b. (B) The dynamics of a porated empty GUV, where a pore is observed together with a double relaxation (τ2 and τ3). (C) The dynamics of a porated actin-encapsulated GUV where no macropore is observed, and only a single relaxation (τ2). The relaxation times are obtained from exponential fits to the deformation data, as explained in the text. The scale bar in all images is 5 μm. The definitions of non-porated and porated GUVs are explained in the text.
Figure 3
Figure 3
The relaxation time and maximum deformation of the GUVs during an electric pulse with and without actin shell. (A) Relaxation times of empty (blue open symbols) and actin-encapsulated (red filled symbols) GUVs in the non-electroporative regime (τ1) and the electroporative regime (τ2 and τ3). (B) The distribution of the maximum deformations of empty (blue) and actin-encapsulated (red) GUVs during all pulses (both electroporative and non-electroporative). The schematics in the histogram represent simplified contours of the corresponding disklike and tubelike deformations, not to scale. The data in both panels is of 16 actin-encapsulated GUVs with an average radius of ~5 μm (range from 3 to 6.4 μm) and 10 empty GUVs with an average radius of ~5 μm (range from 3 to 6.7 μm). In both cases, the experiments have been repeated five times on different days.
Figure 4
Figure 4
The kinetics of dye uptake during the resealing of GUVs. (A) Four snapshots of a resealing experiment of an actin-encapsulated GUV, showing the uptake of dye molecules from the outside solution after an 85 V/mm pulse over time. The scale bar in all images is 5 μm. (B) The average intensity of sulforhodamine B in the actin-GUVs over time of 13 different GUVs with an average radius of ~10 μm (ranged from 5 to 17 μm). The GUVs were exposed to electroporative pulses inducing a transmembrane voltage above 1 V. Already one single 500 μs pulse caused considerable uptake of the dye molecules. (C) The average intensity of fluorescent dye in empty GUVs over time of 15 different GUVs. To ensure dye uptake by the GUVs after pulse application, multiple pulses were applied when no visible dye uptake was obtained. Only the pulses where an increase of the dye intensity immediately after the pulse was observed have been selected to calculate the average intensity increase. The dotted lines in both graphs represent the least-squares fit of Eq. 3 through the averaged data. The highlighted area in gray in both graphs shows the spread of the data points of all experiments. Only every twentieth data point of the averaged data is shown here, to improve the readability of the graph. The fitting parameters, characteristic time and amount of uptake of dye molecules, obtained from the fits are shown in the graphs.
Figure 5
Figure 5
The structural stability of empty and actin-encapsulated GUVs. (A) The area loss of empty GUVs as a function of the electric field. The average normalized area is shown for 15 empty GUVs in total with an average radius of ~10 μm, of which 9 have been exposed to the consecutive ramping up pulses and 5 to immediate high pulses. These experiments have been repeated four times on different days. (B) The area loss of the actin-encapsulated GUVs as a function of the electric field, which is associated with an intensity loss of the actin shell. The average normalized area is shown of 17 actin-encapsulated GUVs in total with an average radius of ~10 μm, of which 8 have been exposed to the consecutive ramping up pulses and 9 to immediate high pulses. These experiments have been repeated five times on different days. The confocal images show solely the actin fluorescence signal where the intensity loss can be attributed to shell disruption (B1, B2 and B3). Photobleaching of the fluorescence intensity of the actin shell is observed (shown in Fig. S.3 in the Supplementary Information) and is corrected as discussed in the Materials and Methods section. The dotted lines in the graphs represent a least-squares fit of a sigmoid curve to guide the eye. For more statistics on the response of the GUVs, see Section S10 in the Supplementary Material. The scale bar in all images is 5 μm.

References

    1. Bray D, White J. Cortical flow in animal cells. Science. 1988;239:883–888. doi: 10.1126/science.3277283. - DOI - PubMed
    1. Towhidi L, et al. Variability of the minimal transmembrane voltage resulting in detectable membrane electroporation. Electromagn. Biol. Medicine. 2008;27:372–385. - PubMed
    1. Teissie J, Golzio M, Rols M. Mechanisms of cell membrane electropermeabilization: a minireview of our present (lack of?) knowledge. Biochimica et Biophys. Acta (BBA) - Gen. Subj. 2005;1724:270–280. doi: 10.1016/j.bbagen.2005.05.006. - DOI - PubMed
    1. Rols M.P., Teissié J. Electropermeabilization of mammalian cells. Quantitative analysis of the phenomenon. Biophysical Journal. 1990;58(5):1089–1098. doi: 10.1016/S0006-3495(90)82451-6. - DOI - PMC - PubMed
    1. Lopez A, Rols M, Teissie J. 31P NMR Analysis of Membrane Phospholipid Organization In Viable, Reversibly Electropermeabilized Chinese Hamster Ovary Cells. Biochemistry. 1988;27:1222–1228. doi: 10.1021/bi00404a023. - DOI - PubMed

Publication types