. 2019 May 27:10:24.
doi: 10.1186/s13229-019-0275-3. eCollection 2019.

The distribution of autistic traits across the autism spectrum: evidence for discontinuous dimensional subpopulations underlying the autism continuum

Affiliations

The distribution of autistic traits across the autism spectrum: evidence for discontinuous dimensional subpopulations underlying the autism continuum

Ahmad Abu-Akel et al. Mol Autism. .

Abstract

Background: A considerable amount of research has discussed whether autism and psychiatric/neurodevelopmental conditions in general are best described categorically or dimensionally. In recent years, finite mixture models have been increasingly applied to mixed populations of autistic and non-autistic individuals to answer this question. However, the use of such methods with mixed populations may not be appropriate for two reasons: First, subgroups within mixed populations are often skewed and thus violate mixture models assumptions, which are based on weighted sum of Gaussian distributions. Second, these analyses have, to our knowledge, been solely applied to enriched samples, where the prevalence of the clinical condition within the study sample far exceeds epidemiological estimates.

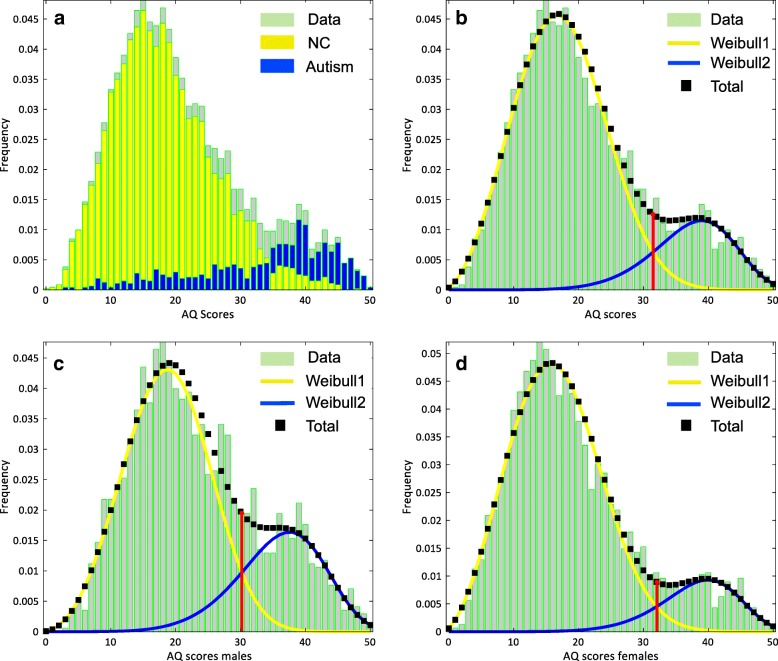
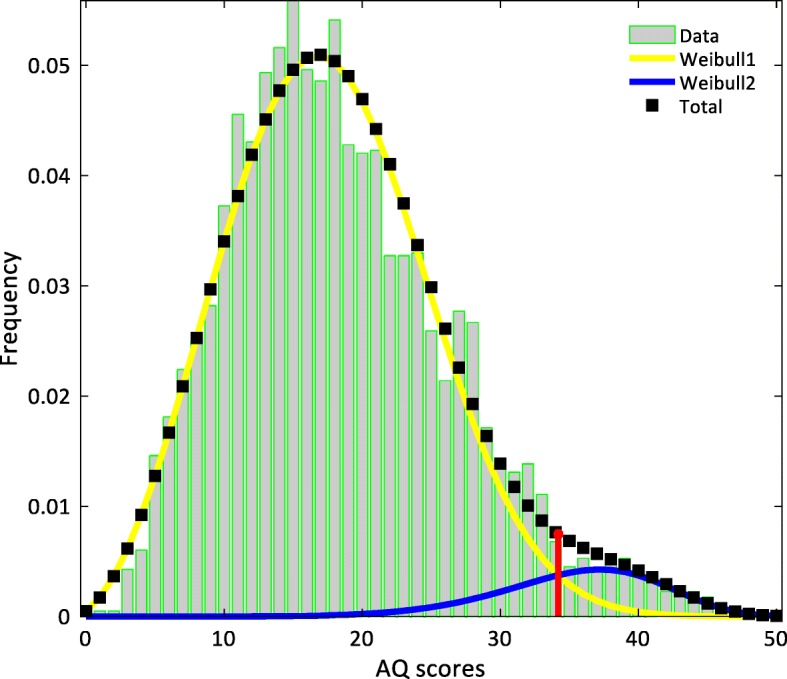
Method: We employed a dual Weibull mixture model to examine the distribution of the Autism Spectrum Quotient scores of a mixed sample of autistic and non-autistic adults (N = 4717; autism = 811), as well as of a derived sample (from the enriched sample; N = 3973; autism = 67) that reflects the current prevalence of autism within the general population.

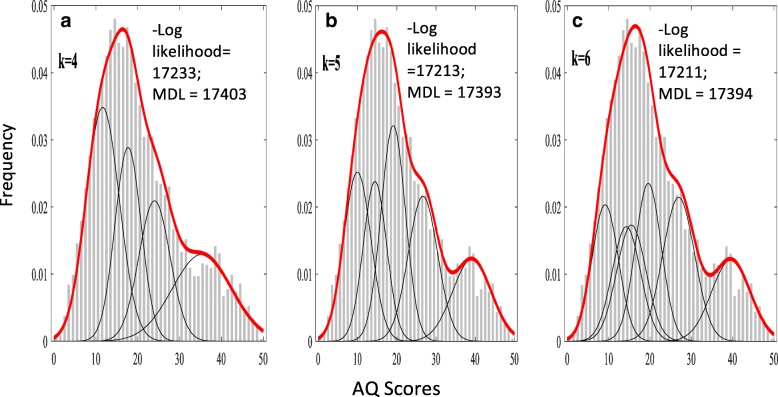
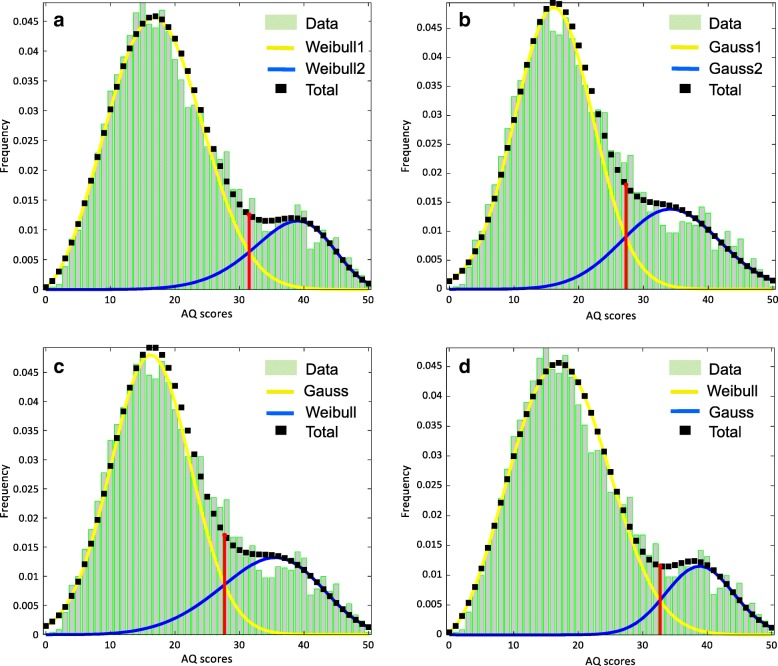
Results: In a mixed autistic and non-autistic population, our model provided a better description of the underlying structure of autistic traits than traditional finite Gaussian mixture models and performed well when applied to a sample that reflected the prevalence of autism in the general population. The model yielded results, which are consistent with predictions of current theories advocating for the co-existence of a mixed categorical and dimensional architecture within the autism spectrum.

Conclusion: The results provide insight into the continuum nature of the distribution of autistic traits, support the complementary role of both categorical and dimensional approaches to autism spectrum condition, and underscore the importance of analyzing samples that reflect the epidemiological prevalence of the condition. Owing to its flexibility to represent a wide variety of distributions, the Weibull distribution might be better suited for latent structure studies, within enriched and prevalence-true samples.


Conflict of interest statement

Competing interestsThe authors declare that they have no competing interests.

Figures

Fig. 1
Fig. 1
a The distribution of the AQ scores broken down according to diagnosis, neurotypical controls (NC; N = 3906), and autism groups (N = 811). b The histogram of the AQ scores of the overall sample (N = 4717) and the results of dual Weibull distribution model. c The histogram of the males’ AQ scores (NC = 1344; autism = 357) and the results of the dual Weibull distribution model. d The histogram of the females’ AQ scores (N = 2562; autism = 454) and the results of the dual Weibull distribution model. bd The black dotted line represents the total model; the yellow and blue lines represent the Weibull1 (left) and Weibull2 (right) distributions, respectively. The red line indicates the intersection (cutoff) point between the two distributions. Each of the depicted plots (bd) is of the bootstrapped sample whose threshold is closest to the mean threshold of all bootstrapped samples. We interpret the intersection point as the threshold score between the autistic individuals and the neurotypical controls
Fig. 2
Fig. 2
Subgrouping using the method by Figueiredo and Jain of finite mixture models with a weighted sum of Gaussian distributions. Depending on initialization, the models produced 4, 5, and 6 classes (k = 4, k = 5, k = 6) (number of Gaussian distributions; see black lines in panels a-c), which is likely due to compensation for deviations in the distribution of the data from the standard Gaussian distribution assumed by the model. Note that the model progressively improves the fit, as indicated by the decreasing likelihood values, with increasing number of components. However, the minimum description length (MDL), utilized by the Figueiredo and Jain method, indicated that the 5-component model is the most optimal model for the data
Fig. 3
Fig. 3
Comparison of the dual Weibull with the dual Gauss, Gaus-Weibull, and Weibull-Gauss distribution models. a The results of the dual Weibull distribution model (same as Fig. 1b). b The results of the dual Gauss distribution model. c The results of the Gauss-Weibull distribution model. d The results of the Weibull-Gauss distribution model. Each of the depicted plots (ad) is of the bootstrapped sample whose threshold is closest to the mean threshold of all bootstrapped samples
Fig. 4
Fig. 4
Histogram of the prevalence-true sample and the results of the dual Weibull distribution model. Black dotted line represents the total model; yellow and blue lines represent the Weibull1 and Weibull2 distributions, respectively. The red line indicates the intersection point between the two distributions. The depicted plot is of the bootstrapped sample whose threshold was closest to the mean threshold of all bootstrapped samples. We interpret the intersection point as the threshold score between autistic and neurotypical individuals, estimated at about 34 on the AQ scale

References

    1. Baio J, Wiggins L, Christensen DL, Maenner MJ, Daniels J, Warren Z, et al. Prevalence of autism spectrum disorder among children aged 8 years - autism and developmental disabilities monitoring network, 11 sites, United States, 2014. MMWR Surveill Summ. 2018;67(6):1–23. doi: 10.15585/mmwr.ss6706a1. - DOI - PMC - PubMed
    1. APA. Diagnostic and statistical manual of mental disorders (DSM-5®). Washington: American Psychiatric Association; 2013.
    1. Frazier TW, Youngstrom EA, Sinclair L, Kubu CS, Law P, Rezai A, et al. Autism spectrum disorders as a qualitatively distinct category from typical behavior in a large, clinically ascertained sample. Assessment. 2010;17(3):308–320. doi: 10.1177/1073191109356534. - DOI - PubMed
    1. Baron-Cohen S, Wheelwright S, Skinner R, Martin J, Clubley E. The autism-spectrum quotient (AQ): evidence from Asperger syndrome/high-functioning autism, males and females, scientists and mathematicians. J Autism Dev Disord. 2001;31(1):5–17. doi: 10.1023/A:1005653411471. - DOI - PubMed
    1. Austin EJ. Personality correlates of the broader autism phenotype as assessed by the Autism Spectrum Quotient (AQ) Personal Individ Differ. 2005;38(2):451–460. doi: 10.1016/j.paid.2004.04.022. - DOI

Publication types