. 2016;3(1):4.
doi: 10.1186/s40668-016-0017-2. Epub 2016 Aug 24.

In situ and in-transit analysis of cosmological simulations

Affiliations

In situ and in-transit analysis of cosmological simulations

Brian Friesen et al. Comput Astrophys Cosmol. 2016.

Abstract

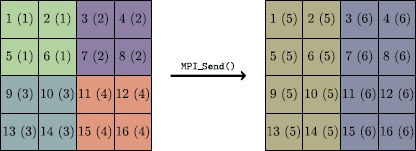
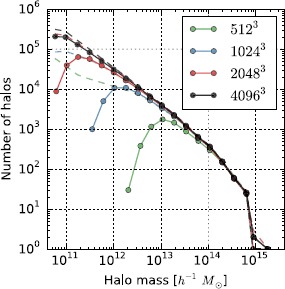
Modern cosmological simulations have reached the trillion-element scale, rendering data storage and subsequent analysis formidable tasks. To address this circumstance, we present a new MPI-parallel approach for analysis of simulation data while the simulation runs, as an alternative to the traditional workflow consisting of periodically saving large data sets to disk for subsequent 'offline' analysis. We demonstrate this approach in the compressible gasdynamics/N-body code Nyx, a hybrid MPI + OpenMP code based on the BoxLib framework, used for large-scale cosmological simulations. We have enabled on-the-fly workflows in two different ways: one is a straightforward approach consisting of all MPI processes periodically halting the main simulation and analyzing each component of data that they own ('in situ'). The other consists of partitioning processes into disjoint MPI groups, with one performing the simulation and periodically sending data to the other 'sidecar' group, which post-processes it while the simulation continues ('in-transit'). The two groups execute their tasks asynchronously, stopping only to synchronize when a new set of simulation data needs to be analyzed. For both the in situ and in-transit approaches, we experiment with two different analysis suites with distinct performance behavior: one which finds dark matter halos in the simulation using merge trees to calculate the mass contained within iso-density contours, and another which calculates probability distribution functions and power spectra of various fields in the simulation. Both are common analysis tasks for cosmology, and both result in summary statistics significantly smaller than the original data set. We study the behavior of each type of analysis in each workflow in order to determine the optimal configuration for the different data analysis algorithms.

Keywords: cosmology; halo-finding; in situ; in-transit; post-processing; power spectra.


Figures

Algorithm 1
Algorithm 1
Data movement logic when sending distributed grid data from compute processes to sidecar processes via MPI.
Figure 1
Figure 1
Example schematic illustrating data movement of block-structured grids from the simulation MPI group to the sidecar group when running in-transit. Each Box is uniquely numbered, and Boxes shaded in the same color are located on the same MPI process, whose rank is identified in parentheses. In this example, a grid composed of 16 Boxes moves from a distribution across 4 processes, with 4 Boxes per process, to a new distribution across 2 processes, with 8 Boxes per process.
Figure 2
Figure 2
Illustration of merge trees and their relationships to isosurfaces. The top subfigure (a) illustrates the halo definition based on iso-density contours. Halos are regions above a density threshold tboundary (light gray region) whose maximum density exceeds thalo (dark gray regions). The bottom subfigure (b) shows the merge tree which corresponds to the level set parameters tboundary and thalo given in Figure 2(a). The black dots correspond to points on the same super-level set, with each representing a different connected component on that super-level set. The green dots indicate saddle points of the scalar function, while the red dots indicate local maxima.
Figure 3
Figure 3
Convergence of the halo mass function in Nyx simulations with the Reeber halo finding code. Solid lines demonstrate how Reeber’s distribution of halo masses change when increasing the spatial resolution in Nyx runs. As expected, we observe the differences only at the low-mass end, since coarse grids cannot capture well small halos, while the agreement on the high-mass end is good. The dashed lines show results of a FOF halo finder when the linking length parameter is chosen to match approximately the iso-density contour used in Reeber. FOF results are used as a validation here, showing that Reeber results converge to the ‘correct’ answer.
Figure 4
Figure 4
Power spectrum of Lyman- α flux from 3 Nyx simulations using the Gimlet analysis code, compared to observational data presented in Viel et al. ( 2013 ). The black line is the result of a ΛCDM cosmological model with the reionization history described in Haardt and Madau (2012). The blue and red lines are two WDM models, differing in their choice of dark matter particle mass: mDM=0.85keV (blue) and mDM=2.1keV (red).
Figure 5
Figure 5
Aggregate bandwidth (GiB/s) for writing 10-component simulation grids of varying sizes to Lustre. Each data point shows the statistical mean over 5 writes, with the standard deviation shown in error bars. The lack of data points for the 1283 and 2563 grids at large numbers of writers are configurations with more MPI processes than total Boxes, such that some portion of processes would write no data.
Figure 6
Figure 6
Total bandwidth during transfer of a 10-component 1,0243 grid (32,768 Boxes) among 8,192 total MPI processes, with varying sizes of compute and analysis groups. The standard deviation over 5 iterations is indicated with error bars.
Figure 7
Figure 7
Total bandwidth during transfer of 10-component grids of varying sizes from 7,168 compute MPI processes to 1,024 analysis MPI processes. The standard deviation over 5 iterations is indicated with error bars.
Figure 8
Figure 8
Performance of Reeber running in situ and in-transit with different distributions of MPI processes on a 5123 problem. The times indicated are wall clock seconds. We used two different in-transit configurations: once with a constant total number of 2,048 MPI processes (‘CT’), and once with a constant number of processes (2,048) devoted to simulation (‘CS’). Time to post-processes for the CS and CT in-transit configurations are nearly identical. The short-dashed purple line indicates the Nyx run time with 2,048 MPI processes without performing any analysis.
Figure 9
Figure 9
Same as Figure  8 , except with Gimlet. Time to post-processes for the CS and CT in-transit configurations are nearly identical.
Figure 10
Figure 10
Same as Figure  8 , except with Reeber running on the 1,0243 problem. The short-dashed purple line indicates the Nyx run time with 4,096 MPI processes without performing any analysis.
Figure 11
Figure 11
Same as Figure  9 , except with Gimlet running on the 1,0243 problem.

References

    1. Agranovsky A, et al. 2014 IEEE 4th Symposium on Large Data Analysis and Visualization (LDAV) 2014. Improved post hoc flow analysis via Lagrangian representations; pp. 67–75.
    1. Almgren AS, et al. CASTRO: a new compressible astrophysical solver. I. Hydrodynamics and self-gravity. Astrophys. J. 2010;715(2):1221–1238. doi: 10.1088/0004-637X/715/2/1221. - DOI
    1. Almgren AS, et al. Nyx: a massively parallel AMR code for computational cosmology. Astrophys. J. 2013;765(1):39. doi: 10.1088/0004-637X/765/1/39. - DOI
    1. Anderson L, et al. The clustering of galaxies in the SDSS-III baryon oscillation spectroscopic survey: baryon acoustic oscillations in the data releases 10 and 11 galaxy samples. Mon. Not. R. Astron. Soc. 2014;441(1):24–62. doi: 10.1093/mnras/stu523. - DOI
    1. Bennett JC, et al. SC ’12 Proceedings of the International Conference on High Performance Computing, Networking, Storage and Analysis. Los Alamitos: IEEE Comput. Soc.; 2012. Combining in-situ and in-transit processing to enable extreme-scale scientific analysis; pp. 49:1–49:9.