. 2019 Sep;49(9):1372-1379.
doi: 10.1002/eji.201848053. Epub 2019 Jun 7.

Single-cell transcriptomes of murine bone marrow stromal cells reveal niche-associated heterogeneity

Affiliations

Single-cell transcriptomes of murine bone marrow stromal cells reveal niche-associated heterogeneity

Richard K Addo et al. Eur J Immunol. 2019 Sep.

Abstract

Bone marrow (BM) stromal cells are important in the development and maintenance of cells of the immune system. Using single cell RNA sequencing, we here explore the functional and phenotypic heterogeneity of individual transcriptomes of 1167 murine BM mesenchymal stromal cells. These cells exhibit a tremendous heterogeneity of gene expression, which precludes the identification of defined subpopulations. However, according to the expression of 108 genes involved in the communication of stromal cells with hematopoietic cells, we have identified 14 non-overlapping subpopulations, with distinct cytokine or chemokine gene expression signatures. With respect to the maintenance of subsets of immune memory cells by stromal cells, we identified distinct subpopulations expressing Il7, Il15 and Tnfsf13b. Together, this study provides a comprehensive dissection of the BM stromal heterogeneity at the single cell transcriptome level and provides a basis to understand their lifestyle and their role as organizers of niches for the long-term maintenance of immune cells.

Keywords: bone marrow; cytokines; hematopoietic cells; single cell sequencing; stromal cells.


Conflict of interest statement

The authors declare no financial or commercial conflict of interest.

Figures
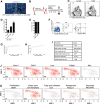
Figure 1
Figure 1
Isolation and single cell sequencing of ex vivo VCAM+CD45‐CD31‐Ter119‐ BM stromal cells. (A). In situ quantification of BM reticular stromal cells: DAPI+GFP+(VCAM‐1+CD31‐) reticular cells constituted 1.945% ± 0.1007 SEM of BM cells. Representative image of analysis of 30 histology sections from 5 different mice in 3 independent experiments. Scale bars: 100 and 50 µm,20x magnification (B) Schematic overview of isolation of BM stromal cells. (C) Representative dot plots of VCAM‐1 against CD45 gated on CD31‐Ter119‐Dapi‐ comparing isolation with or without Latrunculin B. (D) Frequencies of ex vivo BM VCAM‐1+ stromal cells isolated with or without addition of Latrunculin B compared to those determined in situ. (E) Frequencies of DAPI‐ (live) BM cells isolated with or without addition of Latrunculin B. (F) Representative plot of cytometric sorting of ex‐vivo BM VCAM‐1+CD45‐CD31‐Ter119‐ cells (G‐I) Quality assessment of the 10x genomic sequencing, showing sequencing saturation (G) and median genes per cell (H) against the mean reads per cell and the summary of the sequencing (I). (J) t‐SNE plots highlighting the expression (red) of individual BM stromal markers. (K) t‐SNE plots showing the expression (red) of genes associated with cellular function of proliferation (cell cycle) and metabolism in individual cells. Data from (C and E) represent pooled results from 4 independent experiments each with 3–5 mice per group. Data from E is extracted from results of experiments described in (A and C). The t‐SNE analyses shown in Fig. 1J and 1K are based on n = 1035 individual stromal cells.
Figure 2
Figure 2
Expression of genes encoding CD markers. The experimental procedure is the same as described in the legend of Fig. 1. (A) t‐SNE plots highlighting the distribution and expression (red) of genes encoding for surface markers. (B) Scatterplots; Co‐expression of CD genes as found by normalized unique molecular identifier‐counts (UMI‐counts) from sequencing. Co‐expression of genes were arcsinh‐transformed for flow cytometric‐like visualization, an artificial noise was subtracted to 0 counts .(C) Co‐expression of selected CD‐marker genes as defined by Jaccard similarity coefficient (Proportion of cells expressing two or at least one marker). The t‐SNE analysis shown in Fig. 2 is based on n = 1035 individual stromal cells.
Figure 3
Figure 3
Cytokine and chemokine expression is restricted to distinct subsets of stromal cells. The experimental procedure is the same as described in the legend of Fig. 1. (A) t‐SNE plots of supervised clustering of cells using 108 genes encoding secreted factors with known role in communication of stromal cells with cells of the hematopoietic system. Cells expressing a particular gene are highlighted in red (* Defines stable clusters as defined by Consensus Clustering based on random t‐SNEs and/or Consensus Clustering as proposed by Kiselev and colleagues 21). (B) Co‐expression of selected communication genes as defined by Jaccard similarity coefficient (Proportion of cells expressing two or at least one marker). (C) Comparisons of gene expression profiles expressing selected marker genes forming stable clusters. Fold change (FC) shows the log2 (Average Expression of positive cells) ‐ log2 (Average Expression of negative cells), displayed are the top 10 genes with the highest fold change. DiffExpTest‐method was used for the statistical analysis of differential expressed genes. The t‐SNE analysis shown in Fig. 3 is based on n = 1035 individual stromal cells.

References

    1. Sercan Alp, O. , Durlanik, S. , Schulz, D. , McGrath, M. , Grun, J. R. , Bardua, M. , Ikuta, K. et al., Memory CD8(+) T cells colocalize with IL‐7(+) stromal cells in bone marrow and rest in terms of proliferation and transcription. Eur. J. Immunol. 2015. 45: 975–987. - PMC - PubMed
    1. Tokoyoda, K. , Zehentmeier, S. , Hegazy, A. N. , Albrecht, I. , Grun, J. R. , Lohning, M. and Radbruch, A. , Professional memory CD4+ T lymphocytes preferentially reside and rest in the bone marrow. Immunity 2009. 30: 721–730. - PubMed
    1. Zehentmeier, S. , Roth, K. , Cseresnyes, Z. , Sercan, O. , Horn, K. , Niesner, R. A. , Chang, H. D. et al., Static and dynamic components synergize to form a stable survival niche for bone marrow plasma cells. Eur. J. Immunol. 2014. 44: 2306–2317. - PubMed
    1. Hanazawa, A. , Hayashizaki, K. , Shinoda, K. , Yagita, H. , Okumura, K. , Lohning, M. , Hara, T. et al., CD49b‐dependent establishment of T helper cell memory. Immunol. Cell Biol. 2013. 91: 524–531. - PubMed
    1. Hanazawa, A. , Lohning, M. , Radbruch, A. and Tokoyoda, K. , CD49b/CD69‐dependent generation of resting T helper cell memory. Front. Immunol. 2013. 4: 183. - PMC - PubMed

Publication types