. 2019 Jul;30(7):1001-1015.
doi: 10.1177/0956797619842261. Epub 2019 May 31.

Aversive Imagery Causes De Novo Fear Conditioning

Affiliations

Aversive Imagery Causes De Novo Fear Conditioning

Erik M Mueller et al. Psychol Sci. 2019 Jul.

Abstract

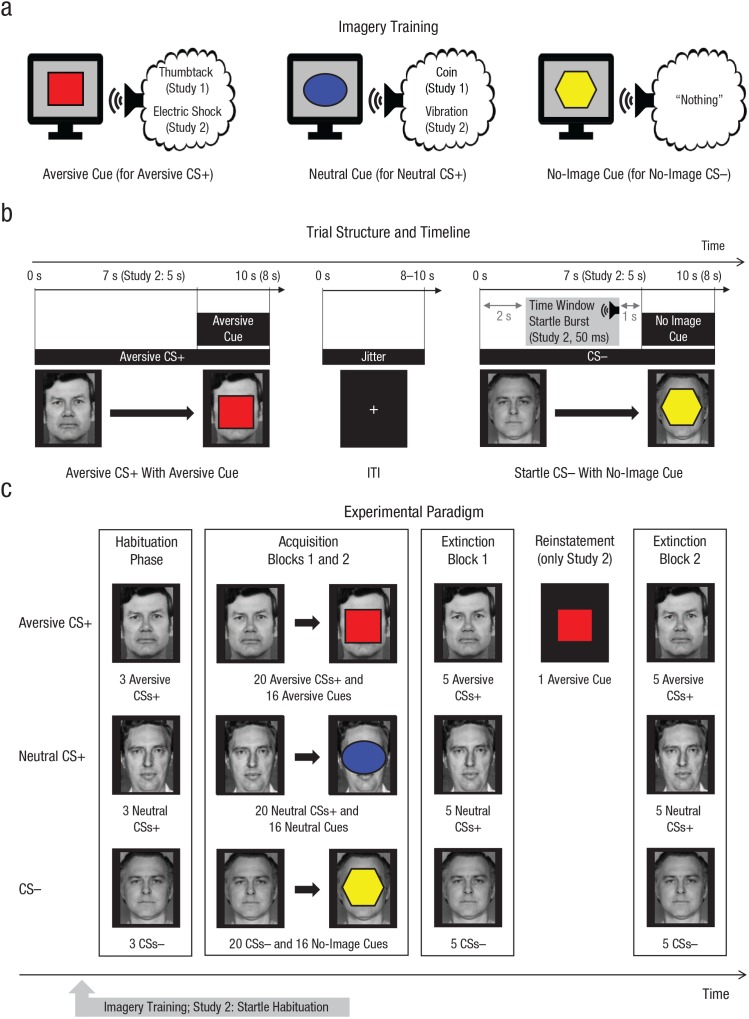
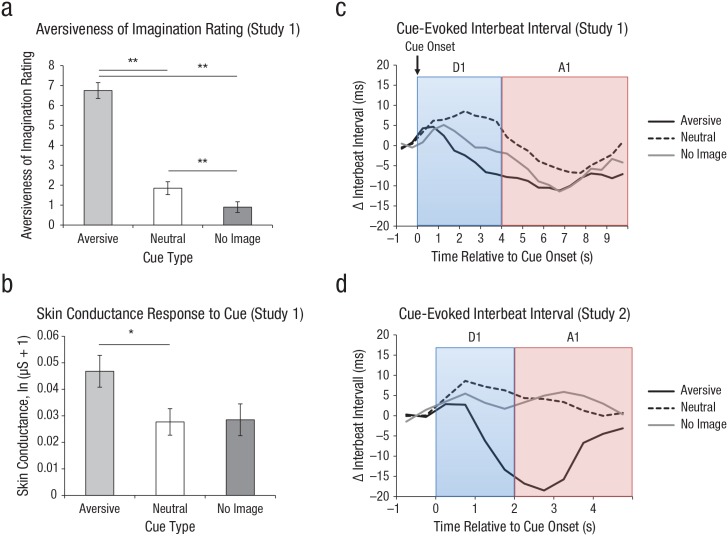
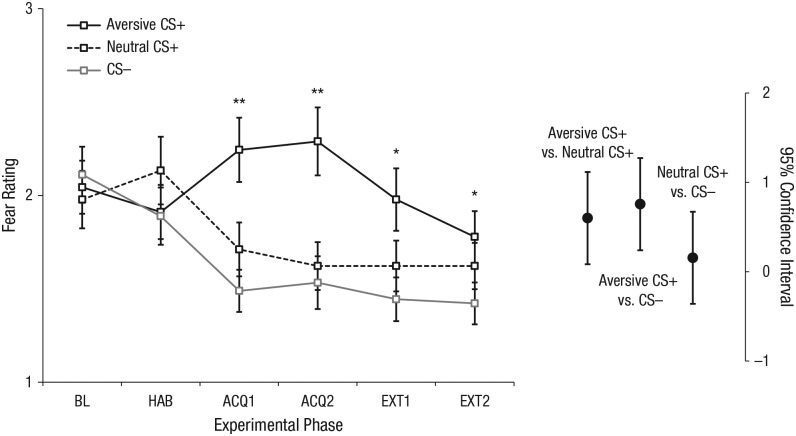
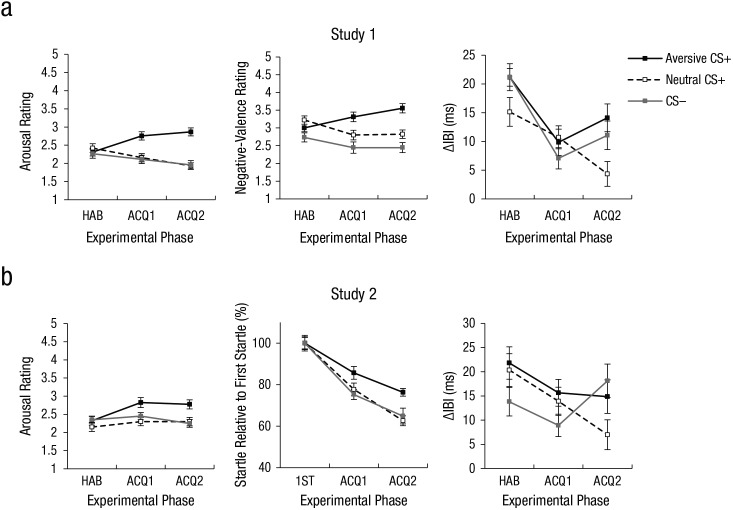
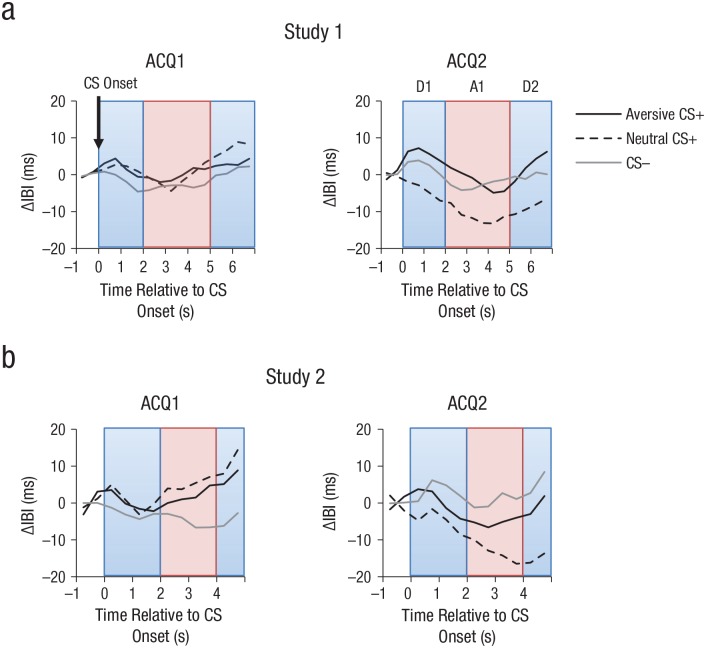
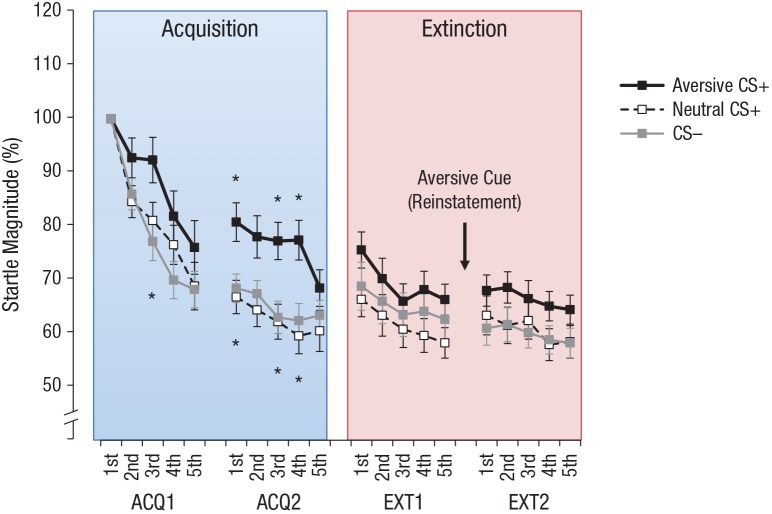
In classical fear conditioning, neutral conditioned stimuli that have been paired with aversive physical unconditioned stimuli eventually trigger fear responses. Here, we tested whether aversive mental images systematically paired with a conditioned stimulus also cause de novo fear learning in the absence of any external aversive stimulation. In two experiments (N = 45 and N = 41), participants were first trained to produce aversive, neutral, or no imagery in response to three different visual-imagery cues. In a subsequent imagery-based differential-conditioning paradigm, each of the three cues systematically coterminated with one of three different neutral faces. Although the face that was paired with the aversive-imagery cue was never paired with aversive external stimuli or threat-related instructions, participants rated it as more arousing, unpleasant, and threatening and displayed relative fear bradycardia and fear-potentiated startle. These results could be relevant for the development of fear and related disorders without trauma.

Keywords: aversive conditioning; eyeblink reflex; fear; fear conditioning; imagery; open data, open materials.


Conflict of interest statement

Declaration of Conflicting Interests: The author(s) declared that there were no conflicts of interest with respect to the authorship or the publication of this article.

Figures

Fig. 1.
Fig. 1.
Schematic depiction of the experimental protocol used in both studies. During imagery training (a), participants were informed of the association between cues (e.g., square, ellipse, hexagon) and imagery scenarios of aversive valence (e.g., stepping on a thumbtack) or neutral valence (e.g., stepping on a coin). In a third condition, participants were instructed not to imagine anything. In Study 2, a circle and a triangle were used instead of the ellipse and hexagon cues, respectively. During the imagery-based differential-conditioning procedure (b), each of three neutral faces (aversive conditioned stimulus, or CS+, neutral CS+, and CS–) was paired with the corresponding cue (aversive cue, neutral cue, no-image cue). All conditioned stimuli (CSs) were presented for 10 s (Study 1) or 8 s (Study 2). CS presentations coterminated with the imagery cue centrally superimposed on the CS for the last 3 s in 80% of the trials. In Study 2, acoustic startle probes were presented during 50% of CS presentations (potential window: 2–4 s after CS onset, i.e., prior to the onset of the imagery cue) and during six intertrial intervals (ITIs). The number and stimuli types used during the habituation, acquisition, and extinction phases are shown in (c). The extinction phase was identical to the acquisition phase, except that the imagery cues were never shown. In Study 2, participants saw the aversive-imagery cue once between two extinction blocks (reinstatement cue).
Fig. 2.
Fig. 2.
Responses to imagery cues. The mean unpleasantness rating of mental images in Study 1 is shown in (a) for responses to each of the three cue types. Ratings were made on an 11-point Likert-type scale ranging from 0 (not at all) to 10 (extremely unpleasant). Mean skin conductance response to each cue type in Study 1 is shown in (b). Error bars in (a) and (b) show repeated measures standard errors of the mean (Masson & Loftus, 2003), and asterisks indicate significant differences between cue types (*p < .05, **p < .001). Mean evoked heart interbeat interval is shown for Study 1 (c) and Study 2 (d), separately for each cue type during the deceleration time window (D1) and the acceleration time window (A1).
Fig. 3.
Fig. 3.
Fear ratings in Study 1. The graph on the left shows participants’ mean ratings of experienced fear when viewing each conditioned stimulus (CS) type during baseline (BL), habituation (HAB), the first acquisition block (ACQ1), the second acquisition block (ACQ2), the first extinction block (EXT1), and the second extinction block (EXT2). Ratings were made on a 5-point Likert-type scale ranging from 1 (not fearful) to 5 (very fearful). Error bars show repeated measures standard errors of the mean (Masson & Loftus, 2003), and asterisks indicate significant differences between CS types (*p < .05, **p < .001). On the right, 95% confidence intervals (CIs) are shown for the between-conditions differences during acquisition (collapsed across ACQ1 and ACQ2; Cumming, 2014).
Fig. 4.
Fig. 4.
Responses to conditioned stimuli (CSs). Mean arousal rating, negative-valence rating, and CS-evoked interbeat interval (IBI) in Study 1 are shown in the top row, and mean arousal rating, startle response, and CS-evoked IBI in Study 2 are shown in the bottom row. Startle response was normalized relative to the first startle response during acquisition. In all graphs, results are shown for each CS type during three phases: habituation (HAB), first acquisition block (ACQ1), and second acquisition block (ACQ2). CS-evoked IBIs are shown only for the deceleration time window (D1). Error bars show repeated measures standard errors of the mean (Masson & Loftus, 2003).
Fig. 5.
Fig. 5.
Mean evoked interbeat interval (IBI) in Study 1 (a) and Study 2 (b) in response to each of the three conditioned stimulus (CS) types during the deceleration time windows (D1 and D2) and the acceleration time window (A1). Results are shown separately for the first acquisition block (ACQ1) and second acquisition block (ACQ2).
Fig. 6.
Fig. 6.
Mean normalized single-trial eyelid startle responses to the 85-dB noise burst as a function of the conditioned stimulus (CS) type during the first acquisition block (ACQ1), second acquisition block (ACQ2), first extinction block (EXT1), and second extinction block (EXT2). The aversive cue was presented between EXT1 and EXT2 to test for reinstatement of fear. Error bars show repeated measures standard errors of the mean (Masson & Loftus, 2003). Asterisks above the lines indicate significant differences between the aversive CS+ and the neutral CS+, and asterisks below the lines indicate significant differences between the aversive CS+ and the CS– (p < .05, two tailed).

References

    1. Arabian J. M. (1982). Imagery and Pavlovian heart rate decelerative conditioning. Psychophysiology, 19, 286–293. doi:10.1111/j.1469-8986.1982.tb02565.x - DOI - PubMed
    1. Benedek M., Kaernbach C. (2010. a). A continuous measure of phasic electrodermal activity. Journal of Neuroscience Methods, 190, 80–91. doi:10.1016/j.jneumeth.2010.04.028 - DOI - PMC - PubMed
    1. Benedek M., Kaernbach C. (2010. b). Decomposition of skin conductance data by means of nonnegative deconvolution. Psychophysiology, 47, 647–658. doi:10.1111/j.1469-8986.2009.00972.x - DOI - PMC - PubMed
    1. Blumenthal T. D., Cuthbert B. N., Filion D. L., Hackley S., Lipp O. V., van Boxtel A. (2005). Committee report: Guidelines for human startle eyeblink electromyographic studies. Psychophysiology, 42, 1–15. doi:10.1111/j.1469-8986.2005.00271.x - DOI - PubMed
    1. Cumming G. (2014). The new statistics: Why and how. Psychological Science, 25, 7–29. doi:10.1177/0956797613504966 - DOI - PubMed

LinkOut - more resources