. 2019 May 30;177(6):1436-1447.e12.
doi: 10.1016/j.cell.2019.05.009.

BMAL1-Driven Tissue Clocks Respond Independently to Light to Maintain Homeostasis

Affiliations

BMAL1-Driven Tissue Clocks Respond Independently to Light to Maintain Homeostasis

Patrick-Simon Welz et al. Cell. .

Erratum in

  • BMAL1-Driven Tissue Clocks Respond Independently to Light to Maintain Homeostasis.
    Welz PS, Zinna VM, Symeonidi A, Koronowski KB, Kinouchi K, Smith JG, Guillén IM, Castellanos A, Furrow S, Aragón F, Crainiciuc G, Prats N, Caballero JM, Hidalgo A, Sassone-Corsi P, Benitah SA. Welz PS, et al. Cell. 2019 Aug 8;178(4):1029. doi: 10.1016/j.cell.2019.07.030. Cell. 2019. PMID: 31398328 Free PMC article. No abstract available.

Abstract

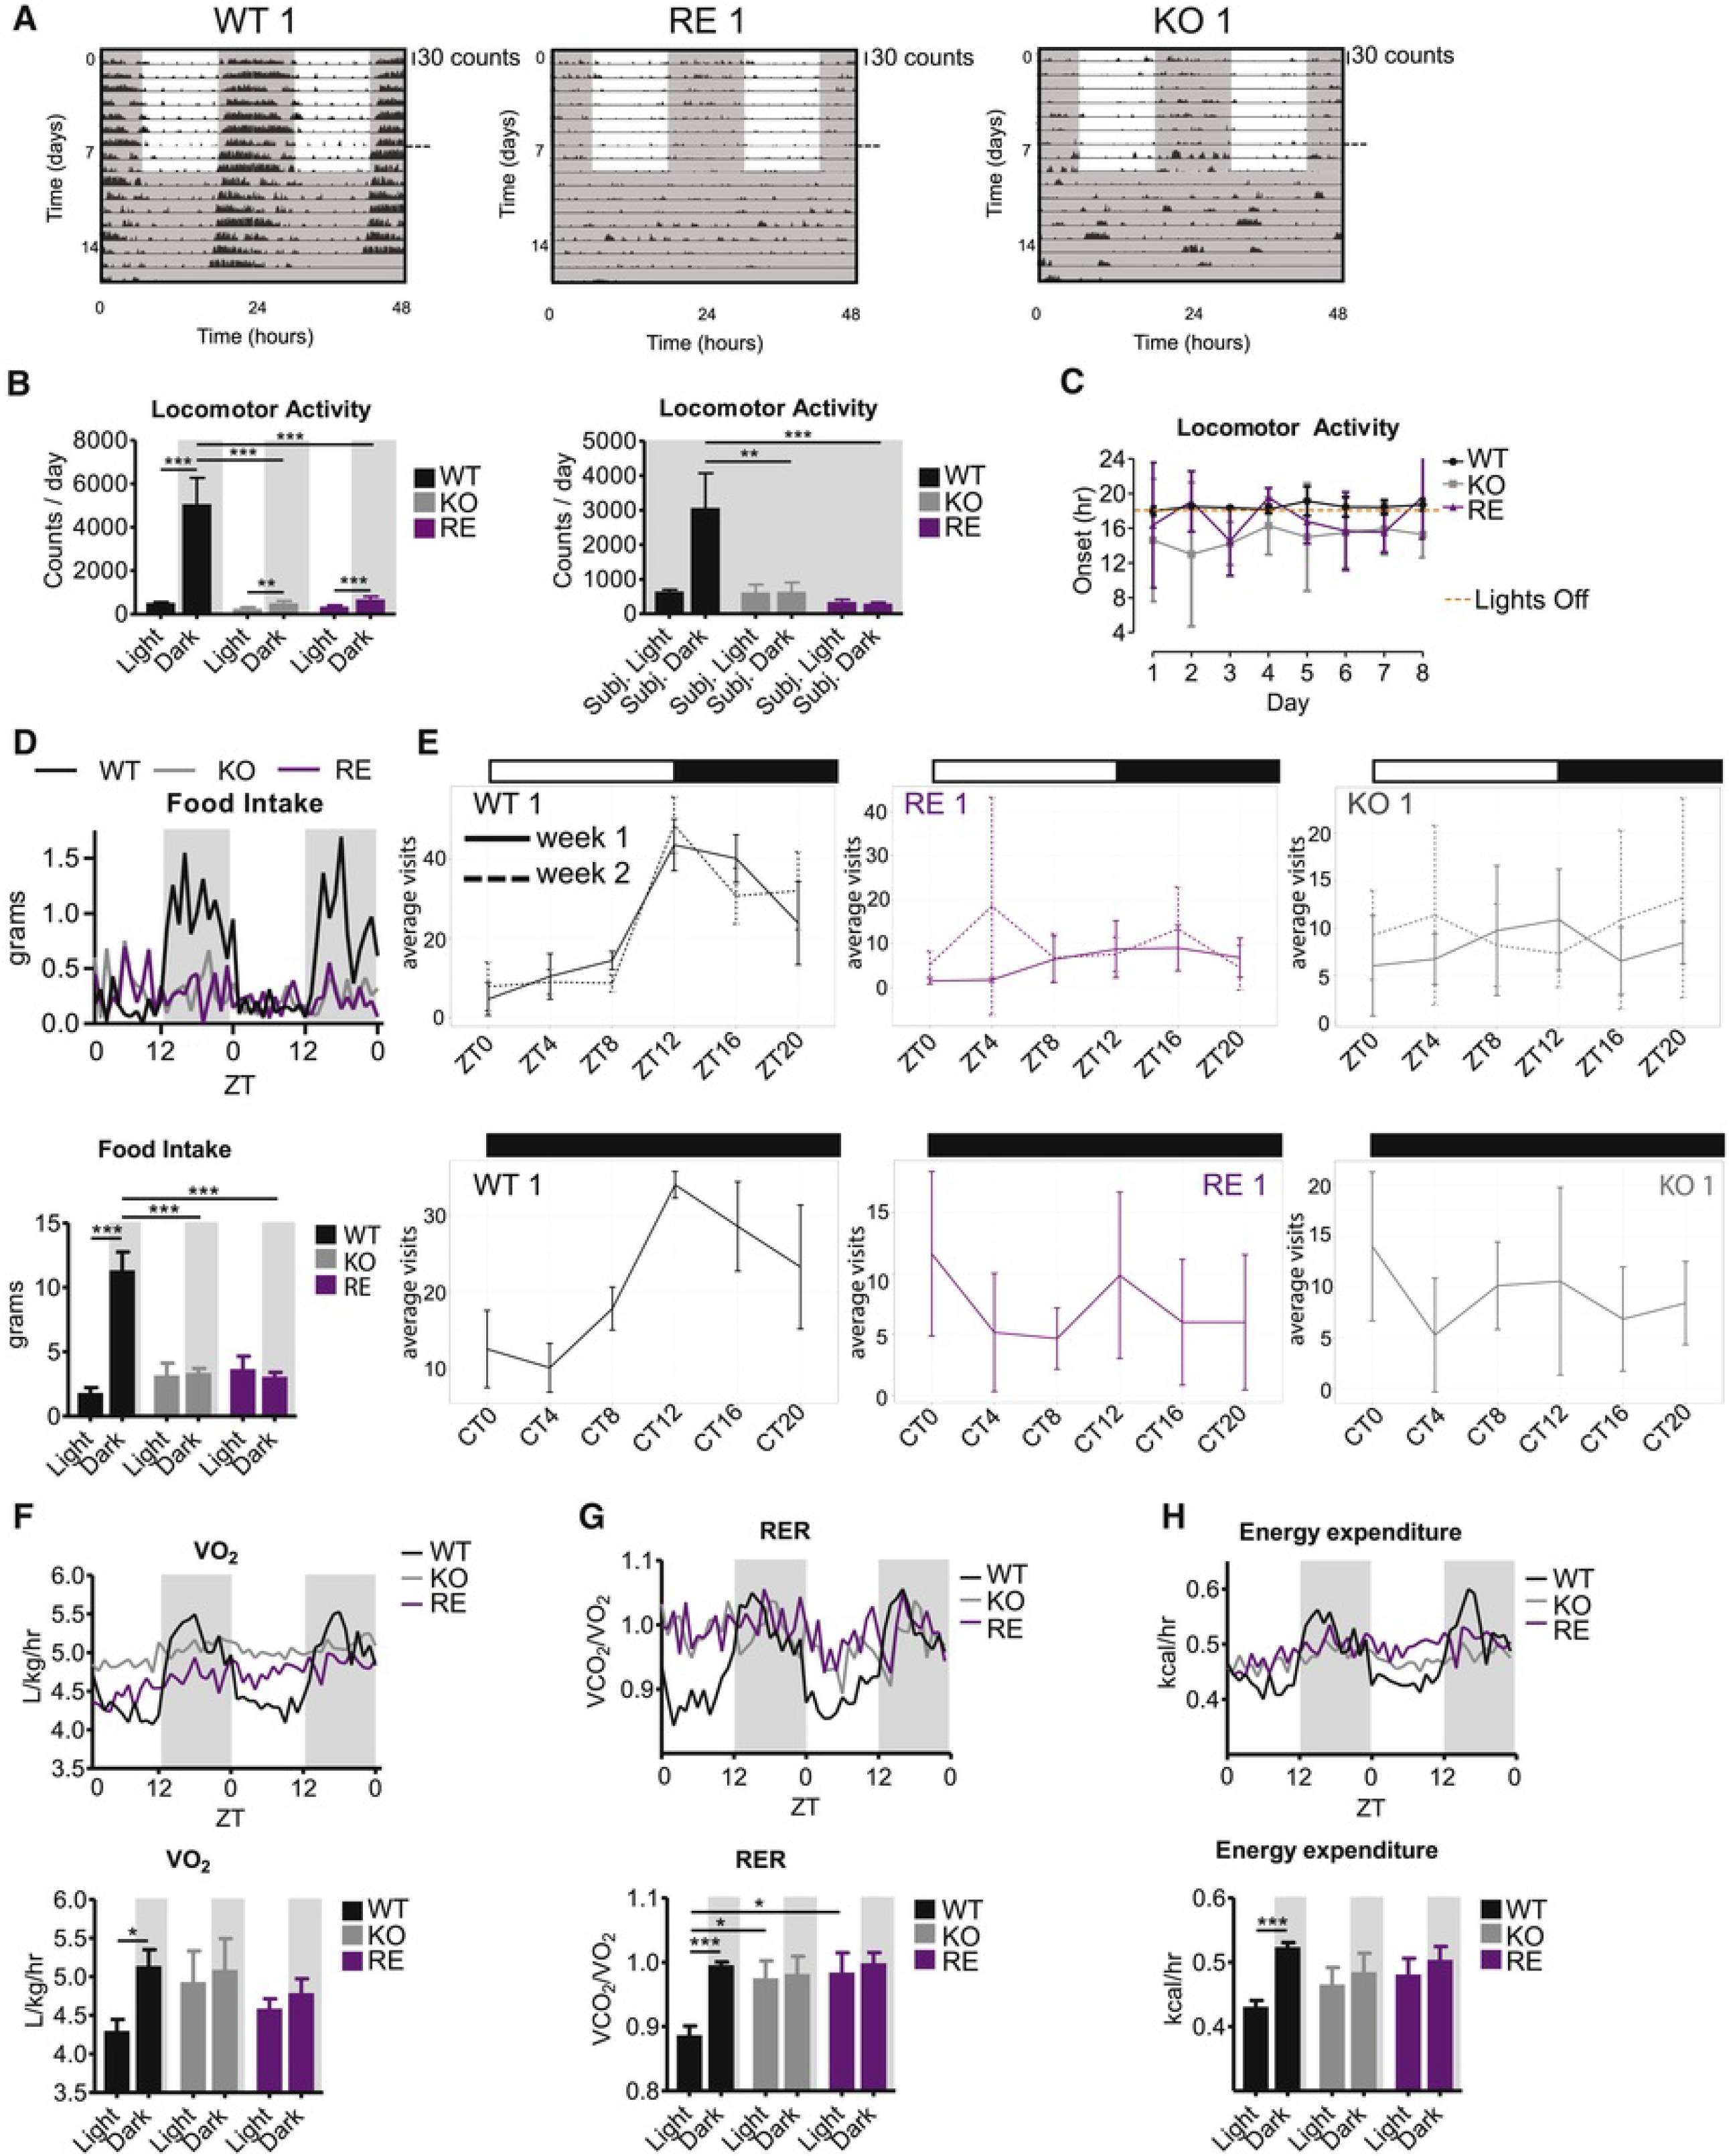
Circadian rhythms control organismal physiology throughout the day. At the cellular level, clock regulation is established by a self-sustained Bmal1-dependent transcriptional oscillator network. However, it is still unclear how different tissues achieve a synchronized rhythmic physiology. That is, do they respond independently to environmental signals, or require interactions with each other to do so? We show that unexpectedly, light synchronizes the Bmal1-dependent circadian machinery in single tissues in the absence of Bmal1 in all other tissues. Strikingly, light-driven tissue autonomous clocks occur without rhythmic feeding behavior and are lost in constant darkness. Importantly, tissue-autonomous Bmal1 partially sustains homeostasis in otherwise arrhythmic and prematurely aging animals. Our results therefore support a two-branched model for the daily synchronization of tissues: an autonomous response branch, whereby light entrains circadian clocks without any commitment of other Bmal1-dependent clocks, and a memory branch using other Bmal1-dependent clocks to "remember" time in the absence of external cues.


Conflict of interest statement

Declaration of Interests

The authors declare no competing interests.

Figures

Figure 1
Figure 1
Light Can Entrain Peripheral Clocks Independently from Each Other (A) The Bmal1-stopFL/K14-Cre mouse model allows Bmal1 to be expressed exclusively in K14+ cells (RE); heterozygous K14-Cre (WT) and homozygous Bmal1-stopFL KO mice were used as controls. (B) Schematic of experimental setup to obtain circadian transcriptome of the epidermis; interfollicular epidermis was isolated at six time points around the clock in 8-week-old WT, RE, and KO females and submitted to RNA sequencing to establish thecircadian transcriptome, which was determined by using JTK_CYCLE algorithm. (C) Core clock genes in epidermis from WT, RE, or KO mice kept under L/D entrainment (n = 3 or 4 mice per time point and genotype); adjusted p value for RE epidermis according to JTK_CYCLE is shown; expression value for each individual sample is shown. (D and E) Phase (D) and amplitude (E) of core clock genes in WT and RE epidermis. (F) Immunoblot of BMAL1, phosphorylated BMAL1 (p-BMAL1), and acetylated BMAL1 (ac-BMAL1) in WT or RE epidermis; ACTIN was used as loading control. (G) Core clock genes in liver tissue from WT, liver-RE (Bmal1 expression exclusively in Alfp-Cre-expressing cells), or KO mice kept under L/D entrainment (n = 3 or 4 mice per time point and genotype); data are represented as mean ± SD. See also Table S3.
Figure 2
Figure 2
Tissue-Autonomous Function of Epidermal Clock Is Preserved in the Absence of Non-epidermal Circadian Rhythmicity (A) Pie diagram showing circadian genes in WT epidermis and their overlap with circadian genes expressed in RE and KO epidermis. See also Figure S2A and Table S3. (B) Heatmaps representing expression levels of circadian genes in the indicated genotypes. (C) Phase distribution of all circadian genes in WT or, RE epidermis. (D) Phase distribution of genes that are circadian in both WT and RE epidermis. See also Figure S2B. (E) Amplitude of all circadian genes in WT or RE epidermis (p = 0.54). (F) Amplitude of genes that are circadian in both WT and RE epidermis (p = 1.2 × 10⁻⁴). See also Figure S2C. (G–I) Representative GO terms for genes that are circadian in the epidermis of both WT and RE mice (G), only in WT mice (H), or in all three genotypes of mice analyzed (WT, RE and KO) (I). See also Figures S2 and Tables S1 and S3.
Figure 3
Figure 3
Non-epidermal Clocks Are Required to Maintain Full Circadian Behavioral Activity in Light-Entrainment Conditions (A and B) Locomotor activity in L/D cycle and constant darkness (D/D). Joint data of two experiments: for the first measurement mice were kept in L/D for 7 days, and for the second measurement mice were kept in L/D for 2 days and afterwards for 7 days in D/D. Joining of the two measurements is marked by a horizontal dashed line. (A) Data for representative animals duplicated over 2 days for visualization; scale bar, 30 counts. (B) Group quantification, L/D: n(WT) = 5, n(KO) = 5, n(RE) = 4; D/D: n(WT) = 3, n(KO) = 4, n(RE) = 3. Two-way ANOVA, *p < 0.01, ***p < 0.001; data are represented as mean ± SEM. See also Figure S3A. (C) Locomotor activity onset in L/D as determined by Clocklab. n(WT) = 5, n(KO) = 5, n(RE) = 4; data are represented as mean ± SD. See also Figure S3B. (D) and F–H) Metabolic cage assessment of ad libitum fed mice in L/D for 2 days. Traces of group averages are shown on top, and light phase (ZT0–12)/dark phase (ZT12–24) averages are quantified below. RER, respiratory exchange ratio. Food intake and energy expenditure: n = 4 in all genotypes; VO2 and RER: n(WT) = 5, n(KO) = 5, n(RE) = 4; two-way ANOVA, *p < 0.05; ***p< 0.001. See also Figure S3C. (E) Top: behavioral activity in L/D over 24 h measured as average visits per day to the drinking bottles of each individual WT, RE, or KO mouse over 2 weeks (shown as average visits within 4-h bins over all days from each week). Bottom: behavioral activity measured as visits to drinking bottles by individual WT, RE, and KO mice kept in D/D. Data are represented as mean ± SD. See also Figure S3D. See also Figure S3.
Figure 4
Figure 4
Non-epidermal Clocks Are Required to Maintain Rhythmicity in the Epidermis in the Absence of Light (A) Schematic of experimental setup for obtaining the circadian transcriptome after 6–7 days in darkness; the interfollicular epidermis was isolated at six time points around the clock from 8-week-old WT, RE, and KO females that were kept in complete darkness for 156–176 h and submitted to RNA-seq to establish the circadian transcriptome, which was determined by using JTK_CYCLE. (B) Core clock genes in WT, RE, and KO epidermis after 6–7 days in the dark (n = 3 or 4 mice per genotype and time point); adjusted p value for RE epidermis according to JTK_CYCLE; data are represented as mean ± SD. (C) Pie diagram showing circadian genes after 6–7 days in darkness in WT epidermis and the overlap with circadian genes in RE and KO. See also Figure S4A and Table S4. (D) Heatmap representing expression levels of circadian genes in WT. (E) Representative GO terms for genes that are circadian only in WT epidermis; full lists of GO terms available in Table S2. See also Figure S4 and Tables S2 and S4.
Figure 5
Figure 5
Epidermal BMAL1 Is Required to Prevent Increased Differentiation (A) Kaplan Meier survival curve for WT, RE, and KO mice (no significant difference between KO and RE, p = 0.2730). (B) Weight curve for WT, RE, and KO mice; data are represented as mean ± SD. (C) Epidermal cornification measured as thickness of cornified layer; p(RE versus WT) = 1.97 × 10⁻³, p(RE versus KO) = 1.33 × 10⁻⁶, p(WT versus KO) = 8.79 × 10⁻¹⁰); data are represented as mean ± SD; scale bar, 100 μm. (D) Venn diagram showing the overlap between genes that are significantly up- or downregulated in KO or RE epidermis as compared to WT epidermis using 8-week-old mice under L/D conditions (n = 23 each for KO and RE). (E) Gene expression heatmap of markers that describe different populations of keratinocytes according to their differentiation status in WT, RE, or KO epidermis of 8-week-old females. (F) Expression level of markers that describe different populations of keratinocytes according to their differentiation status that are significantly up- or downregulated in epidermis from both RE and KO mice as compared to WT mice. (G) Representative images of intensity levels of KERATIN 14 (marker for basal cell layer) and LORICRIN (marker for epidermal differentiation); scale bar, 50μm. See also Figure S5.

References

    1. Albrecht U, Timing to perfection: the biology of central and peripheral circadian clocks, Neuron 74, 2012, 246–260. - PubMed
    1. Bankhead P, Loughrey MB, Fernández JA, Dombrowski Y, McArt DG, Dunne PD, McQuaid S, Gray RT, Murray LJ, Coleman HG, et al., QuPath: Open source software for digital pathology image analysis, Sci. Rep. 7, 2017, 16878. - PMC - PubMed
    1. Bechtold DA and Loudon AS, Hypothalamic clocks and rhythms in feeding behaviour, Trends Neurosci. 36, 2013, 74–82. - PubMed
    1. Bolger AM, Lohse M and Usadel B, Trimmomatic: a flexible trimmer for Illumina sequence data, Bioinformatics 30, 2014, 2114–2120. - PMC - PubMed
    1. Bunger MK, Wilsbacher LD, Moran SM, Clendenin C, Radcliffe LA, Hogenesch JB, Simon MC, Takahashi JS and Bradfield CA, Mop3 is an essential component of the master circadian pacemaker in mammals, Cell 103, 2000, 1009–1017. - PMC - PubMed

Publication types