. 2019 May 30;177(6):1583-1599.e16.
doi: 10.1016/j.cell.2019.05.007.

A Public BCR Present in a Unique Dual-Receptor-Expressing Lymphocyte from Type 1 Diabetes Patients Encodes a Potent T Cell Autoantigen

Affiliations

A Public BCR Present in a Unique Dual-Receptor-Expressing Lymphocyte from Type 1 Diabetes Patients Encodes a Potent T Cell Autoantigen

Rizwan Ahmed et al. Cell. .

Abstract

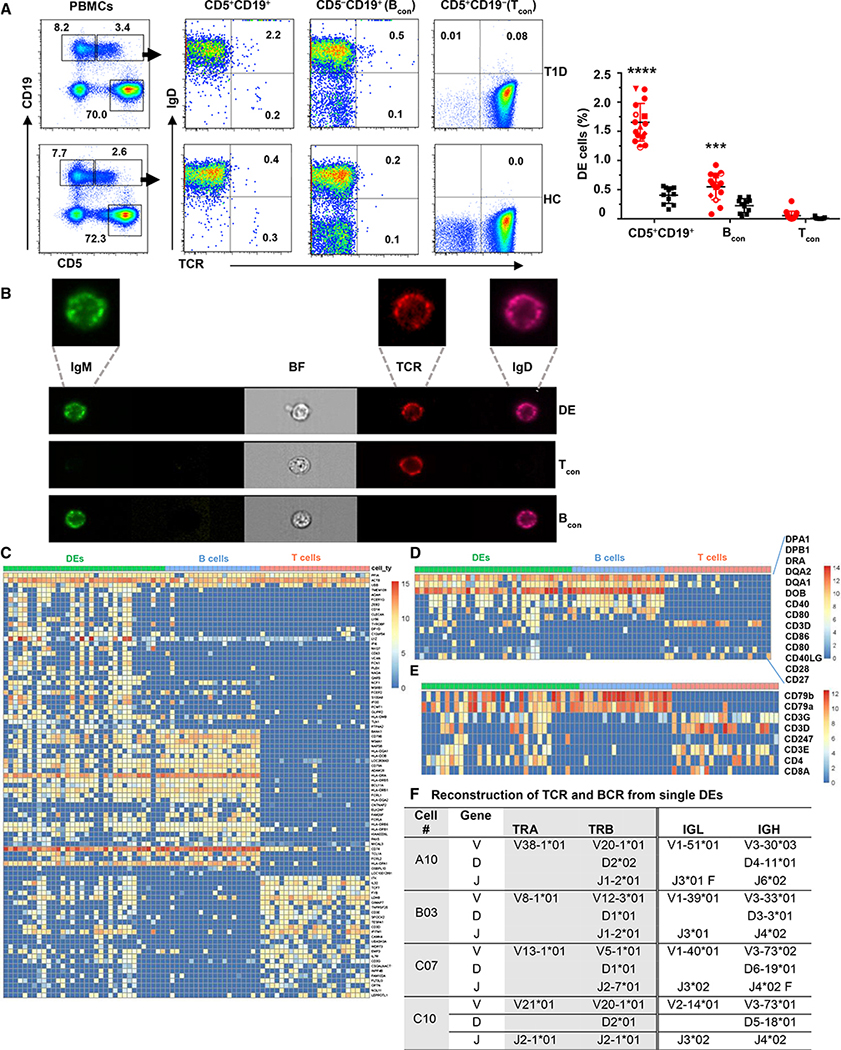
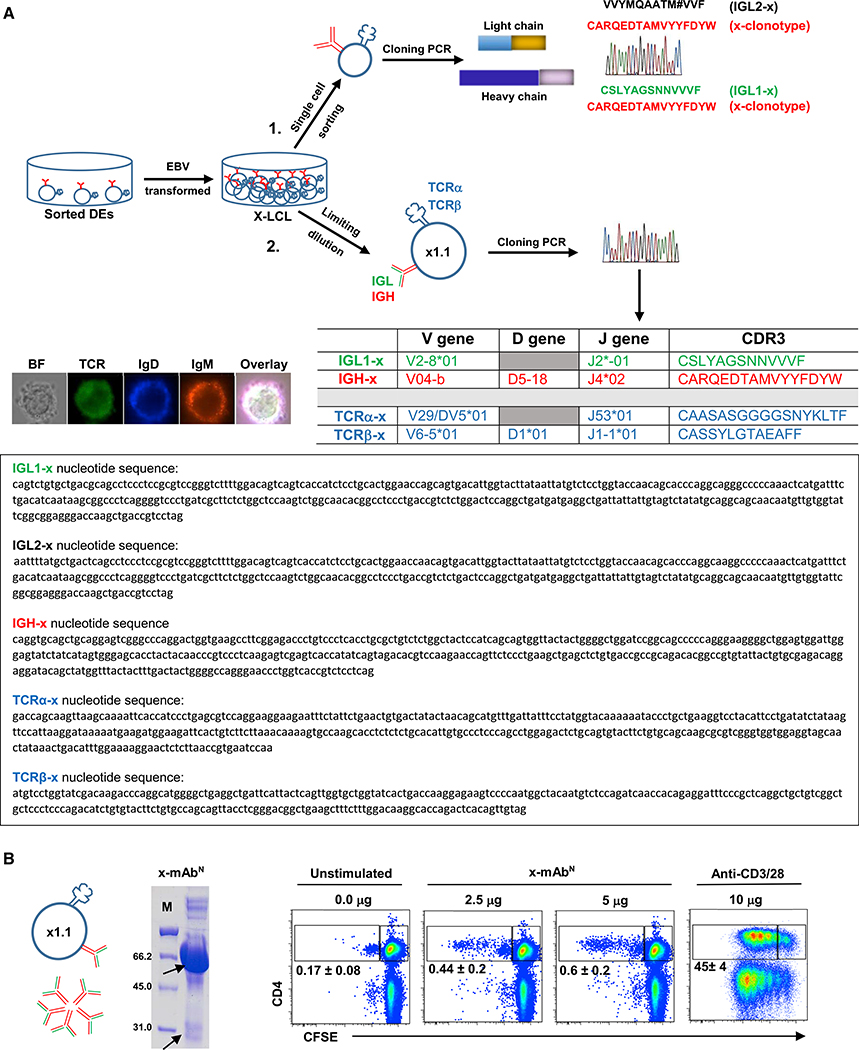
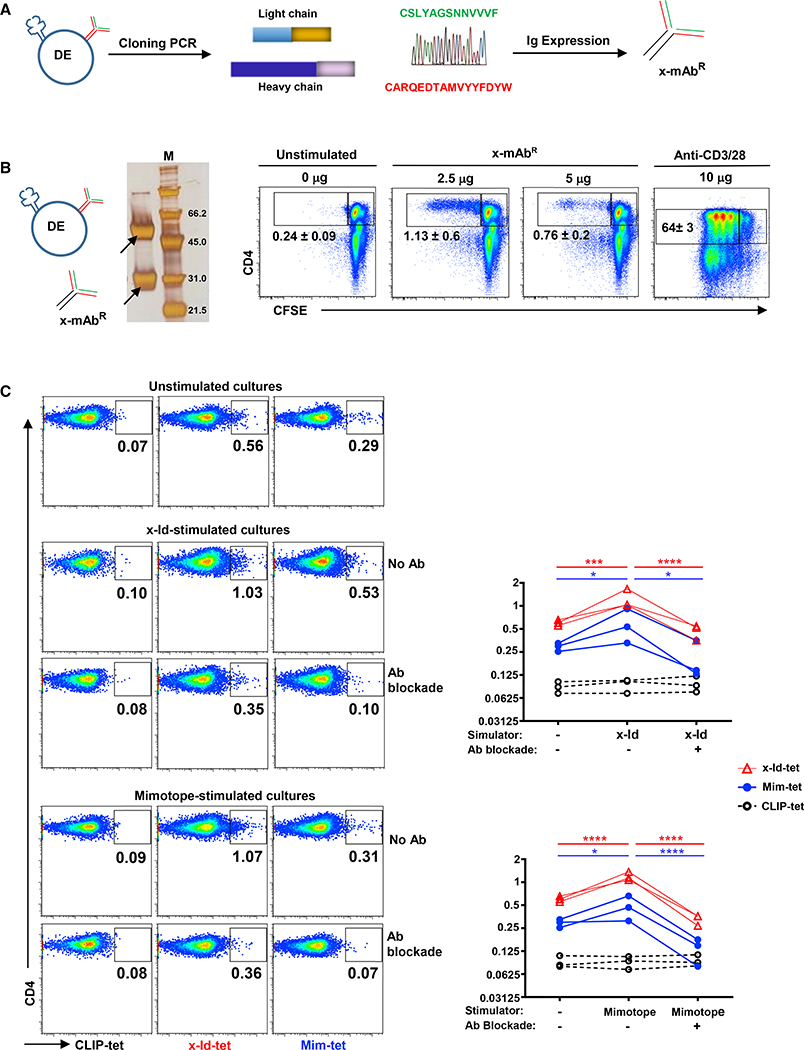
T and B cells are the two known lineages of adaptive immune cells. Here, we describe a previously unknown lymphocyte that is a dual expresser (DE) of TCR and BCR and key lineage markers of both B and T cells. In type 1 diabetes (T1D), DEs are predominated by one clonotype that encodes a potent CD4 T cell autoantigen in its antigen binding site. Molecular dynamics simulations revealed that this peptide has an optimal binding register for diabetogenic HLA-DQ8. In concordance, a synthetic version of the peptide forms stable DQ8 complexes and potently stimulates autoreactive CD4 T cells from T1D patients, but not healthy controls. Moreover, mAbs bearing this clonotype are autoreactive against CD4 T cells and inhibit insulin tetramer binding to CD4 T cells. Thus, compartmentalization of adaptive immune cells into T and B cells is not absolute, and violators of this paradigm are likely key drivers of autoimmune diseases.

Keywords: DEs; autoantigen; dual expressers; insulin mimotope; islet autoantigen; type 1 diabetes; x-clonotype; x-idiotype.


Conflict of interest statement

DECLARATION OF INTERESTS

The authors declare no conflict of interests.

Figures

Figure 1.
Figure 1.. A Rare Subset of Lymphocytes Coexpresses TCR and BCR and Expands in T1D
(A) Representative dot plots show coexpression of IgD and TCR among gated CD5+ CD19+ cells in T1D (top panel) and HC (bottom panel) subjects. Numbers indicate percentages in quadrants. Graph shows cumulative data (mean ± SEM). Each dot represents one donor. T1D (red, n = 16), HC (black, n = 11); ***p < 0.001, ****p < 0.0001 by two-way ANOVA with Sidak’s multiple comparisons test. See also Figure S1. (B) Representative AMNIS images show coexpression of IgD, TCR, and IgM by gated single-IgD+ DEs versus their differential expression in Bcon and Tcon cells in three T1D subjects (n = 32 DE cells). BF, bright field. See also Figure S2. (C) Heatmap of genes differentially expressed by DEs, Bcon, or Tcon cells. Top row shows cell types. Subsequent three rows show expression of ACTB, PPIA, and UBB housekeeping genes followed by the top 30 genes preferentially expressed in each cell type. The color scale indicates the gene expression in log2 (RSEM + 1). Note that DEs differentially express large numbers of genes that are absent or low in Bcon and Tcon cells. DEs share expression of markers of B and T cells with respective cell type. Data from 34 DEs (green), 20 Bcon cells (blue), and 23 Tcon cells (orange). (D) Heatmap shows DEs’ shared expression of indicated lineage markers with respective cell type Tcon or Bcon cells. (E) Heatmap shows DEs shared expression of Igα (CD79a) and Igβ (CD79b) with Bcon cells and CD3 subunits with Tcon cells. CD247 is CD3zeta. (F) Reconstruction of BCR and TCR in four DEs. No dual expression of BCR and TCR noted among Tcon and Bcon cells. See Table S2. See also Figures S1 and S2 and Tables S1 and S2.
Figure 2.
Figure 2.. TCR-Activated DEs Maintain Their Dual Phenotype and Upregulate MHC and Costimulatory Molecules
(A) TCR activation leads to the upregulation of CD69 by IgD+ and IgD cells. Left dot plots show gating of CD5+ CD19+ cells and Bcon and Tcon cells in anti-CD3/CD28 (top panel) and unstimulated control (bottom panel) cultures. Middle dot plots show expression of TCR and IgD by gated subsets. Overlays and graph show CD69 expression by gated IgD+ (red) and IgD (navy blue) and Tcon cells (green) and Bcon cells (blue) in activated and control cultures. Each dot represents one donor (n = 5); ****p < 0.0001 by two-way ANOVA with Tukey’s multiple comparisons test. (B) TCR activation leads to the proliferation of IgD+ and IgD DE subsets and Tcon cells as determined by CFSE dilution. Open histograms denote unstimulated cultures. (C) Upregulation of HLA-DR and DQ by TCR-activated DEs. Note that Bcon cells were present in control, but not activated cultures. Graphs show MFI (mean ± SEM) for HLA-DR (left) and HLA-DQ (right). Each dot represents one donor (n = 4); **p < 0.01 by two-way ANOVA with Sidak’s multiple comparisons test. See Figure S3 for upregulation of costimulatory molecules. D) DEs maintain Ig isotype phenotypes after 7 days of anti-CD3/CD28 stimulation. See also Figures S2, S3, and S4.
Figure 3.
Figure 3.. IGHV Repertoires of DEs Are Predominated by One Clonotype in T1D Subjects
(A–C) Venn diagrams show VH gene usage by IgD+ (red) and IgD (yellow) DEs and Bcon cells (blue) in (A) T1D#1, (B) #2, and (C) #3 patients. Graphs show percentages of the top 10 VH genes (or all 7 VH genes, in the case of T1D#2) used by IgD+ or IgD DEs as compared to Bcon cells in each patient. Arrows point to the IGHV-04-b+ gene segment, which was predominantly used by IgD+ and IgD DEs in the three patients. (D) Graph shows absolute number of mutations per VH gene in DEs and Bcon cells in the three T1D subjects. Each dot represents an individual VH gene. (E) Schematic shows the VH(N1)D(N2)JH structure with the nucleotide and amino acid sequences of the CDR3 of the x-clonotype. (F) Venn diagram shows that the x-clonotype is one of two (red) clonotypes shared among Bcon cells of the three T1D subjects. (G) Venn diagram shows diverse VH gene usage by IgD+ (red) and IgD (yellow) DEs comparable to that of Bcon (blue) in HC#1. Graph shows percentages of the top 10 VH genes used by IgD+ DEs as compared to IgD DEs and Bcon cells. (H) Comparison of CDR3 sequences of IGHV04-b+ clonotypes in the three T1D subjects and HC#1. Asterisk indicates gap in sequence. Note the highly conserved usage of VH04-b and JH04–01*02 by DEs in all subjects. (I) Number of mutations per VH gene in DE cells and Bcon cells. Each dot represents one VH gene. (J) Schematic shows primers used for detection of x-clonotype in peripheral blood of genotyped T1D and HCs. Table shows detection of x-clonotype in PBMC cDNAs of T1D and HC subjects using sequence-specific primers. Note that x-clonotype is detectable in DQ7+ (β57D+ isoform of DQ8), but not DQ8+ and DQ2+ HCs. A second probe with astringent reverse primer design produced similar results (Table S7). See also Figure S5 and Tables S1, S4, S5, S6, and S7.
Figure 4.
Figure 4.. HLA-CDR3 Peptide Binding
(A and B) HLA molecule loaded with (A) CDR3 (x-Id) peptide (CARQEDTAMVYYFDYW) and (B) superagonist (SHLVEELYLVAGEEG) from Wang et al., 2018. HLA-α is shown in cyan cartoon, HLA-β is shown in silver cartoon, and epitope residues are colored by type: white, hydrophobic; green, polar; blue, basic; red, acidic. (C) Change in binding affinity for mutating from polyglycine to the epitope for the CDR3 peptide and superagonist. (D) Binding affinity decomposition into vdW and electrostatics (coulomb) for the CDR3 (x-Id) peptide and superagonist. (E) van der Waals interaction energy between the HLA and epitope from MD simulation. (F and G) Percentage of epitope residues buried in HLA for (F) CDR3 (x-Id) peptide (CARQEDTAMVYYFDYW) and (G) superagonist (SHLVEELYLVAGEEG) from Wang et al., 2018. The sequence in bold is the core epitope sequence discussed in the text. (H) Average fluctuation (RMSF) for each residue in Å. (I) Detailed structure of buried salt bridges between CDR3 peptide and HLA. Basic residues are in blue, acidic are in red, and epitope backbone are in tan. (J) (Left) Overlay of most representative epitope conformations for the CDR3 peptide (light blue) and superagonist (red), with tyrosine residues in pockets 6 and 7 for the CDR3 peptide highlighted. (Right) Side view showing similar P1, P4, and P9 agreement but large differences elsewhere. In (C)–(D), error bars are standard error across six replicas. In (E)–(H), error bars are standard error from dividing the last 250 ns of MD simulation into five sections. See also Figure S6.
Figure 5.
Figure 5.. x-Id Peptide Forms Functional HLA-DQ8 Complexes that Stimulate CD4 T Cells
(A) Representative silver-stained SDS gel shows binding of indicated peptides to soluble DQ8 to form stable heterodimers. Arrows indicate p/DQαβ dimers and DQα and DQβ monomers, respectively. The results are from one of three independent experiments with similar results. (B) x-Id/DQ8 complexes stimulate proliferation of CD4 T cells from DQ8+ T1D. Representative dot plots show CFSE dilution by gated CD4 T cells among PBMCs from in T1D or HC subjects that were stimulated with indicated peptide-DQ8 complexes. Numbers indicate percentages of gated CFSElow CD4 T cells. Dot plots on the right show inhibition of proliferation by anti-DQ mAb. Graph shows cumulative data from three DQ8+ T1D and three HC subjects (n = 3); *p < 0.05 by two-way ANOVA with Sidak’s multiple comparisons test. (C) Overlays show upregulation of CD69 by gated CFSElow CD4 T cells (red line) versus CFSEhi CD4 T cells (green line) in each subject group. Numbers indicate percentages (mean ± SEM) of CFSElow CD4 T cells. See also Figure S7.
Figure 6.
Figure 6.. Verification of Dual Expression of BCR and TCR by DEs Using an EBV-Immortalized Clone
(A) Schematic depicts generation of lymphoblastoid cell line (x-LCL) and analysis of its cells for encoded antibody using two approaches: (1) cloning from sorted single cells (n = 7 cells) that yielded two antibodies that shared expression of the x-clonotype paired with one of two light chains (IGL1-x, IGL2-x) and (2) usage of limiting dilution to generate the x1.1 clone and use of PCR cloning to amplify transcripts of BCR and TCRαβ followed by usage of IMGT/V-QUEST to identify VDJ usage and CDR3 sequences. Nucleotide sequences of cloned receptors are shown. Representative images show coexpression of TCR (green), IgD (blue), and IgM (red) by a single EBV-transformed IgD+ x1.1 cell. BF, bright field. Images were taken by EVOS M7000 microscope using objective lens at 40×. (B) Naturally produced x-mAbN stimulates CD4 T cells from T1D. Coomassie-blue-stained gel shows production of x-mAbN by the x1.1 clone. Arrows point to heavy and light chains of x-mAbN (of IgM isotype). Representative plots show dilution of CFSE by CD4 T cells activated by soluble x-mAbN. Numbers indicate percentages (mean ± SEM) of CFSElow CD4 T cells (n = 3).
Figure 7.
Figure 7.. Recombinant x-mAbR Cross-activates Insulin-Reactive CD4 T Cells
(A) Schematic depicts amplification, cloning, and CDR3 sequences of the light and heavy chain of x-mAbR from a single DE cell and expression using IgG-AbVec and Igλ-AbVec expression vectors. (B) Silver-stained reduced gel shows heavy and light chains (arrows) of the x-mAbR. Representative plots show dilution of CFSE by activated CD4 T cells stimulated with immobilized x-mAbR. Numbers indicate percentages (mean ± SEM) of CFSElow CD4 T cells (n = 5). (C) Binding inhibition indicates overlapping of x-Id and mimotope-reactive CD4 T cells. x-mAbR inhibits binding of mim-tet and x-Id-tet to CD4 T cells that had been activated with x-Id or mimotope. PBMCs were cultures for 7 days in the presence of absence of x-Id or mimotope peptide. Top dot plots show that CD4 T cells expanded by the x-Id-peptide are detectable not only by x-Id-tet, but also by mim-tet. Reciprocally, CD4 T cells expanded by the mimotope peptide are detectable by both the x-Id-tet and mim-tet. CLIP-Tet was used to measure background staining, and x-Id-tet+ or mim-tet+ in unstimulated cultures identify precursor frequencies. Bottom dot plots show that preincubating with cells with x-mAbR inhibits tetramer staining. Left graph shows frequency of tetramer+ CD4 T cells in different cultures of x-Id peptide-stimulated cultures. Right graph shows data from mimoptope-stimulated cultures. Each line represents one donor. Blockade with x-mAbR inhibited tetramer binding (n = 3); *p < 0.01, ***p < 0.001, ****p < 0.0001 by two-way ANOVA with Tukey’s multiple comparisons test.

Comment in

References

    1. Aas-Hanssen K, Funderud A, Thompson KM, Bogen B, and Munthe LA (2014). Idiotype-specific Th cells support oligoclonal expansion of anti-dsDNA B cells in mice with lupus. J. Immunol. 193, 2691–2698. - PubMed
    1. Best RB, Zhu X, Shim J, Lopes PE, Mittal J, Feig M, and Mackerell AD Jr. (2012). Optimization of the additive CHARMM all-atom protein force field targeting improved sampling of the backbone φ, ψ and side-chain χ(1) and χ(2) dihedral angles. J. Chem. Theory Comput. 8, 3257–3273. - PMC - PubMed
    1. Canzar S, Neu KE, Tang Q, Wilson PC, and Khan AA (2017). BASIC: BCR assembly from single cells. Bioinformatics 33, 425–427. - PMC - PubMed
    1. Caputo JG, and Flytzanis N (1991). Kink-antikink collisions in sine-Gordon and phi4 models: Problems in the variational approach. Phys. Rev. A 44, 6219–6225. - PubMed
    1. Carlson CS, Emerson RO, Sherwood AM, Desmarais C, Chung MW, Parsons JM, Steen MS, LaMadrid-Herrmannsfeldt MA, Williamson DW, Livingston RJ, et al. (2013). Using synthetic templates to design an unbiased multiplex PCR assay. Nat. Commun. 4, 2680. - PubMed

Publication types

MeSH terms