

Thioflavin T Monitoring of Guanine Quadruplex Formation in the rs689-Dependent INS Intron 1
- PMID: 31150930
- PMCID: PMC6539410
- DOI: 10.1016/j.omtn.2019.04.026
Thioflavin T Monitoring of Guanine Quadruplex Formation in the rs689-Dependent INS Intron 1
Abstract
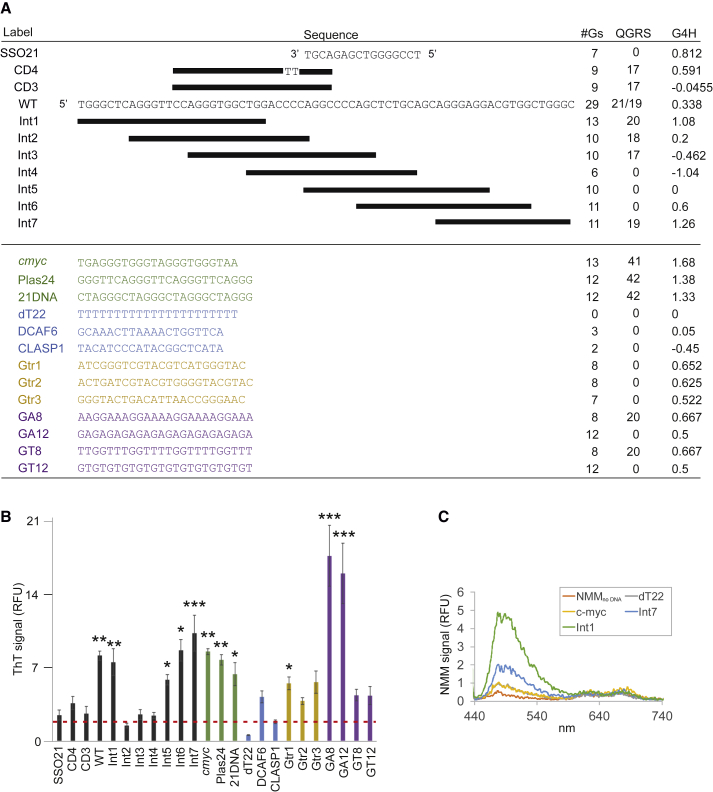
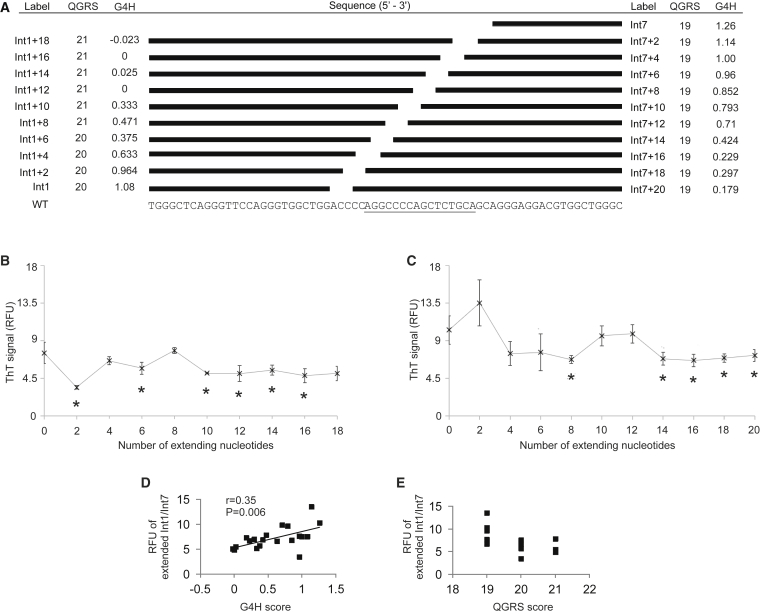
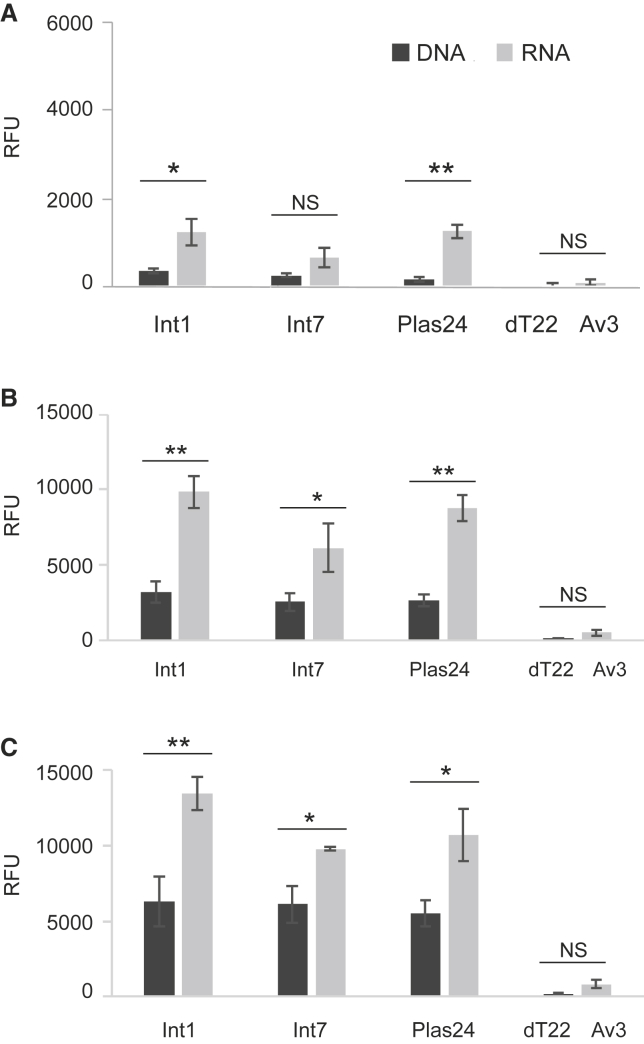
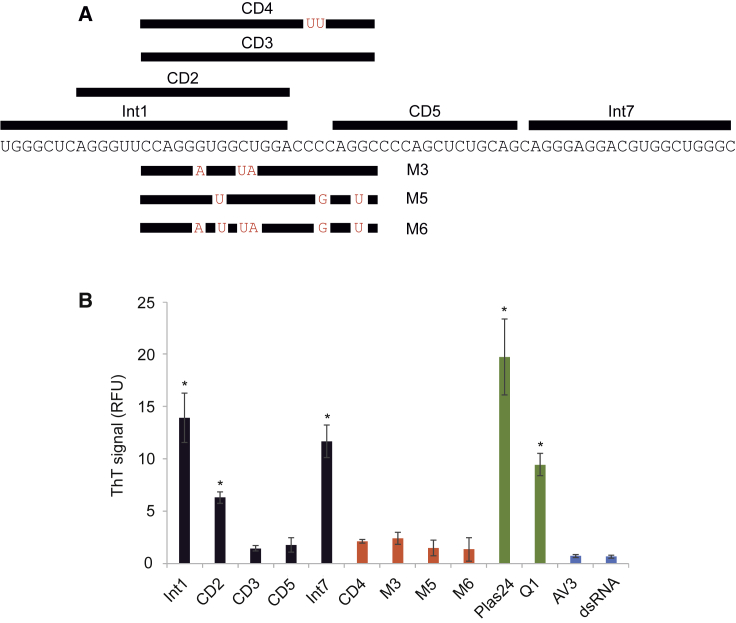
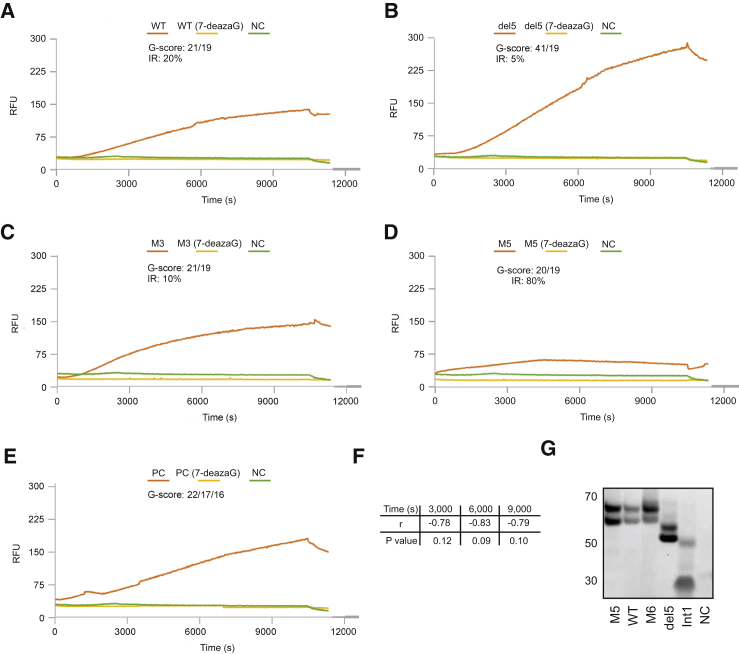
The human proinsulin gene (INS) contains a thymine-to-adenine variant (rs689) located in the 3' splice site (3' ss) recognition motif of the first intron. The adenine at rs689 is strongly associated with type 1 diabetes. By weakening the polypyrimidine tract, the adenine allele reduces the efficiency of intron 1 splicing, which can be ameliorated by antisense oligonucleotides blocking a splicing silencer located upstream of the 3' ss. The silencer is surrounded by guanine-rich tracts that may form guanine quadruplexes (G4s) and modulate the accessibility of the silencer. Here, we employed thioflavin T (ThT) to monitor G4 formation in synthetic DNAs and RNAs derived from INS intron 1. We show that the antisense target is surrounded by ThT-positive segments in each direction, with oligoribonucleotides exhibiting consistently higher fluorescence than their DNA counterparts. The signal was reduced for ThT-positive oligonucleotides that were extended into the silencer, indicating that flanking G4s have a potential to mask target accessibility. Real-time monitoring of ThT fluorescence during INS transcription in vitro revealed a negative correlation with ex vivo splicing activities of corresponding INS constructs. Together, these results provide a better characterization of antisense targets in INS primary transcripts for restorative strategies designed to improve the INS splicing defect associated with type 1 diabetes.
Keywords: 3′ splice site; G quadruplex; polymorphism; proinsulin gene; transcription; type 1 diabetes.
Copyright © 2019. Published by Elsevier Inc.
Figures
Similar articles
-
Understanding Insulin in the Age of Precision Medicine and Big Data: Under-Explored Nature of Genomics.Biomolecules. 2023 Jan 30;13(2):257. doi: 10.3390/biom13020257. Biomolecules. 2023. PMID: 36830626 Free PMC article. Review.
-
Optimal antisense target reducing INS intron 1 retention is adjacent to a parallel G quadruplex.Nucleic Acids Res. 2014 Jul;42(12):8161-73. doi: 10.1093/nar/gku507. Epub 2014 Jun 17. Nucleic Acids Res. 2014. PMID: 24944197 Free PMC article.
-
Facilitation of a structural transition in the polypurine/polypyrimidine tract within the proximal promoter region of the human VEGF gene by the presence of potassium and G-quadruplex-interactive agents.Nucleic Acids Res. 2005 Oct 20;33(18):6070-80. doi: 10.1093/nar/gki917. Print 2005. Nucleic Acids Res. 2005. PMID: 16239639 Free PMC article.
-
Minimal thioflavin T modifications improve visual discrimination of guanine-quadruplex topologies and alter compound-induced topological structures.Anal Chem. 2014 Dec 16;86(24):12078-84. doi: 10.1021/ac5028325. Epub 2014 Dec 3. Anal Chem. 2014. PMID: 25417850
-
Identification of RNA Oligonucleotides Binding to Several Proteins from Potential G-Quadruplex Forming Regions in Transcribed Pre-mRNA.Molecules. 2015 Nov 23;20(11):20832-40. doi: 10.3390/molecules201119733. Molecules. 2015. PMID: 26610452 Free PMC article.
Cited by
-
Understanding Insulin in the Age of Precision Medicine and Big Data: Under-Explored Nature of Genomics.Biomolecules. 2023 Jan 30;13(2):257. doi: 10.3390/biom13020257. Biomolecules. 2023. PMID: 36830626 Free PMC article. Review.
-
Identification of G-quadruplex structures in MALAT1 lncRNA that interact with nucleolin and nucleophosmin.Nucleic Acids Res. 2023 Sep 22;51(17):9415-9431. doi: 10.1093/nar/gkad639. Nucleic Acids Res. 2023. PMID: 37558241 Free PMC article.
-
Alternative splicing modulation mediated by G-quadruplex structures in MALAT1 lncRNA.Nucleic Acids Res. 2022 Jan 11;50(1):378-396. doi: 10.1093/nar/gkab1066. Nucleic Acids Res. 2022. Retraction in: Nucleic Acids Res. 2023 Sep 22;51(17):9508. doi: 10.1093/nar/gkad654. PMID: 34761272 Free PMC article. Retracted.
-
The presence of a G-quadruplex prone sequence upstream of a minimal promoter increases transcriptional activity in the yeast Saccharomyces cerevisiae.Biosci Rep. 2023 Dec 20;43(12):BSR20231348. doi: 10.1042/BSR20231348. Biosci Rep. 2023. PMID: 38112096 Free PMC article.
References
-
- Varizhuk A., Ischenko D., Tsvetkov V., Novikov R., Kulemin N., Kaluzhny D., Vlasenok M., Naumov V., Smirnov I., Pozmogova G. The expanding repertoire of G4 DNA structures. Biochimie. 2017;135:54–62. - PubMed
- Varizhuk, A., Ischenko, D., Tsvetkov, V., Novikov, R., Kulemin, N., Kaluzhny, D., Vlasenok, M., Naumov, V., Smirnov, I., and Pozmogova, G. (2017). The expanding repertoire of G4 DNA structures. Biochimie 135, 54-62. - PubMed
LinkOut - more resources
Full Text Sources
