. 2019 May 30;8(6):765.
doi: 10.3390/jcm8060765.

Adipose-Derived Mesenchymal Stem Cells Isolated from Patients with Type 2 Diabetes Show Reduced "Stemness" through an Altered Secretome Profile, Impaired Anti-Oxidative Protection, and Mitochondrial Dynamics Deterioration

Affiliations

Adipose-Derived Mesenchymal Stem Cells Isolated from Patients with Type 2 Diabetes Show Reduced "Stemness" through an Altered Secretome Profile, Impaired Anti-Oxidative Protection, and Mitochondrial Dynamics Deterioration

Michalina Alicka et al. J Clin Med. .

Abstract

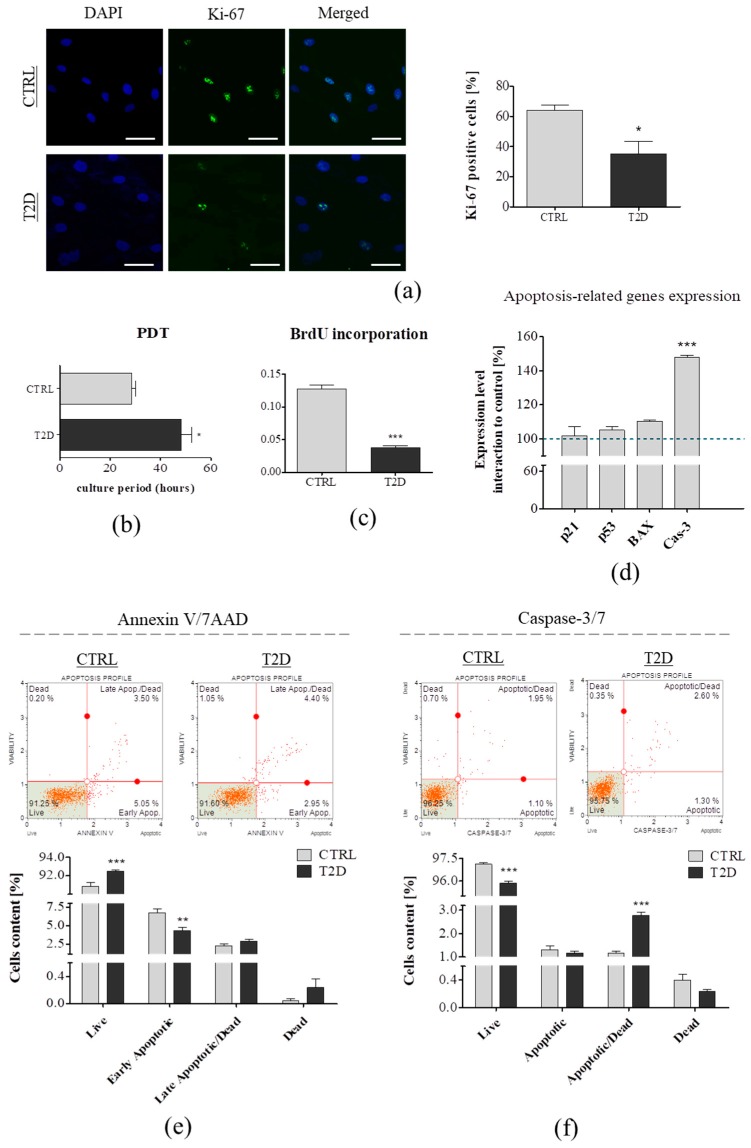
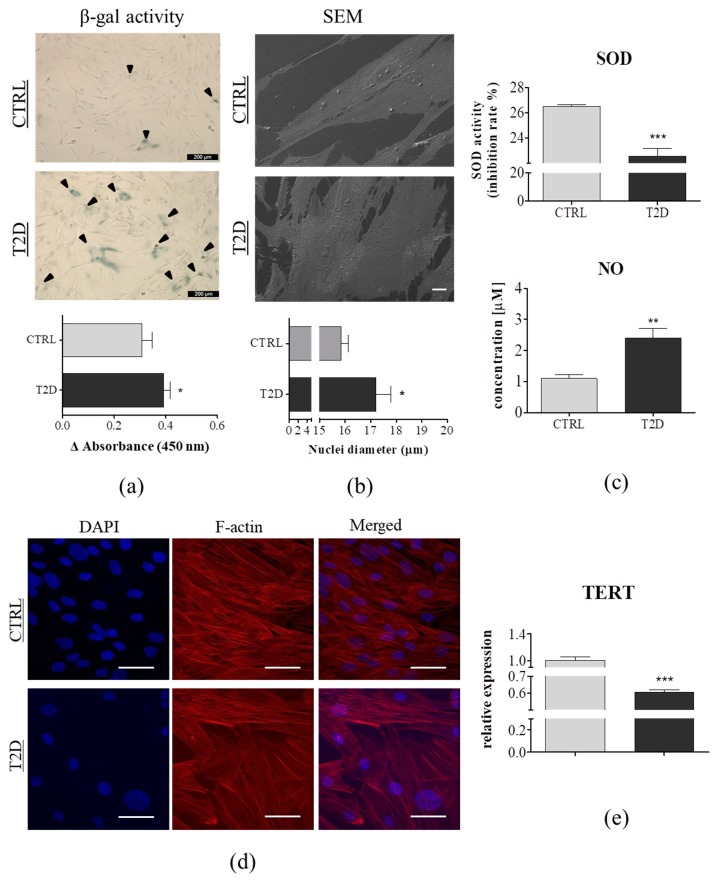
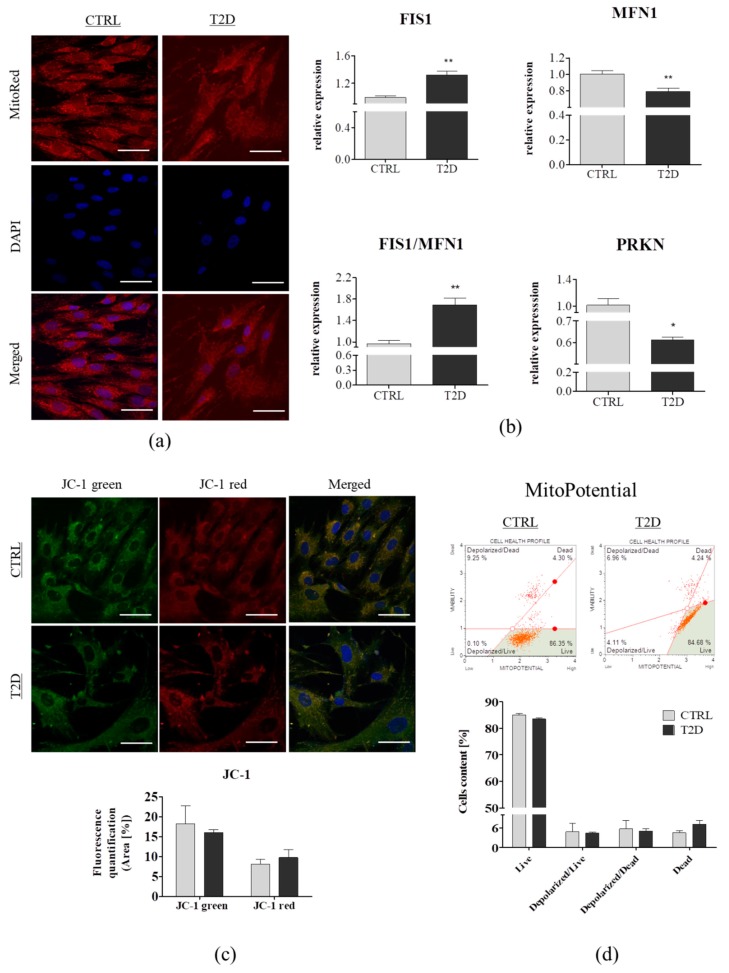
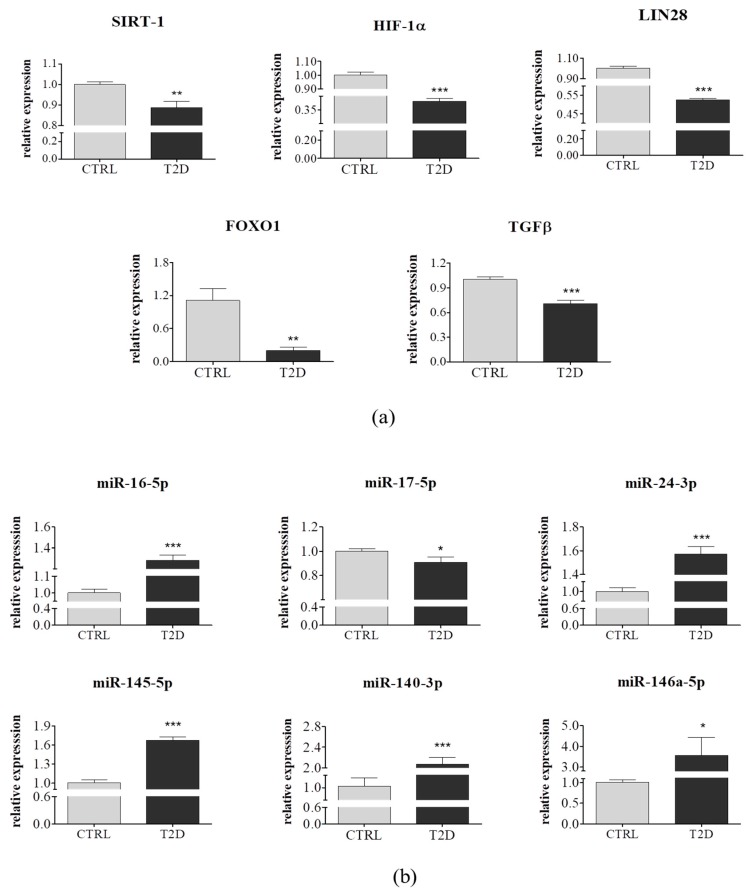
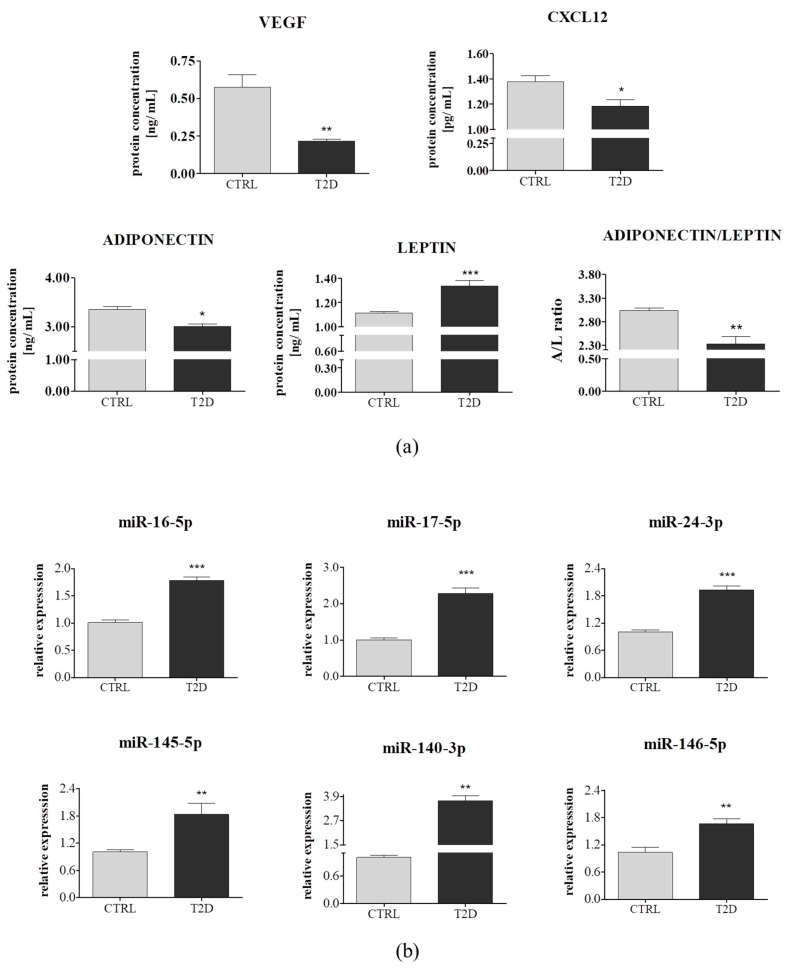
The widespread epidemic of obesity and type 2 diabetes (T2D), suggests that both disorders are closely linked. Several pre-clinical and clinical studies have showed that adipose-derived mesenchymal stem cells (ASC) transplantation is efficient and safe. Moreover, scientists have already highlighted the therapeutic capacity of their secretomes. In this study, we used quantitative PCR, a flow cytometry-based system, the ELISA method, spectrophotometry, and confocal and scanning electron microscopy, to compare the differences in proliferation activity, viability, morphology, mitochondrial dynamics, mRNA and miRNA expression, as well as the secretory activity of ASCs derived from two donor groups-non-diabetic and T2D patients. We demonstrated that ASCs from T2D patients showed a reduced viability and a proliferative potential. Moreover, they exhibited mitochondrial dysfunction and senescence phenotype, due to excessive oxidative stress. Significant differences were observed in the expressions of miRNA involved in cell proliferations (miR-16-5p, miR-146a-5p, and miR-145-5p), as well as miRNA and genes responsible for glucose homeostasis and insulin sensitivity (miR-24-3p, 140-3p, miR-17-5p, SIRT1, HIF-1α, LIN28, FOXO1, and TGFβ). We have observed a similar correlation of miR-16-5p, miR-146a-5p, miR-24-3p, 140-3p, miR-17-5p, and miR-145-5p expression in extracellular vesicles fraction. Furthermore, we have shown that ASCT2D exhibited a lower VEGF, adiponectin, and CXCL-12 secretion, but showed an overproduction of leptin. We have shown that type 2 diabetes attenuated crucial functions of ASC, like proliferation, viability, and secretory activity, which highly reduced their therapeutic efficiency.

Keywords: adipose-derived mesenchymal stem cells; extracellular microvesicle; insulin resistance; regenerative medicine; type 2 diabetes.


Conflict of interest statement

Authors declare that there is no conflict of interest.

Figures

Figure 1
Figure 1
Comparison of proliferation and apoptosis in adipose-derived mesenchymal stem cells from non-diabetic donors (ASCCTRL) (n = 6) and patients with clinically confirmed type 2 diabetes (ASCT2D) (n = 6). (a) Representative images of immunofluorescence staining for Ki-67 (green). Nuclei were counterstained with 4′,6-diamidino-2-phenylindole (DAPI) (blue). Ki-67 expression in ASCs was showed as Ki-67 positive cells percentage. Scale bar: 50 µm. (b) population doubling-time (PDT) value was determined using TOX-8 Resazurin-based Assay. (c) BrdU incorporation assay. Cells were cultured with BrdU labeling medium for 18 h. (d) Transcript levels of the apoptosis-related genes was determined using the qRT-PCR method. The black dotted line indicated the transcript levels of genes in the ASCCTRL group. (e,f) Evaluation of apoptosis and cell death using the Muse Cell Analyzer. The percentage of live, apoptotic, apoptotic/dead, and dead cell was assessed using thee Annexin/7AAD and Caspase-3/7 tests. Results are expressed as mean ± SD. Statistical significance is indicated by asterisks (*); * p < 0.05, ** p < 0.01, *** p < 0.001, as examined by unpaired Student’s t-test.
Figure 2
Figure 2
Changes in cellular senescence and extracellular oxidative stress in ASCCTRL (n = 6) and ASCT2D (n = 6). (a) Representative images of senescence-associated β-galactosidase (SA β-gal) staining in ASCCTRL and ASCT2D. Positive blue staining of SA β-gal appeared in the senescent T2D group; indicated by black arrows. SA β-gal staining was quantified using spectrophotometry (450 nm); showed as mean of Δ Absorbance. Scale bar: 200 µm. (b) Visualization of ASCs morphology using SEM. Mean diameter of the cell nuclei measured on the basis of SEM images. Scale bar: 20 µm, magnification: 1000×. (c) Quantification of extracellular oxidative stress factors. The levels of secretory superoxide dismutase (SOD) showed as mean of SOD activity (inhibition rate [%]) and released nitric oxide (NO) was determined in cell-free culture supernatants. (d) Representative pictures of F-actin visualization with Phalloidin Atto-594 staining, using confocal microscopy. Scale bar: 50 µm. (e) Relative expression of telomerase reverse transcriptase (TERT) in ASCCTRL and ASCT2D qRT-PCR. Results expressed as mean ± SD. Statistical significance indicated as asterisk (*): * p < 0.05, ** p < 0.01, and *** p < 0.001 were examined by an unpaired Student’s t-test.
Figure 3
Figure 3
Mitochondrial dynamics and mitochondrial membrane potential in the ASCCTRL (n = 6) and ASCT2D (n = 6). (a) Representative images of mitochondria visualization in ASCs with MitoRed (red) and DAPI (blue) staining, using confocal microscopy. Scale bar: 50 µm. (b) Transcript levels of mitochondrial dynamics-related genes, assessed using qRT-PCR. (c) Mitochondrial membrane potential estimation by JC-1 staining, using confocal microscopy. (d) MitoPotential Analysis using the Muse Cell Analyzer. Fluorescence intensity of JC-1 staining was quantified using Image J. Results are expressed as mean ± SD. Statistical significance is indicated by asterisks (*): * p < 0.05, ** p < 0.01 were examined by an unpaired Student’s t-test. Scale bar: 50 µm.
Figure 4
Figure 4
Transcripts levels of selected mRNA and miRNA in ASCs derived from a control group (n = 6) and from type 2 diabetic individuals (n = 6). (a,b) Both, mRNA and miRNA expression profiles were determined using quantitative PCR. Results are expressed as mean ± SD. Statistical significance are indicated by asterisks (*): * p < 0.05, ** p < 0.01, and *** p < 0.001 were examined by unpaired Student’s t-test.
Figure 5
Figure 5
Comparison of selected miRNAs and proteins secreted by adipose-derived mesenchymal stem cells, isolated from non-diabetic (n = 6) individuals and patients suffering from type 2 diabetes (T2D) (n = 6). (a) Proteome analysis of the conditioned media from the ASCCTRL and the ASCT2D was performed using the ELISA method. (b) miRNA levels in extracellular vesicles extracted using Amicon Ultra 15 filter (3000 MWCO). Extracellular miRNA expression profiling was determined using quantitative PCR. Results expressed as mean ± SD. Statistical significance indicated as asterisk (*): * p < 0.05, ** p < 0.01, and *** p < 0.001 were examined through unpaired Student’s t-test.

References

    1. World Health Organization . In: Global Report on Diabetes. Roglic G., editor. World Health Organization; Geneva, Switzerland: 2016.
    1. What is Diabetes? | NIDDK. [(accessed on 2 March 2019)]; Available online: https://www.niddk.nih.gov/health-information/diabetes/overview/what-is-d....
    1. Cusi K. The Role of Adipose Tissue and Lipotoxicity in the Pathogenesis of Type 2 Diabetes. Curr. Diabetes Rep. 2010;10:306–315. doi: 10.1007/s11892-010-0122-6. - DOI - PubMed
    1. Friedenstein A.J., Chailakhjan R.K., Lalykina K.S. The Development of Fibroblast Colonies in Monolayer Cultures of Guinea-Pig Bone Marrow and Spleen Cells. Cell Tissue Kinet. 1970;3:393–403. doi: 10.1111/j.1365-2184.1970.tb00347.x. - DOI - PubMed
    1. Miller I., Min M., Yang C., Tian C., Gookin S., Carter D., Spence S.L. Ki67 is a Graded Rather than a Binary Marker of Proliferation Versus Quiescence. Cell Rep. 2018;24:1105–1112.e5. doi: 10.1016/j.celrep.2018.06.110. - DOI - PMC - PubMed