Review
. 2019 May 30;11(6):756.
doi: 10.3390/cancers11060756.

In-Vivo and Ex-Vivo Tissue Analysis through Hyperspectral Imaging Techniques: Revealing the Invisible Features of Cancer

Affiliations
Review

In-Vivo and Ex-Vivo Tissue Analysis through Hyperspectral Imaging Techniques: Revealing the Invisible Features of Cancer

Martin Halicek et al. Cancers (Basel). .

Abstract

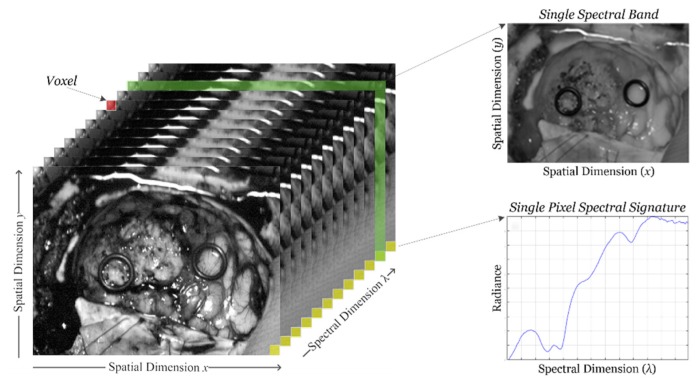
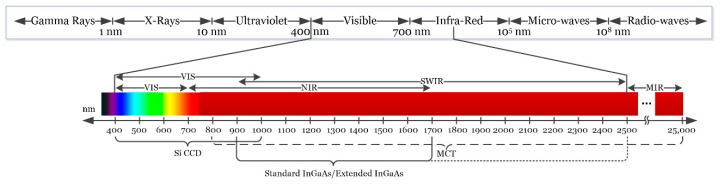
In contrast to conventional optical imaging modalities, hyperspectral imaging (HSI) is able to capture much more information from a certain scene, both within and beyond the visual spectral range (from 400 to 700 nm). This imaging modality is based on the principle that each material provides different responses to light reflection, absorption, and scattering across the electromagnetic spectrum. Due to these properties, it is possible to differentiate and identify the different materials/substances presented in a certain scene by their spectral signature. Over the last two decades, HSI has demonstrated potential to become a powerful tool to study and identify several diseases in the medical field, being a non-contact, non-ionizing, and a label-free imaging modality. In this review, the use of HSI as an imaging tool for the analysis and detection of cancer is presented. The basic concepts related to this technology are detailed. The most relevant, state-of-the-art studies that can be found in the literature using HSI for cancer analysis are presented and summarized, both in-vivo and ex-vivo. Lastly, we discuss the current limitations of this technology in the field of cancer detection, together with some insights into possible future steps in the improvement of this technology.

Keywords: artificial intelligence; biomedical optical imaging; cancer; clinical diagnosis; hyperspectral imaging; machine learning; medical diagnostic imaging.


Conflict of interest statement

The authors declare no conflict of interest. The funders had no role in the design of the study; in the collection, analyses, or interpretation of data; in the writing of the manuscript, or in the decision to publish the results.

Figures

Figure 1
Figure 1
Hyperspectral imaging data. Basic structure of a hyperspectral imaging (HSI) cube, single band representation at a certain wavelength and spectral signature of a single pixel.
Figure 2
Figure 2
Electromagnetic spectrum. HSI is commonly employed between the visible and the medium-infrared range.
Figure 3
Figure 3
Hyperspectral camera types and their respective acquisition and data storage methods. (a) Whiskbroom camera; (b) Pushbroom camera; (c) Hyperspectral (HS) camera based on spectral scanning; (d) Snapshot camera.
Figure 4
Figure 4
A few representative major molecular contributions to the absorbance at wavelengths of light typical for HSI investigations of biological tissue [107]. Reproduced with permission from [107]; published by IOP Publishing (2013).
Figure 5
Figure 5
Taxonomy of the state-of-the-art methods of medical HSI for cancer detection that are reviewed in this paper, organized by organ systems.
Figure 6
Figure 6
Gastric cancer detection acquisition system, cancer detection results using the NDCI and integral filter, and comparison with histopathological results obtained in [116]. (a) HS acquisition system setup; (b) RGB representation of the ex-vivo sample; (c) Cancer enhanced regions using an integral filter in the hyperspectral image (1057–2440 nm); the tissues are shown in a blue to red spectrum, where the red regions represent the tumor; (d) Cancer enhanced regions using NDCI; (e) Pathological sectioning and results; (f) Detected tumor using an integral filter; (g) Detected tumor using NDCI. Reproduced with permission from [116]; published by Wiley (2011).
Figure 7
Figure 7
Result of the tumor identification using the Minimum-Spanning Forest method developed in [137]. (A) Synthetic RGB image of the original mouse; (B) Corresponding gold standard image; (C) Classification result obtained. Reproduced with permission from [137]; published by IEEE (2015).
Figure 8
Figure 8
Preliminary results obtained in the tumor margin delineation for head and neck cancer [138]. After hyperspectral image acquisitions (top-left), the tissue was processed histologically, and tumor margins were outlined on the pathology image (bottom right) by a pathologist, which was used to validate the results of the classification (top-right). The average spectral curves are shown at the bottom left for each type of tissue, i.e., tumor, normal, and tumor with adjacent normal tissue. Reproduced from [138]; Creative Commons BY 4.0; published by SPIE (2017).
Figure 9
Figure 9
HS image example of the lower lip of a normal human acquired with the image mapping spectroscopy (IMS) endoscope developed in [142]. (a) RGB representation; (b) Spectral signature of the normal tissue pixel and a vein pixel; (c) Clinical setup of the IMS endoscope; (d) Miniature imaging end of the IMS endoscope; (e) Fiber optics of the IMS endoscope inserted into the instrument channel. Reproduced from [142]; Creative Commons BY 4.0; published by SPIE (2011).
Figure 10
Figure 10
Delineation of the tongue tumor region in [146]. Expert labeling (left) and classifier prediction of tumor regions (right). Reproduced from [146]; Creative Commons BY 4.0; published by MDPI (2012).
Figure 11
Figure 11
HELICoiD demonstrator [164] and normal brain image results obtained from the validation database employed in [171]. (a) HELICoiD demonstrator; (b,d,f) Synthetic RGB images; (c,e,g) Thematic maps of the HS image, where the normal tissue is represented in green color, the hypervascularized tissue in blue and the background in black. Reproduced from [171]; Creative Commons BY 4.0; published by MDPI (2018).
Figure 12
Figure 12
Tumor tissue identification results obtained from the validation database employing the HELICoiD demonstrator in [171]. (a,c,e,g) Synthetic RGB images; (b,d,f,h) Thematic maps of the HS image, where the tumor tissue is represented in red color, the normal tissue in green, the hypervascularized tissue in blue and the background in black. Reproduced from [171]; Creative Commons BY 4.0; published by MDPI (2018).

References

    1. Kamruzzaman M., Sun D.W. Computer Vision Technology for Food Quality Evaluation. Elsevier; Amsterdam, The Netherlands: 2016. Introduction to Hyperspectral Imaging Technology; pp. 111–139. - DOI
    1. Starr C., Evers C., Starr L. Biology: Concepts and Applications without Physiology. Cengage Learning; Boston, MA, USA: 2010.
    1. Manolakis D., Shaw G. Detection Algorithms for Hyperspectral Imaging Applications. IEEE Signal Process. Mag. 2002;19:29–43. doi: 10.1109/79.974724. - DOI
    1. Govender M., Chetty K., Bulcock H. A review of hyperspectral remote sensing and its application in vegetation and water resource studies. Water SA. 2009;33:145–152. doi: 10.4314/wsa.v33i2.49049. - DOI
    1. Van der Meer F.D., van der Werff H.M.A., van Ruitenbeek F.J.A., Hecker C.A., Bakker W.H., Noomen M.F., van der Meijde M., Carranza E.J.M., de Smeth J.B., Woldai T. Multi- and hyperspectral geologic remote sensing: A review. Int. J. Appl. Earth Obs. Geoinform. 2012;14:112–128. doi: 10.1016/j.jag.2011.08.002. - DOI

LinkOut - more resources