Characterizing the Dynamic Textural Properties of Hydrocolloids in Pureed Foods-A Comparison Between TDS and TCATA
- PMID: 31151243
- PMCID: PMC6617281
- DOI: 10.3390/foods8060184
Characterizing the Dynamic Textural Properties of Hydrocolloids in Pureed Foods-A Comparison Between TDS and TCATA
Abstract
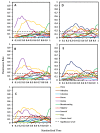
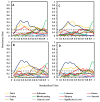
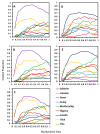
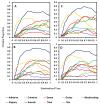
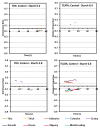
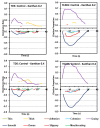
Pureed foods, a compensatory diet for dysphagia, require the incorporation of hydrocolloids in order to be swallowed safely. The effect of hydrocolloid addition on textural dynamics of pureed foods has not yet been investigated. Starch and xanthan were added to levels that allowed products to meet the criteria of the International Dysphagia Diet Standardization Initiative. Nine pureed carrot matrices made with two concentrations of starch, xanthan, and their blends were characterized for textural evolution using two dynamic sensory techniques: Temporal Dominance of Sensations (TDS) and Temporal Check-All-That-Apply (TCATA). Each test, with four replications, was conducted with 16 panelists. Results indicate that purees were divided into two groups based on sensory responses--grainy and smooth were the primary differentiating attributes for these two groups. Grainy was associated with starch-added samples, while samples with xanthan (alone and in blends) were smooth and slippery. For both groups, thickness was perceived during the first half of processing, adhesiveness in the second half of oral processing, and mouthcoating was perceived toward the end of processing. A comparison of results from these tests showed that both TDS and TCATA gave similar information about texture dynamics and product differentiation of pureed foods.
Keywords: International Dysphagia Diet Standardization Initiative (IDDSI); carrots; dynamic perception; oral processing; pureed foods; starch; temporal check-all-that-apply (TCATA); temporal dominance of sensations (TDS); xanthan.
Conflict of interest statement
The authors declare no conflict of interest.
Figures


Similar articles
-
Understanding relations between rheology, tribology, and sensory perception of modified texture foods.J Texture Stud. 2022 Jun;53(3):327-344. doi: 10.1111/jtxs.12656. Epub 2021 Dec 30. J Texture Stud. 2022. PMID: 34921392
-
Temporal Sensory Profiles of Regular and Sodium-Reduced Foods Elicited by Temporal Dominance of Sensations (TDS) and Temporal Check-All-That-Apply (TCATA).Foods. 2022 Feb 3;11(3):457. doi: 10.3390/foods11030457. Foods. 2022. PMID: 35159607 Free PMC article.
-
Characterizing commercial pureed foods: sensory, nutritional, and textural analysis.J Nutr Gerontol Geriatr. 2014;33(3):179-97. doi: 10.1080/21551197.2014.927304. J Nutr Gerontol Geriatr. 2014. PMID: 25105714
-
Critical review of sensory texture descriptors: From pureed to transitional foods for dysphagia patients.J Texture Stud. 2021 Dec;52(5-6):665-678. doi: 10.1111/jtxs.12604. Epub 2021 May 22. J Texture Stud. 2021. PMID: 33905538 Review.
-
The dynamics of texture perception of hard solid food: A review of the contribution of the temporal dominance of sensations technique.J Texture Stud. 2018 Apr;49(2):202-212. doi: 10.1111/jtxs.12273. Epub 2017 May 25. J Texture Stud. 2018. PMID: 28547772 Review.
Cited by
-
Application of HPP for the Development of a Dessert Elaborated with Casein and Cocoa for a Dysphagia Diet.Foods. 2023 Feb 18;12(4):882. doi: 10.3390/foods12040882. Foods. 2023. PMID: 36832957 Free PMC article.
-
Bootstrap Resampling of Temporal Dominance of Sensations Curves to Compute Uncertainties.Foods. 2021 Oct 15;10(10):2472. doi: 10.3390/foods10102472. Foods. 2021. PMID: 34681521 Free PMC article.
-
Dishes Adapted to Dysphagia: Sensory Characteristics and Their Relationship to Hedonic Acceptance.Foods. 2021 Feb 23;10(2):480. doi: 10.3390/foods10020480. Foods. 2021. PMID: 33672336 Free PMC article.
-
Exploring Tools for Designing Dysphagia-Friendly Foods: A Review.Foods. 2021 Jun 10;10(6):1334. doi: 10.3390/foods10061334. Foods. 2021. PMID: 34200551 Free PMC article. Review.
-
Texture-Modified Food for Dysphagic Patients: A Comprehensive Review.Int J Environ Res Public Health. 2021 May 12;18(10):5125. doi: 10.3390/ijerph18105125. Int J Environ Res Public Health. 2021. PMID: 34066024 Free PMC article. Review.
References
-
- Funami T. Next target for food hydrocolloid studies: Texture design of foods using hydrocolloid technology. Food Hydrocoll. 2011;25:1904–1914. doi: 10.1016/j.foodhyd.2011.03.010. - DOI
-
- Funami T. The Formulation Design of Elderly Special Diets: Formulation design for elderly. J. Texture Stud. 2016;47:313–322. doi: 10.1111/jtxs.12202. - DOI
Grants and funding
LinkOut - more resources
Full Text Sources
Molecular Biology Databases

