. 2019 Jul 17;103(2):277-291.e4.
doi: 10.1016/j.neuron.2019.04.037. Epub 2019 May 28.

Rapid Plasticity of Higher-Order Thalamocortical Inputs during Sensory Learning

Affiliations

Rapid Plasticity of Higher-Order Thalamocortical Inputs during Sensory Learning

Nicholas J Audette et al. Neuron. .

Abstract

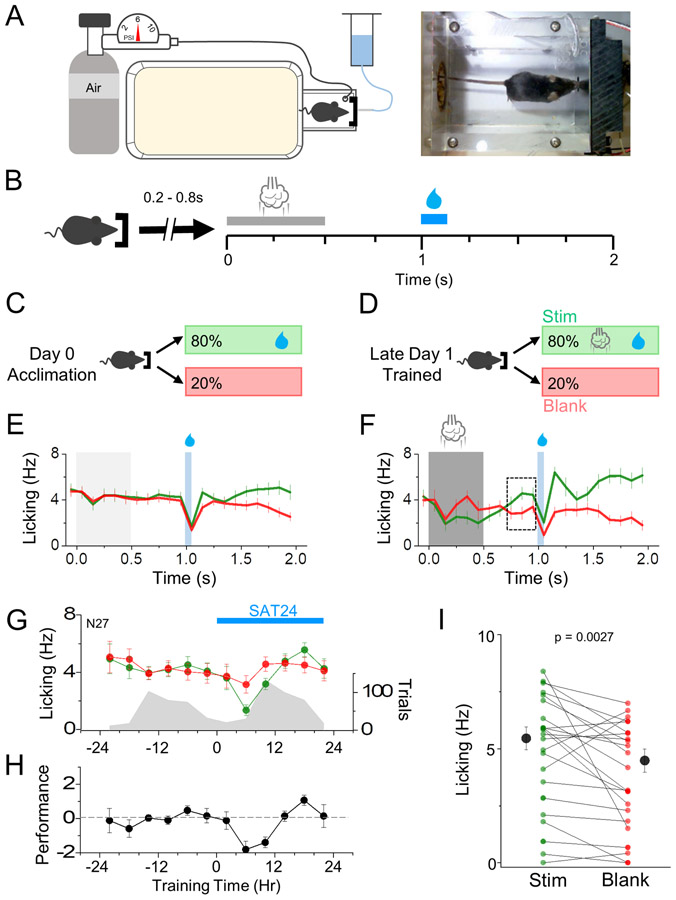
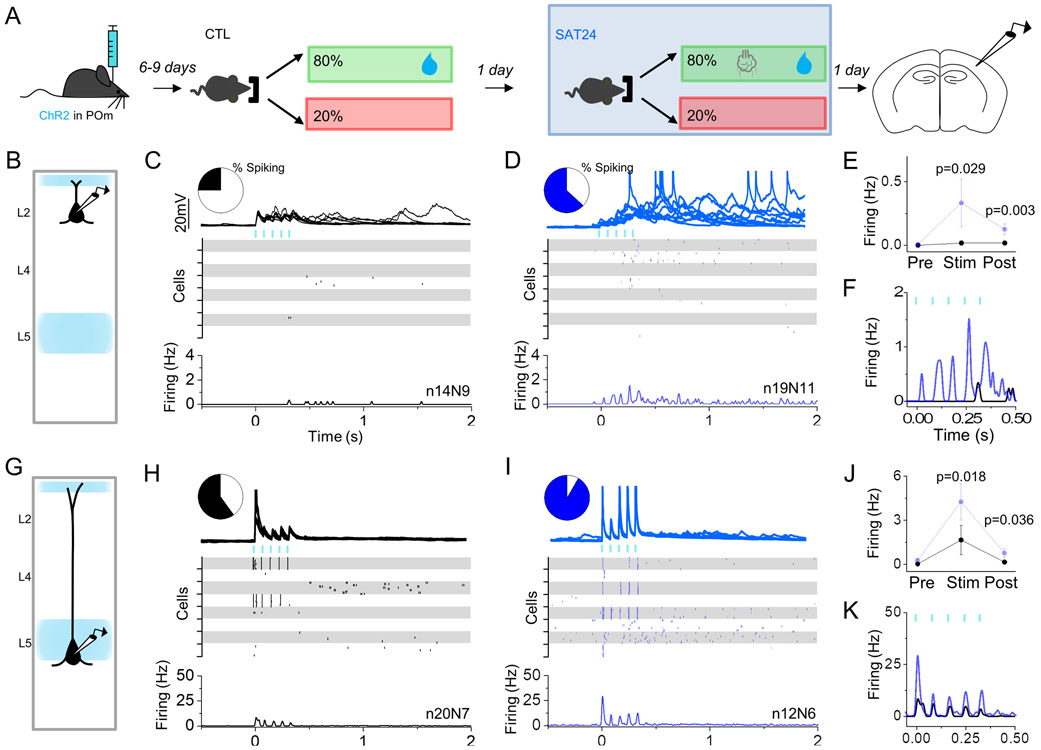
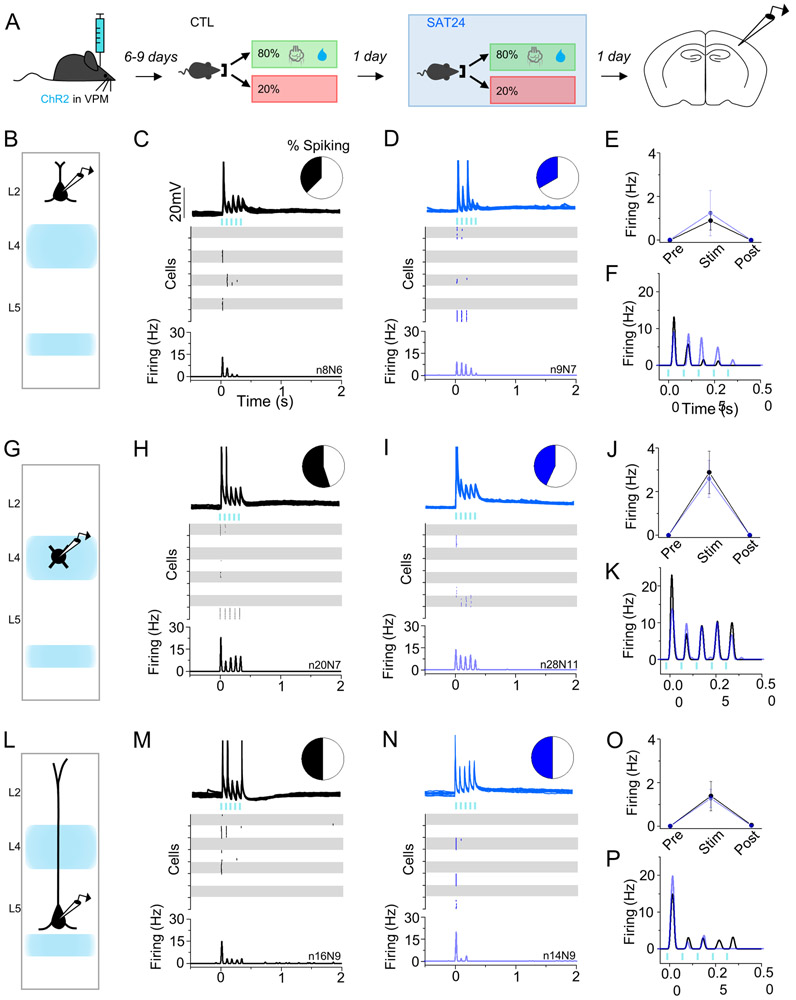
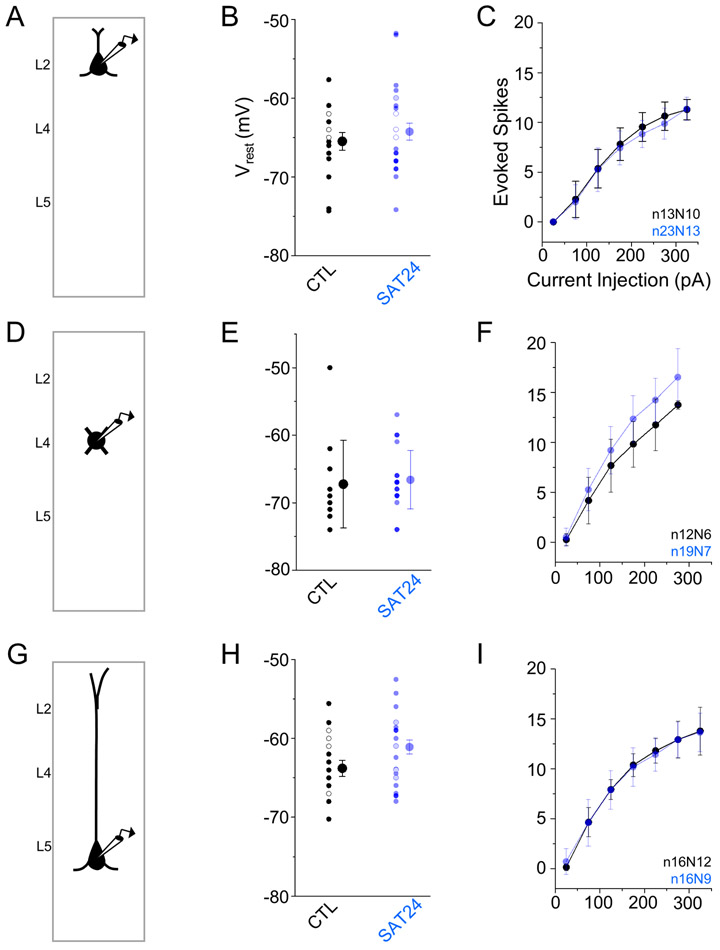
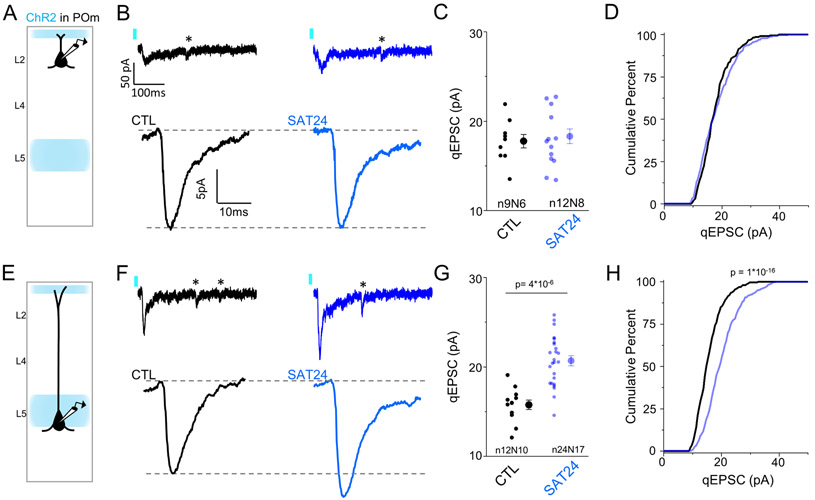
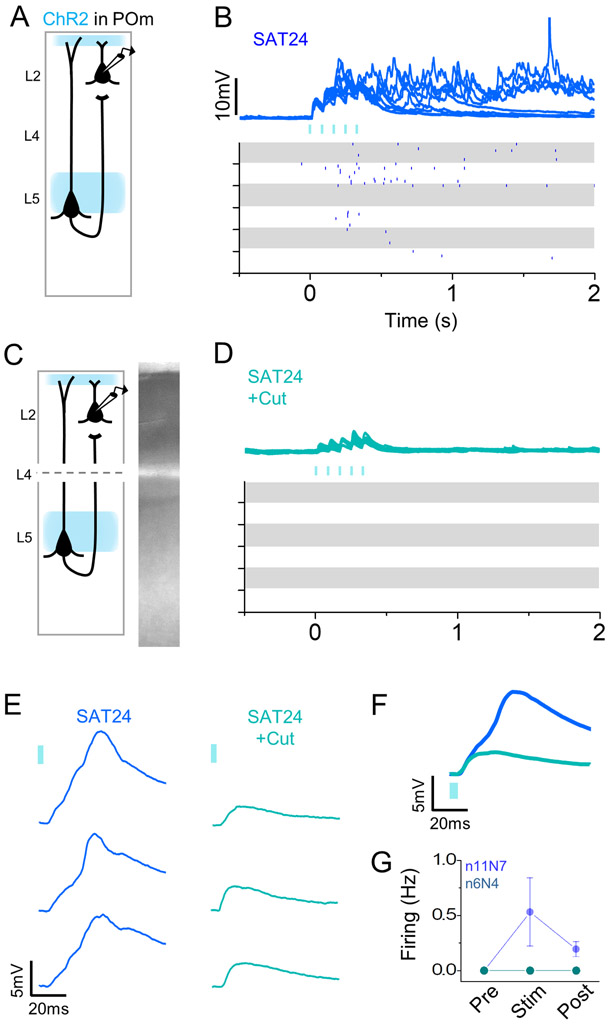
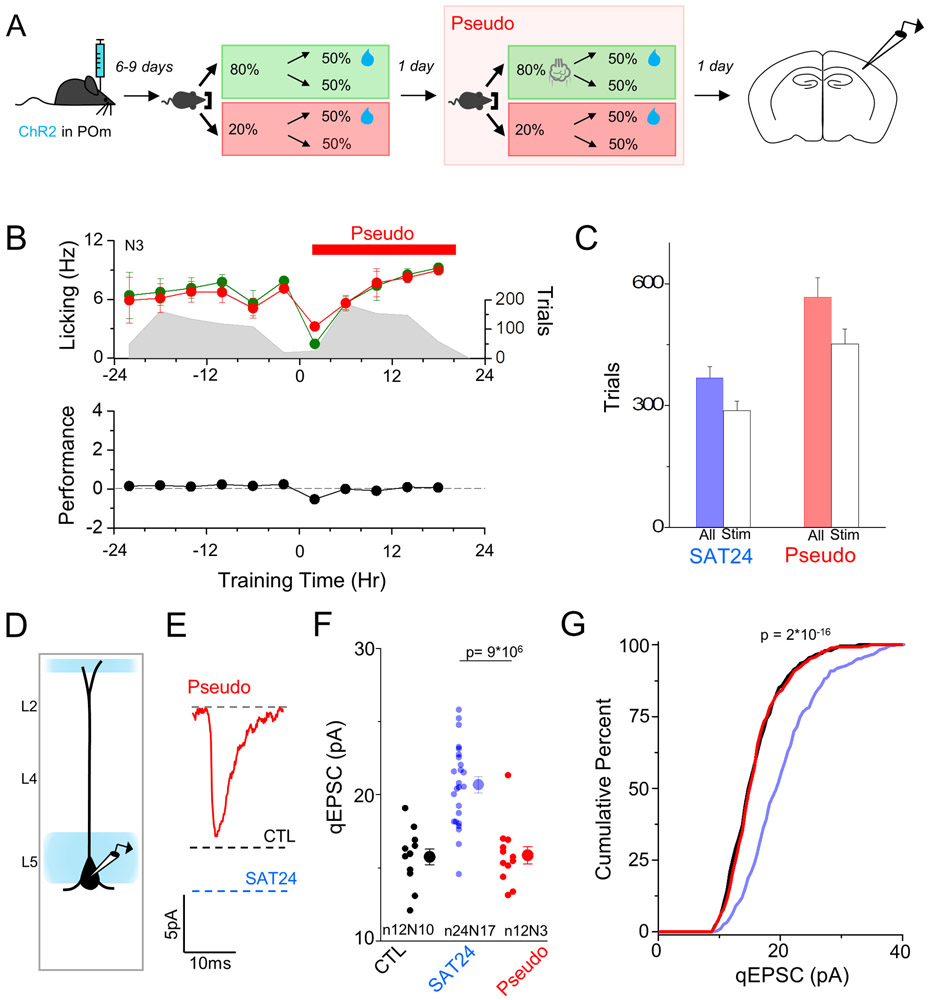
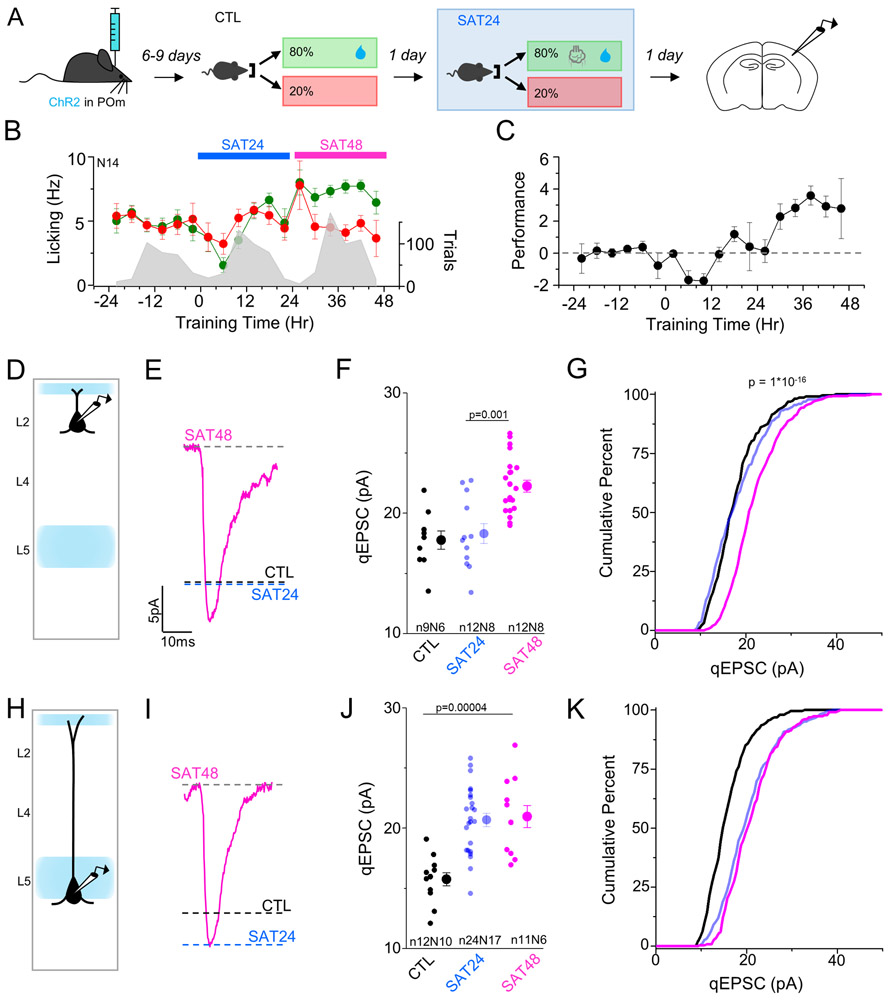
Neocortical circuits are sensitive to experience, showing both anatomical and electrophysiological changes in response to altered sensory input. We examined input- and cell-type-specific changes in thalamo- and intracortical pathways during learning using an automated, home-cage sensory association training (SAT) paradigm coupling multi-whisker stimulation to a water reward. We found that the posterior medial nucleus (POm) but not the ventral posterior medial (VPM) nucleus of the thalamus drives increased cortical activity after 24 h of SAT, when behavioral evidence of learning first emerges. Synaptic strengthening within the POm thalamocortical pathway was first observed at thalamic inputs to L5 and was not generated by sensory stimulation alone. Synaptic changes in L2 were delayed relative to L5, requiring 48 h of SAT to drive synaptic plasticity at thalamic and intracortical inputs onto L2 Pyr neurons. These data identify the POm thalamocortical circuit as a site of rapid synaptic plasticity during learning and suggest a temporal sequence to learning-evoked synaptic changes in the sensory cortex.


Figures

Figure 1.
Figure 1.. Automated home-cage training enables rapid acquisition of multi-whisker sensory association.
(A) Schematic of home-cage sensory association training cage (left) and image of mouse initiating a training trial (right). (B) Sensory association training paradigm. Upon IR beam-break measured nose poke, a random delay (200-800ms) occurs prior to trial initiation. Air puff delivery period (CS, 500ms duration, 4-6 PSI) occurs at t=0 following random delay with water delivery (US, 75ms, ~50uL) occurring at t=1s, leaving a 500ms delay in between the CS and US. A new trial could not be initiated until t=2s. (C,D) Identical trial structure during acclimation and SAT, with 80% of initiated trials providing water and air puff (no air puff during acclimation), and 20% of trials delivering neither air puff or water. (E,F) Average global lick rates (10ms bins) of mice during training trials on either acclimation day (E) or the last eight hrs (Hr 16-24) of training day 1 (F). Grey and white shading represent stimulus and water delivery, black box shows 300ms anticipatory lick window. N=11 animals for (E), (F). (G) Time course of anticipatory lick rates (left axis, 300ms prior to water delivery, 4 hr bins) throughout training for blank (red) and stim/water trials (green) averaged across all animals. Trial initiation counts (right axis) are shown in grey for the same time bins. (H) Performance defined as the difference in anticipatory lick rates between stim/water trials and blank trials during learning. (I) Individual animal paired comparisons (Wilcoxin Rank Sum Test) of lick rate for stim/water trials and blank trials on the last 20% of trials on day 1. Averages represented as mean ± SEM.
Figure 2.
Figure 2.. Increase in POm-evoked cortical activity after 24 hrs of SAT.
(A) Schematic of experiment with recordings performed in ChR2-injected mice after 24 hrs of acclimation and 24 hrs of SAT. (B) Schematic of POm axonal labeling and laminar pyramidal neuron recording site in L2. (C,D) POm-evoked activity (blue bars, 5 pulses, 5ms, 80 ms ISI) in L2 Pyr neurons of control animals that received 24 hrs of acclimation (left, black) and 24 hrs SAT (blue, right). Pie chart shows fraction of neurons that generated any action potentials following stimulation. Example cell response (top) shows 10 consecutive trials for an individual neuron. Raster (middle) shows spiking activity on 10 consecutive trials for 8 example cells. Global peri-stimulus time histogram (PSTH, bottom, 10ms bins) shows average firing frequency across all cells in group. (E) Average firing frequency across all cells during the 500ms preceding POm stimulation (Pre), during stimulation (Stim) and directly following stimulation (Post). (F) Overlay of POm-evoked spiking activity (10ms bins) for CTL (black) and SAT24 (blue) animals. (G-K) Same as C-F, but for L5 Pyr neurons. Averages represented as mean ± SEM. See also Figure S1.
Figure 3.
Figure 3.. No change in VPM-evoked cortical activity after 24 hrs of SAT.
(A) Schematic of experiment with recordings performed in ChR2-injected mice after 24 hrs of acclimation and 24 hrs of SAT. (B) Schematic of VPM axonal labeling and laminar pyramidal neuron recording site in L2. (C,D) VPM-evoked activity (blue bars, 5 pulses, 5ms, 80 ms ISI) in L2 Pyr neurons of control animals that received 24 hrs of acclimation (left, black) and 24 hrs SAT (blue, right). Pie chart shows fraction of neurons that generated any action potentials following stimulation. Example cell response (top) shows 10 consecutive trials for an individual neuron. Raster (middle) shows spiking activity on 10 consecutive trials for 8 example cells. Global PSTH (bottom, 10ms bins) shows average firing frequency across all cells in a population. (E) Average firing frequency across all cells during the 500ms preceding VPM stimulation (Pre), during stimulation (Stim) and directly following stimulation (Post). (F) Overlay of VPM-evoked spiking activity for CTL (black) and SAT24 (blue) animals. (G-K) Same as C-F, but for L4 excitatory neurons. (L-P) Same as C-F but for L5 Pyr neurons. Averages represented as mean ± SEM. See also Figure S2.
Figure 4.
Figure 4.. No change in intrinsic properties of cortical excitatory neurons after SAT.
(A) Schematic of experimental setup. (B) Average resting membrane potential of L2 Pyr neurons form CTL (black) and SAT24 (blue) animals. Open circles indicate cells recorded in the presence of the synaptic blockers picrotoxin (50uM), APV (50uM), and NBQX (25uM) and are included in the displayed average. (C) Average spike count during 500ms current injections (25pA steps) for L2 Pyr neurons from CTL (black) and SAT24 (blue) animals. Displayed values include a subset of cells recorded in the presence of synaptic blockers described in (B). (D-F) Same as (A-C) but for L4 excitatory neurons. (G-I) Same as (A-C) but for L5 Pyr neurons. Averages represented as mean ± SEM.
Figure 5.
Figure 5.. 24 hrs of SAT strengthens POm synaptic inputs onto L5 Pyr neurons.
(A) Schematic of experimental setup in L2 Pyr neurons. (B) Top: Example single trial showing Sr2+-desynchronized POm-evoked response in a L2 Pyr neuron where individual, isolated quantal events (*) follow an initial multiquantal response. Bottom: Global average qEPSCs from control animals (black, left) or in animals that received 24 hrs of SAT (blue, right). All well-isolated light-evoked qEPSCs in a cell (≥25 for inclusion) were aligned to rise time and averaged to generate an average cellular POm qEPSC. Cell averages were aligned to rise and averaged to generate global average qEPSC for each condition. (C) Quantification of mean qEPSC amplitude for each cell, measured as the mean of individual qEPSC peak amplitudes within a cell. (D) Cumulative distribution histogram of POm qEPSC amplitudes for CTL (black) and SAT24 (blue) animals. Distributions comprise 25 randomly selected events from each cell, compared using a K-S test. (E-H) Same as (A-D) but for L5 Pyr neurons. Averages represented as mean ± SEM. See also Figure S3.
Figure 6.
Figure 6.. Elevated POm-evoked activity in trained animals is driven by ascending input from infragranular layers.
(A) Schematic of experimental setup for ChR2-evoked firing of Pre-Cut L2 Pyr neurons in SAT24 animals. (B) Light-evoked activity (blue bars, 5 pulses, 5m, 80ms ISI) on 10 consecutive trials in an example L2Pyr cell (top) and for 10 example cells (bottom) in SAT24 animals. (C-D) Same as (A-B) but for L2 Pyr neurons after a mechanical incision through cortical L4. Each collected post-cut cell had at least one recorded L2 Pyr recording in the same slice prior to cut, and example cells in (B,D) were recorded in the same slice. (E) Comparison of subthreshold responses on 3 consecutive sweeps following the first light pulse for example cells in (B,D). (F) Average response (10 consecutive sweeps) to first light pulse for SAT24 (dark blue), and SAT24+Cut (light blue) example cells in (B,D). (G) Average firing frequency across all cells during the 500ms preceding VPM stimulation (Pre), during stimulation (Stim) and directly following stimulation (Post). Averages represented as mean ± SEM. See also Figure S4.
Figure 7.
Figure 7.. Sensory stimulation alone does not drive POm plasticity.
(A) Schematic of experimental setup and pseudo-training behavioral paradigm. Cages, training structure, stimulus, and timing were identical to SAT but water delivery (US) was uncoupled from (CS) and randomly delivered on 50% of trials regardless of CS presentation. (B) Time course of anticipatory lick rates (left axis, 300ms prior to water delivery, 4 hr bins) over the course of training for blank (20%, red) and stim trials (80%, green) averaged across all animals. Trial initiation counts (right axis) are shown in grey for the same time bins, red bar denotes pseudo-training period. (C) Comparison of animal-initiated trial counts during 24 hrs of SAT (blue) and Pseudotrained (red). Solid bars indicate total trials received while white bars show the number of stimulus (CS) trials received. (D) Schematic of experimental setup. (E) Global average qEPSC in Pseudotrained animals. All well-isolated light-evoked qEPSCs in a cell (≥25) were aligned to rise time and averaged to generate an average cellular POm qEPSC. Cell averages were aligned to rise and averaged to generate global average qEPSC. Global average POm qEPSC amplitudes in control (black) and SAT24 (blue) animals for comparison. (F) Quantification of average qEPSC amplitude for each cell, measured as the average of individual qEPSC peak amplitudes within a cell. CTL and SAT24 replotted from Fig. 4 (G) Cumulative distribution histogram of POm qEPSC amplitudes for CTL (black) and SAT24 (blue) animals and Pseudo-trained animals (red). Distributions comprise 25 randomly selected events from each cell and stats are for a K-S test between 24 hr and pseudo. Averages represented as mean ± SEM. See also Figure S5.
Figure 8.
Figure 8.. SAT drives sequential thalamocortical plasticity in L5 then L2 Pyramidal neurons.
(A) Schematic of experiment with recordings performed in ChR2-injected mice after 24 hrs of acclimation and 48 hrs of SAT. (B) Time course of anticipatory lick frequency (left axis, 300ms prior to water delivery, 4 hr bins) over the course of acclimation and training for blank (red) and stim/water trials (green) averaged across all animals (N=14 for all timepoints). Trial initiation counts (right axis) are shown in grey for the same time bins. (C) Quantification of performance defined as the difference in anticipatory lick rates between stim/water trials and blank trials during learning for the 4 hour bins shown in (B). (D) Schematic of experimental setup for recording POm qEPSCs in L2 Pyr neurons. (E) Global average qEPSC in SAT48 animals. All well-isolated light-evoked qEPSCs in a cell (≥25) were aligned to rise time and averaged to generate an average cellular POm qEPSC. Cell averages were aligned to rise and averaged to generate global average qEPSC. Global average POm qEPSC amplitudes in control (black) and SAT24 (blue) animals for comparison (F) Quantification of average qEPSC amplitude for each cell, measured as the average of individual qEPSC peak amplitudes within a cell for control (black), SAT24 (blue), and SAT48 (magenta) animals. (G) Cumulative distribution histogram of POm qEPSC amplitudes for CTL (black) and SAT24 (blue) animals and SAT48 animals (magenta). Distributions comprise 25 randomly selected events from each cell, K-S test compares Pseudo and 24 hrs. (H-K) Same as D-G but for L5 Pyr neurons. Averages represented as mean ± SEM. See also Figure S6.

Comment in

References

    1. Albieri G, Barnes SJ, De Celis Alonso B, Cheetham CEJ, Edwards CE, Lowe AS, Karunaratne H, Dear JP, Lee KC, and Finnerty GT (2015). Rapid bidirectional reorganization of cortical microcircuits. Cereb. Cortex 25, 3025–3035. - PMC - PubMed
    1. Alloway KD, Hoffer ZS, and Hoover JE (2003). Quantitative comparisons of corticothalamic topography within the ventrobasal complex and the posterior nucleus of the rodent thalamus. Brain Res 968, 54–68. - PubMed
    1. Arcaro MJ, Pinsk MA, and Kastner S (2015). The Anatomical and Functional Organization of the Human Visual Pulvinar. J. Neurosci 35, 9848–9871. - PMC - PubMed
    1. Audette NJ, Urban-Ciecko J, Matsushita M, and Barth AL (2017). POm Thalamocortical Input Drives Layer-Specific Microcircuits in Somatosensory Cortex. Cereb. Cortex 1–17. - PMC - PubMed
    1. Banerjee A, Meredith RM, Rodríguez-Moreno A, Mierau SB, Auberson YP, and Paulsen O (2009). Double dissociation of spike timing-dependent potentiation and depression by subunit-preferring NMDA receptor antagonists in mouse barrel cortex. Cereb. Cortex 19, 2959–2969. - PMC - PubMed

Publication types