. 2019 Jul:35:73-80.e2.
doi: 10.1016/j.annepidem.2019.03.006. Epub 2019 May 8.

Sociodemographic variation in the oral microbiome

Affiliations

Sociodemographic variation in the oral microbiome

Audrey Renson et al. Ann Epidemiol. 2019 Jul.

Abstract

Purpose: Variations in the oral microbiome are potentially implicated in social inequalities in oral disease, cancers, and metabolic disease. We describe sociodemographic variation of oral microbiomes in a diverse sample.

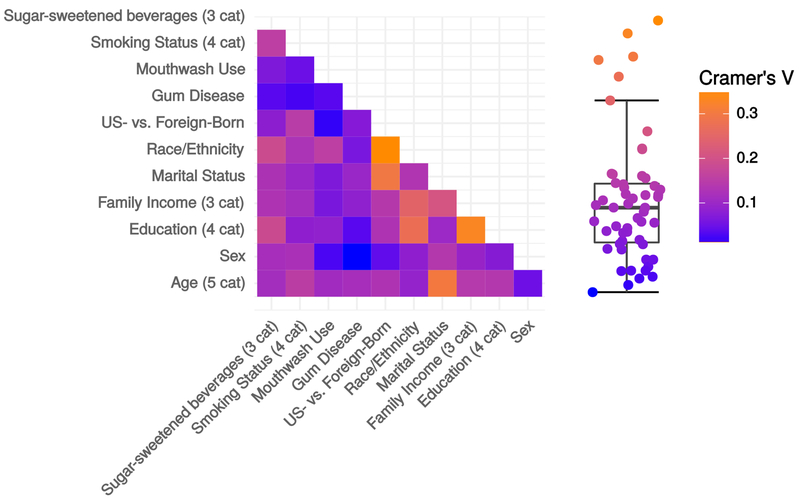
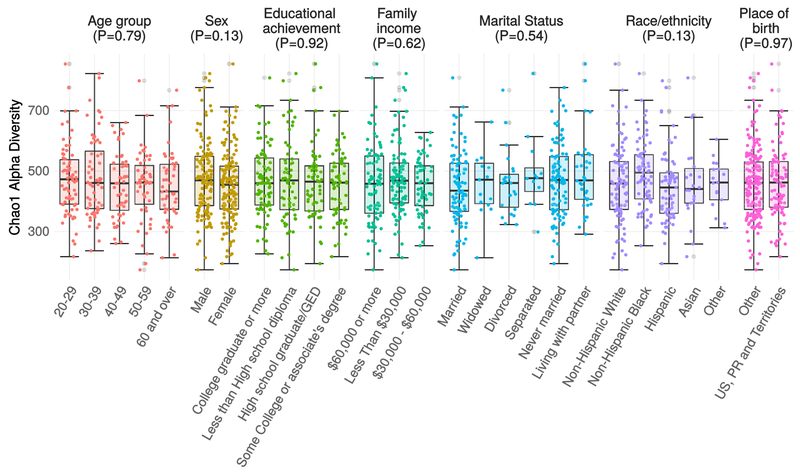
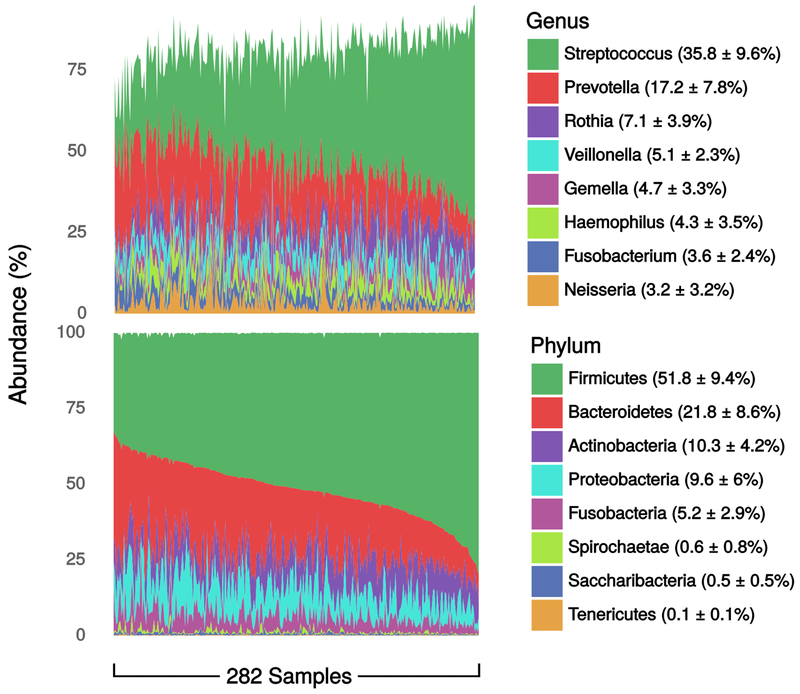
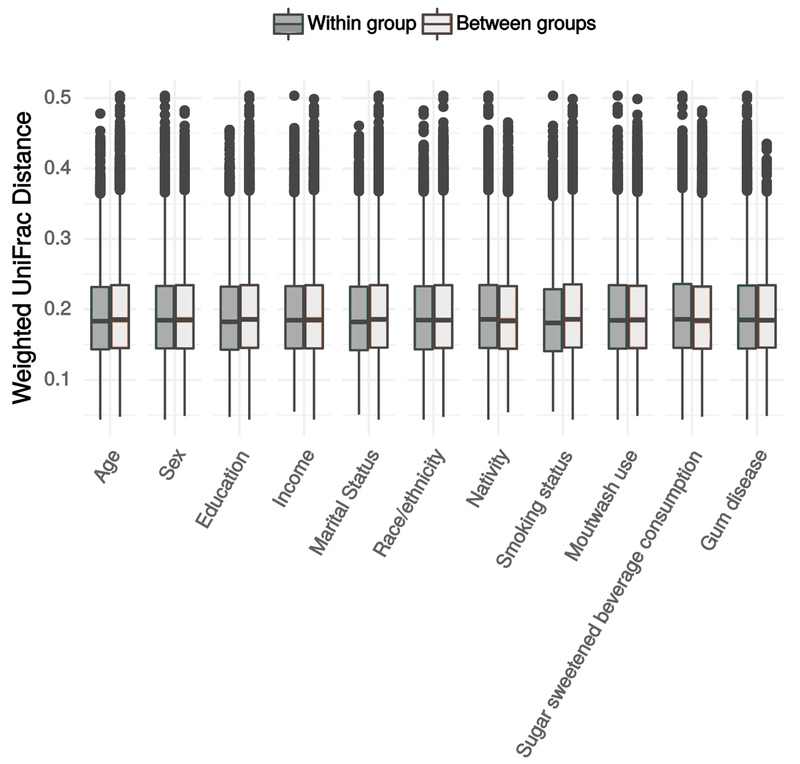
Methods: We performed 16S rRNA sequencing on mouthwash specimens in a subsample (n = 282) of the 2013-2014 population-based New York City Health and Nutrition Examination Study. We examined differential abundance of 216 operational taxonomic units, and alpha and beta diversity by age, sex, income, education, nativity, and race/ethnicity. For comparison, we examined differential abundance by diet, smoking status, and oral health behaviors.

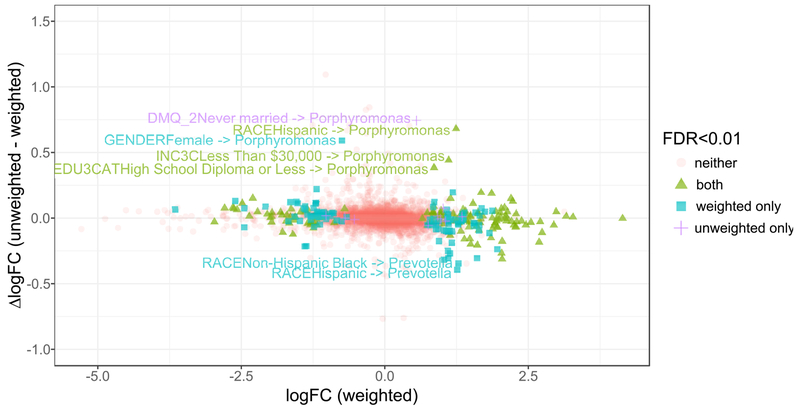
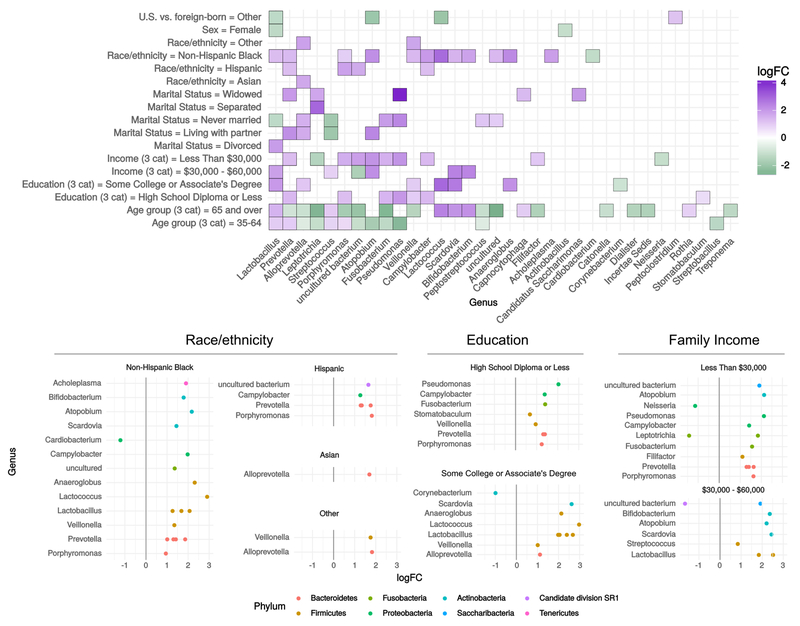
Results: Sixty-nine operational taxonomic units were differentially abundant by any sociodemographic variable (false discovery rate < 0.01), including 27 by race/ethnicity, 21 by family income, 19 by education, 3 by sex. We found 49 differentially abundant by smoking status, 23 by diet, 12 by oral health behaviors. Genera differing for multiple sociodemographic characteristics included Lactobacillus, Prevotella, Porphyromonas, Fusobacterium.

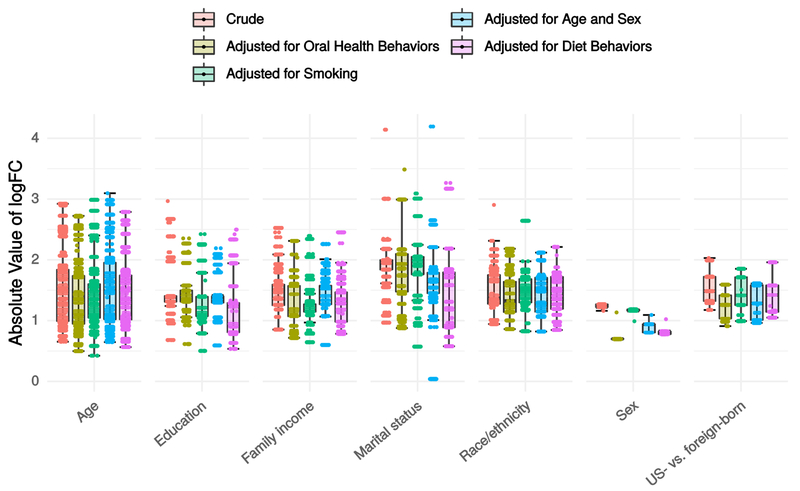
Conclusions: We identified oral microbiome variation consistent with health inequalities, more taxa differing by race/ethnicity than diet, and more by SES variables than oral health behaviors. Investigation is warranted into possible mediating effects of the oral microbiome in social disparities in oral and metabolic diseases and cancers.

Keywords: Demographics; Health disparities; Oral microbiome; Social epidemiology.


Figures

Figure A1.
Figure A1.
Examining collinearity among sociodemographic variables. Data are absolute value of pairwise Cramer’s V correlation coefficient between sociodemographic factor levels. Data are from the full sample (n=1,527) of the New York City Health and Nutrition Examination Survey, 2013-2014. Abbreviations: cat=categories; US=United States.
Figure A2.
Figure A2.
Alpha diversity by Sociodemographic Characteristics. Chao1 alpha diversity of 16S rRNA oral microbiome samples. Measures were compared using a null hypothesis of no difference between groups (Kruskal-Wallis test, p > 0.1 for all tests). Data are from the oral microbiome subsample (n=282) of the New York City Health and Nutrition Examination Survey, 2013-2014. Abbreviations: GED=General equivalency diploma; PR=Puerto Rico; US=United States.
Figure A3.
Figure A3.
Comparison of log fold change (logFC) estimates between crude unweighted models and models weighted for inverse probability of selection conditional on self-reported smoking status, logarithm cotinine, and their interaction. Differences in logFC estimates between unweighted and weighted models on the y-axis represent an approximation of the bias due to selection on smoking. Estimates are overall fairly concordant, with nearly all (99%) of OTU-variable pairs having an absolute difference in point estimate less than 0.35. Very few (n=10) hypotheses that were significant (FDR<0.01) in unweighted analysis were nonsignificant in weighted analysis. Of these, 9/10 had nearly identical point estimates but larger variance in the weighted models. In contrast, a large number of hypothesis tests that were nonsignificant in unweighted analysis were significant in weighted analysis. Specifically, weighting by selection for smoking identified 10 new significant OTUs for gender, 13 for age, 24 for education, 10 for income, 13 for marital status, 26 for race, and 8 for nativity. Where the two models disagreed on significance tests, the vast majority of disagreements were characterized by significance in the weighted model and nonsignificance in the unweighted model. Furthermore, the point estimates from the weighted models were more often further from the null than unweighted models.
Figure 1.
Figure 1.
Genus- and phylum-level relative abundances. Data are percent of overall communities within samples, summarized as mean ± standard deviation of percent across samples. Data are from the oral microbiome subsample (n=282) of the New York City Health and Nutrition Examination Survey, 2013-2014.
Figure 2.
Figure 2.
Differential abundance by sociodemographic characteristics. OTUs meeting unadjusted FDR < 0.01 in negative binomial log-linear GLMs using edgeR. Data are from the oral microbiome subsample (n=282) of the New York City Health and Nutrition Examination Survey, 2013-2014. Filled tiles in (A) indicate the genus had at least one OTU differentially abundant by at least one coefficient contrast within the sociodemographic factor. Where more than one OTU was significant within one genus, the maximum logFC is displayed in (A). Reference groups for sociodemographic variables are as follows: Sex: Male, Age: 20-34, Education: College Graduate or More, Family income: $60,000 or more, Marital status: Married, Race/ethnicity: Non-Hispanic White, US- vs. foreign-born: US-Born, 50 States, DC, PR and Territories. Abbreviations: cat=categories; GLM=generalized linear model; logFC=log fold change; OTU=operational taxonomic unit; US=United States.
Figure 3.
Figure 3.
Distribution of absolute values of log-fold change (logFC) in crude and adjusted negative binomial log-linear GLMs edgeR models for each sociodemographic variable. Data are from the oral microbiome subsample (n=282) of the New York City Health and Nutrition Examination Survey, 2013-2014. Abbreviations: GLM=generalized linear model; logFC=log fold change; US=United States.
Figure 4.
Figure 4.
Within and between group beta diversity estimate distributions. Data are from the oral microbiome subsample (n=282) of the New York City Health and Nutrition Examination Survey, 2013-2014. Abbreviations: cat=category.

References

    1. Huang DL, Park M. Socioeconomic and racial/ethnic oral health disparities among US older adults: oral health quality of life and dentition. J Public Health Dent. 2015;75(2):85–92. - PMC - PubMed
    1. Karlamangla AS, Merkin SS, Crimmins EM, Seeman TE. Socioeconomic and ethnic disparities in cardiovascular risk in the United States, 2001–2006. Annals of epidemiology. 2010;20(8):617–28. - PMC - PubMed
    1. Beckles GL, Chou C-F. Disparities in the Prevalence of Diagnosed Diabetes - United States, 1999-2002 and 2011-2014. MMWR Morb Mortal Wkly Rep 2016;65(45):1265–9. - PubMed
    1. Cohen JM, Wilson ML, Aiello AE. Analysis of social epidemiology research on infectious diseases: historical patterns and future opportunities. J Epidemiol Community Health. 2007;61(12):1021–7. - PMC - PubMed
    1. Aiello AE, Dowd JB. Socio-economic Status and Immunosenescence Immunosenescence: Springer, New York, NY; 2013. p. 145–57.