. 2019 May 31;4(35):eaaw0902.
doi: 10.1126/sciimmunol.aaw0902.

CTLA-4-mediated transendocytosis of costimulatory molecules primarily targets migratory dendritic cells

Affiliations

CTLA-4-mediated transendocytosis of costimulatory molecules primarily targets migratory dendritic cells

Vitalijs Ovcinnikovs et al. Sci Immunol. .

Abstract

CTLA-4 is a critical negative regulator of the immune system and a major target for immunotherapy. However, precisely how it functions in vivo to maintain immune homeostasis is not clear. As a highly endocytic molecule, CTLA-4 can capture costimulatory ligands from opposing cells by a process of transendocytosis (TE). By restricting costimulatory ligand expression in this manner, CTLA-4 controls the CD28-dependent activation of T cells. Regulatory T cells (Tregs) constitutively express CTLA-4 at high levels and, in its absence, show defects in TE and suppressive function. Activated conventional T cells (Tconv) are also capable of CTLA-4-dependent TE; however, the relative use of this mechanism by Tregs and Tconv in vivo remains unclear. Here, we set out to characterize both the perpetrators and cellular targets of CTLA-4 TE in vivo. We found that Tregs showed constitutive cell surface recruitment of CTLA-4 ex vivo and performed TE rapidly after TCR stimulation. Tregs outperformed activated Tconv at TE in vivo, and expression of ICOS marked Tregs with this capability. Using TCR transgenic Tregs that recognize a protein expressed in the pancreas, we showed that the presentation of tissue-derived self-antigen could trigger Tregs to capture costimulatory ligands in vivo. Last, we identified migratory dendritic cells (DCs) as the major target for Treg-based CTLA-4-dependent regulation in the steady state. These data support a model in which CTLA-4 expressed on Tregs dynamically regulates the phenotype of DCs trafficking to lymph nodes from peripheral tissues in an antigen-dependent manner.


Conflict of interest statement

Competing interests: The authors declare that they have no competing interests.

Figures

Fig. 1
Fig. 1
Constitutive cycling of CTLA-4 in Treg. CD4 T cells from BALB/c LNs were cultured in the presence or absence of anti-CD3/anti-CD28 beads at a 2:1 (T:Bead) ratio for 6, 12 or 24 hours and analysed by flow cytometry. (A) Representative FACS plots showing CTLA-4 expression by Tregs (CD4+Foxp3+) and Tconv (CD4+Foxp3-). CTLA-4 was stained on intact cells at 4°C (Surface), at 37°C for 2 hours (Cycling), or on fixed and permeabilised cells (Total). (B) Collated data showing mean ± SD (n=3-4); **p≤0.01, ***p≤0.001, ****p≤0.0001, ns=not significant, two-way ANOVA. Data are representative of at least four independent experiments. Raw data for 12 and 24 hours is shown in Fig. S1.
Fig. 2
Fig. 2
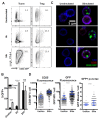
TE by Tregs and Tconv in vitro. (A-B) CD4 T cells from BALB/c LNs were co-cultured with CD80-GFP expressing CHO cells at a 1:1 ratio in the absence of stimulation or with 0.8μg/ml anti-CD3 Ab for 6 or 24 hours. (A) Representative FACS plots showing total CTLA-4 expression and GFP uptake by Tregs (CD4+Foxp3+) and Tconv (CD4+Foxp3-). (B) Collated data (n=4) showing fraction of GFP-positive cells. (C-D) MACS purified Tregs were cultured overnight with CD80-GFP expressing CHO cells at 1:1 ratio, with or without anti-CD3 Ab; 25nM BafA was added for the final 4 hours of culture. Donor CHO cells were removed by magnetic separation and T cells imaged by confocal microscopy at 20x magnification. (C) Confocal images representative of at least 3 independent experiments. (D) Scoring of confocal images. Each point in unstimulated (n=446) and stimulated (n=323) conditions represents an individual cell from 11-12 separate images. Plots show mean signal intensity of CD25 and GFP and number of GFP fluorescence maxima (representing distinct GFP-filled punctae) per cell. Graphs show mean + SD (CD25 Fluorescence, GFP Fluorescence), mean ± SD (GFP+ punctae); ***p≤0.001, ****p≤0.0001, ns=not significant, two-tailed paired (B) or unpaired (C) Student’s t tests. Data are representative of three independent experiments.
Fig. 3
Fig. 3
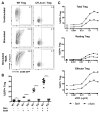
TE is CTLA-4-dependent and constitutively active in effector Tregs. (A-B) CD4 T cells isolated from LNs of mixed BM chimeric mice containing CTLA-4-sufficient (WT) and CTLA-4-deficient (KO) cells were co-cultured with CD80-GFP expressing CHO cells at a 1:1 ratio for 6 hours in the presence of 0.8μg/ml anti-CD3 Ab. Lysosomal degradation was inhibited with 25nM BafA where indicated. (A) Representative FACS plots showing acquisition of CD80-GFP by WT and CTLA-4-/- Foxp3+ Tregs. (B) Collated data from at least three independent experiments (n=6-9). Mean ± SD; **p≤0.01, ****p≤0.0001, paired two-tailed Student’s t test. (C) CD4 T cells from BALB/c LNs (n=5) were co-cultured with CD80-GFP expressing CHO cells at a 1:1 ratio for 6 hours in the presence of different anti-CD3 Ab concentrations. 100μM TAPI-2 was added to inhibit shedding of CD62L. Graphs show the frequency of GFP positive cells within all Tregs (Total Treg), CD45RB+CD62L+ Treg (resting Treg) or CD45RB-CD62L-(effector Treg) and are representative of two independent experiments.
Fig. 4
Fig. 4
Preferential TE by Tregs in vivo. CD80-GFP expressing mice were injected i.v. with 5-10 x 106 CD4 T cells from DO11 x RIP-mOVA mice and immunised with OVA/alum 24 hours later. 7 days post T cell transfer, mice were challenged with OVA peptide for 6 hours, in the presence of chloroquine to inhibit lysosomal degradation (600μg i.p.) for the last 3 hours. (A) Acquisition of CD80-GFP by DO11 Tconv (CD4+Foxp3-) and DO11 Tregs (CD4+Foxp3+) from spleens of immunised or unimmunised mice. Plots are representative of at least three independent experiments. (B) Splenocytes were enriched for CD4+ T cells, stained for CD4 and CD25 and imaged at 20x magnification. Images are representative of at least four independent experiments. (C) tSNE dimensionality reduction analysis of CD3+CD4+ T cells in the immunised setting. GFP +ve cells are highlighted by the black gate. Colour axes shows median expression of GFP, Foxp3, CD25, CTLA-4, DO11 and ICOS in each cell.
Fig. 5
Fig. 5
Ligand capture by Tregs in response to tissue-expressed self-antigen. (A) DO11 Tconv (CD4+Foxp3-) and Tregs (CD4+Foxp3+) from spleens, peripheral LN (axillary, brachial, inguinal and cervical; pLN), pancreatic lymph nodes (PanLN) and the pancreas of 12 week old DO11 x RIP-mOVA mice (n=3) were stained for intracellular CTLA-4 expression and analysed by flow cytometry. (B) Representative FACS plots showing expression of ICOS and CTLA-4 in DO11 Tregs and Tconv in the pancreas. (C) Correlation of ICOS and CTLA-4 expression in Tregs and Tconv from lymphoid tissues and the pancreas of DO11 and DO11 x RIP-mOVA mice (n=60 datapoints from 6 mice). Lines have been added to map linear relationships for visualisation purposes. p value denotes comparison of the z-transformed r values. (D-E) CD80-GFP expressing mice, or mock-transduced mice (GFP-), with or without pancreatic expression of OVA were injected i.p. with 5-10 x 106 CD4 T cells from DO11 x RIP-mOVA mice. 6 days post T cell transfer mice were injected with chloroquine (600µg i.p.). (D) Representative FACS plots showing acquisition of CD80-GFP by DO11 Tregs and DO11 Tconv in the pancreas at day 7. (E) Collated data from three independent experiments showing mean ± SD. *p≤0.05, **p≤0.01, ***p≤0.001, ****p≤0.0001, multiple t tests.
Fig. 6
Fig. 6
CTLA-4-dependent modulation of cDC phenotype by polyclonal Tregs. CD80-GFP expressing mice were injected i.v. with 5-10 x 106 BALB/c CD4 T cells. CTLA-4 was blocked by i.p. injection of 500µg anti-CTLA-4 Ab every 2-3 days. 6 days post T cell transfer, mice were injected with chloroquine (600µg i.p.) and 24 hours later splenocytes were analysed by flow cytometry. (A) Representative FACS plots and (B) collated data showing acquisition of CD80-GFP by Tconv (CD4+Foxp3-) and Tregs (CD4+Foxp3+) (n=4-8). Data are representative of four independent experiments. (C) Frequency of the CD80+GFP+ population or (D) overall expression of CD80 within Lin-MHCII+CD11c+CD26+ cDCs in mice that received BALB/c CD4 T cells (+CD4) and controls (-CD4). Data show one representative experiment (n=2) of two independent experiments. Mean ± SD; **p≤0.01, ****p≤0.0001, ns=not significant, unpaired two-tailed Student’s t test.
Fig. 7
Fig. 7
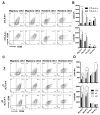
Impact of CTLA-4 ablation on CD80 and CD86 expression in LN cDC subsets. (A, B) LNs (axillary, brachial, inguinal and cervical) from 17-18 day old CTLA-4-/- mice or CTLA-4+/- littermate controls were digested and cells stained for analysis by flow cytometry. (A) Representative FACS plots showing CD80 and CD86 expression on migratory and resident cDC subsets. (B) Collated data showing CD80 and CD86 expression on migratory and resident cDCs (n=3). (C,D) BALB/c mice were treated with anti-CTLA-4 Ab or control IgG (Ctrl) and harvested after 1 or 4 days (1 or 2 doses of 500 µg anti-CTLA-4 Ab respectively). LNs (axillary, brachial, inguinal and cervical) were digested and cells stained for cDC markers and CD80 and CD86. (C) Representative FACS plots and (D) collated data (n=3-4) are shown. Mean ± SD; **p≤0.01, ****p≤0.0001, ns=not significant. Statistical significance was determined by two-way ANOVA. Data show one representative experiment of three independent experiments.
Fig. 8
Fig. 8
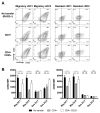
Impact of T cell transfer on CD80 and CD86 expression in LN cDC subsets. Rag2-/- recipient mice were injected with 6 x 10⁶ bulk CD4 T cells or 5.5 x 10⁶ CD25-depleted CD4 T cells. Six days later, LNs (axillary, brachial, inguinal and cervical) were digested and cells stained for analysis by flow cytometry. (A) Representative FACS plots showing CD80 and CD86 expression on migratory and resident cDC subsets. (B) Collated data of CD80, CD86 and MHCII expression (n=3-4). Mean ± SD; *p≤0.05, **p≤0.01, ***p≤0.001, ****p≤0.0001, two-way ANOVA. Data are representative of at least four independent experiments.

References

    1. Waterhouse P, Penninger JM, Timms E, Wakeham A, Shahinian A, Lee KP, Thompson CB, Griesser H, Mak TW. Lymphoproliferative disorders with early lethality in mice deficient in Ctla-4. Science. 1995;270:985–988. - PubMed
    1. Tivol EA, Borriello F, Schweitzer AN, Lynch WP, Bluestone JA, Sharpe AH. Loss of CTLA-4 leads to massive lymphoproliferation and fatal multiorgan tissue destruction, revealing a critical negative regulatory role of CTLA-4. Immunity. 1995;3:541–547. - PubMed
    1. Ise W, Kohyama M, Nutsch KM, Lee HM, Suri A, Unanue ER, Murphy TL, Murphy KM. CTLA-4 suppresses the pathogenicity of self antigen-specific T cells by cell-intrinsic and cell-extrinsic mechanisms. Nat Immunol. 2010;11:129–135. - PMC - PubMed
    1. Kuehn HS, Ouyang W, Lo B, Deenick EK, Niemela JE, Avery DT, Schickel JN, Tran DQ, Stoddard J, Zhang Y, Frucht DM, et al. Immune dysregulation in human subjects with heterozygous germline mutations in CTLA4. Science. 2014;345:1623–1627. - PMC - PubMed
    1. Schubert D, Bode C, Kenefeck R, Hou TZ, Wing JB, Kennedy A, Bulashevska A, Petersen BS, Schaffer AA, Gruning BA, Unger S, et al. Autosomal dominant immune dysregulation syndrome in humans with CTLA4 mutations. Nature Medicine. 2014;20:1410–1416. - PMC - PubMed

Publication types