. 2019 Jul 31;39(31):6202-6215.
doi: 10.1523/JNEUROSCI.2064-18.2019. Epub 2019 May 31.

Is Optogenetic Activation of Vglut1-Positive Aβ Low-Threshold Mechanoreceptors Sufficient to Induce Tactile Allodynia in Mice after Nerve Injury?

Affiliations

Is Optogenetic Activation of Vglut1-Positive Aβ Low-Threshold Mechanoreceptors Sufficient to Induce Tactile Allodynia in Mice after Nerve Injury?

Alexander Chamessian et al. J Neurosci. .

Abstract

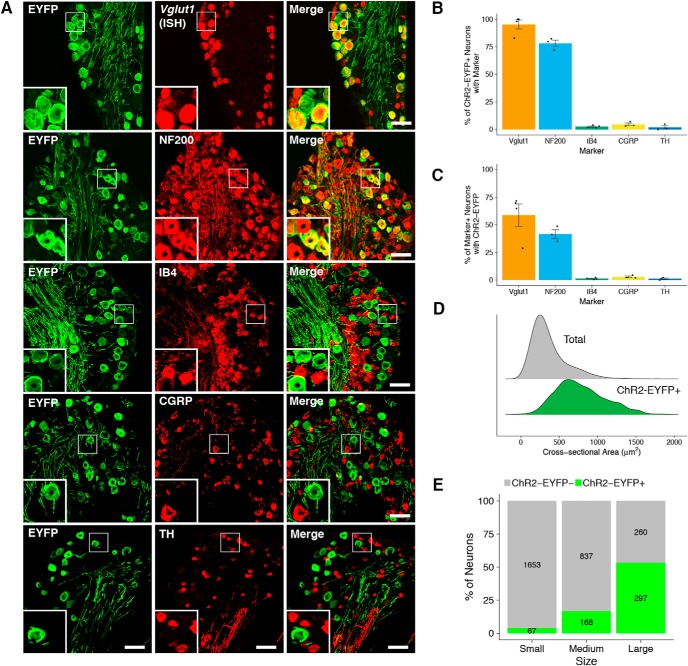
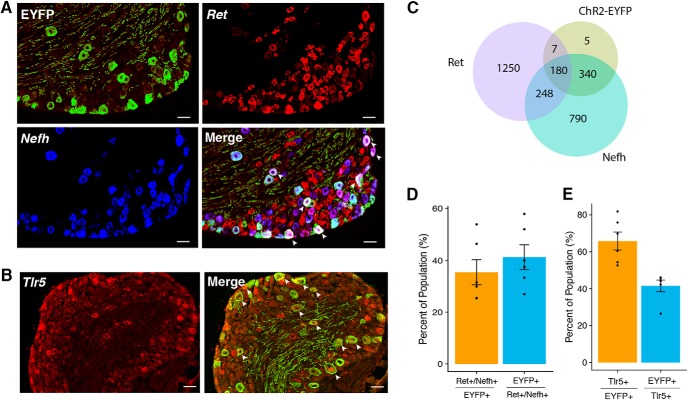
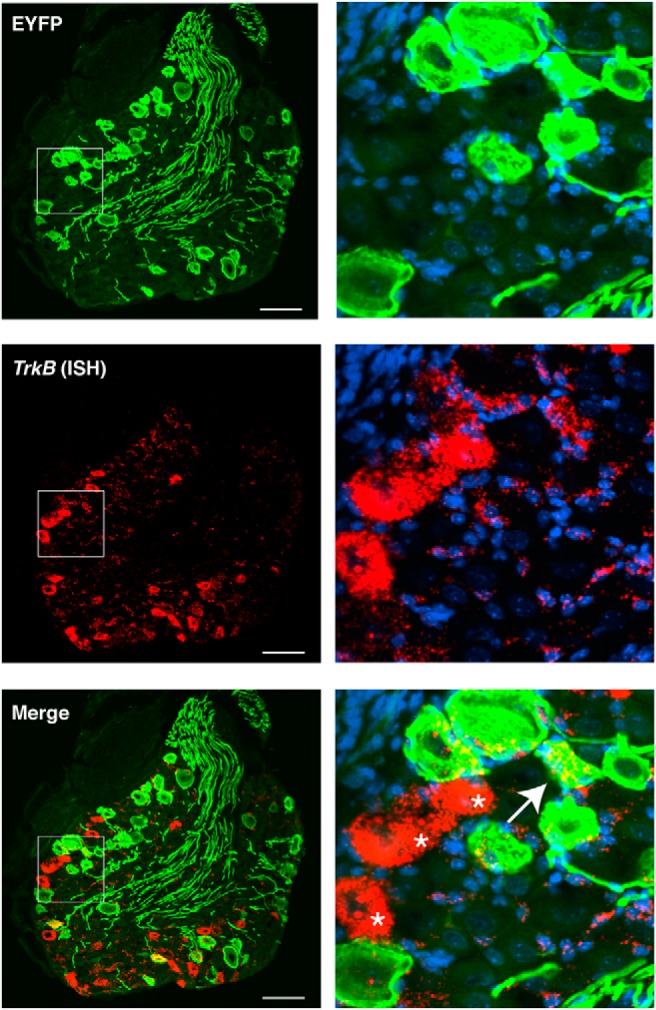
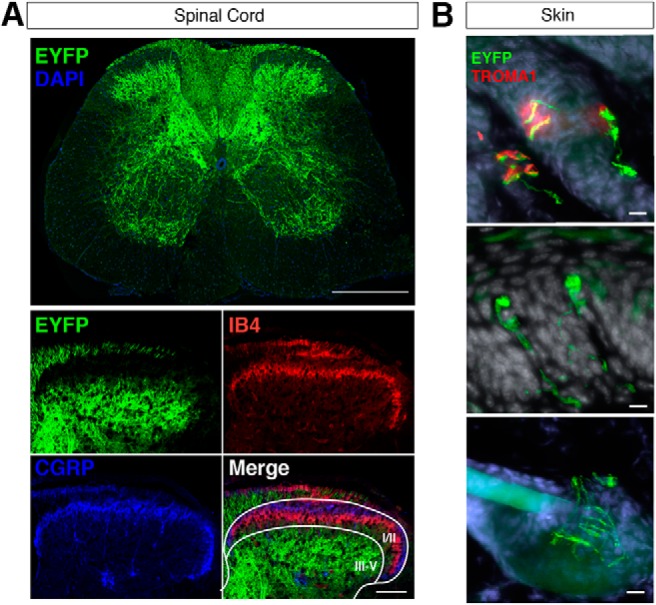
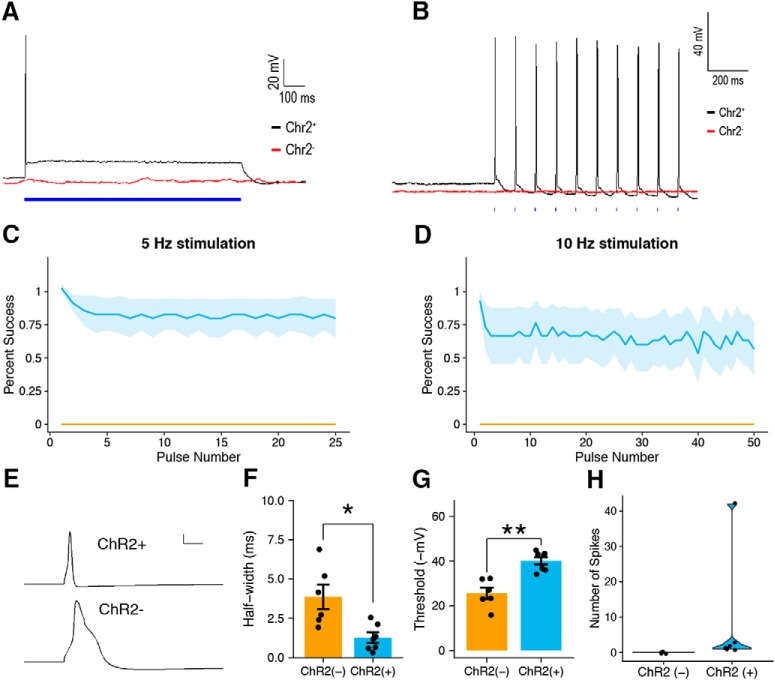
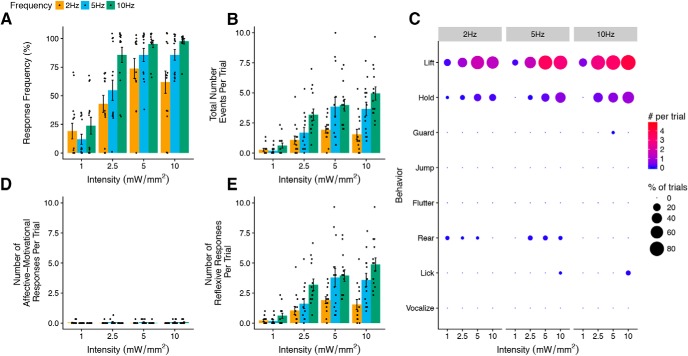
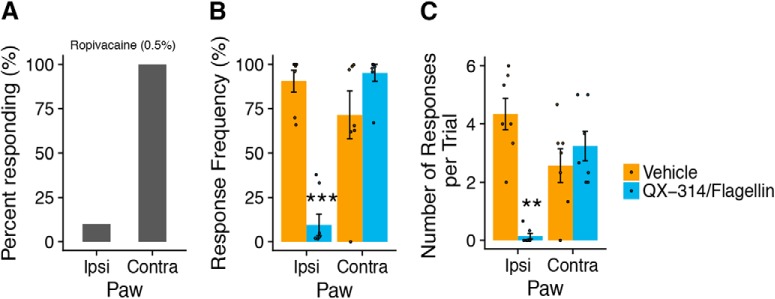
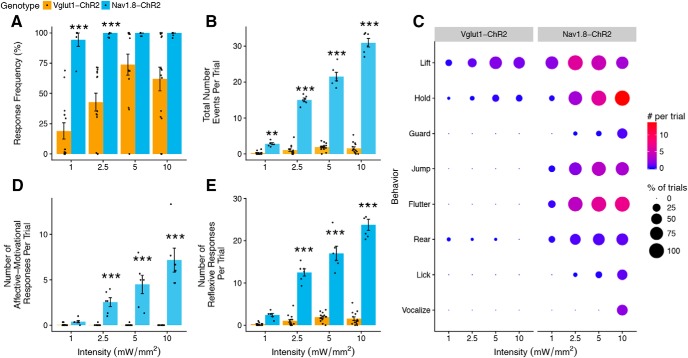
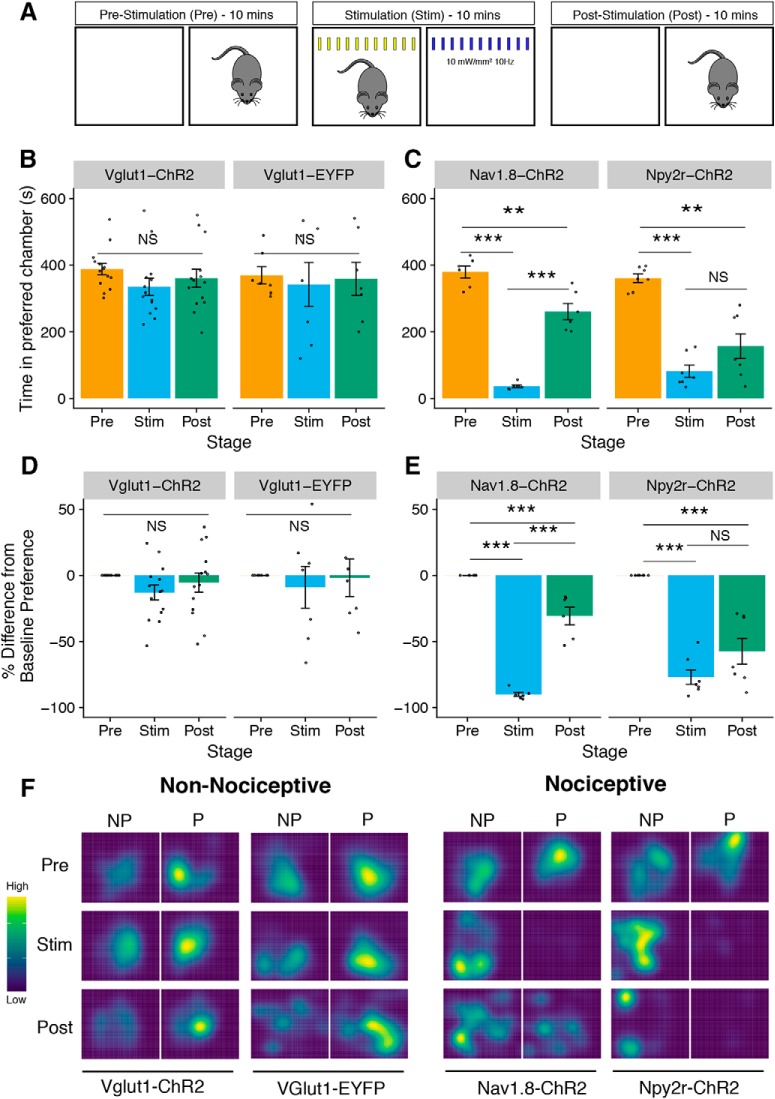
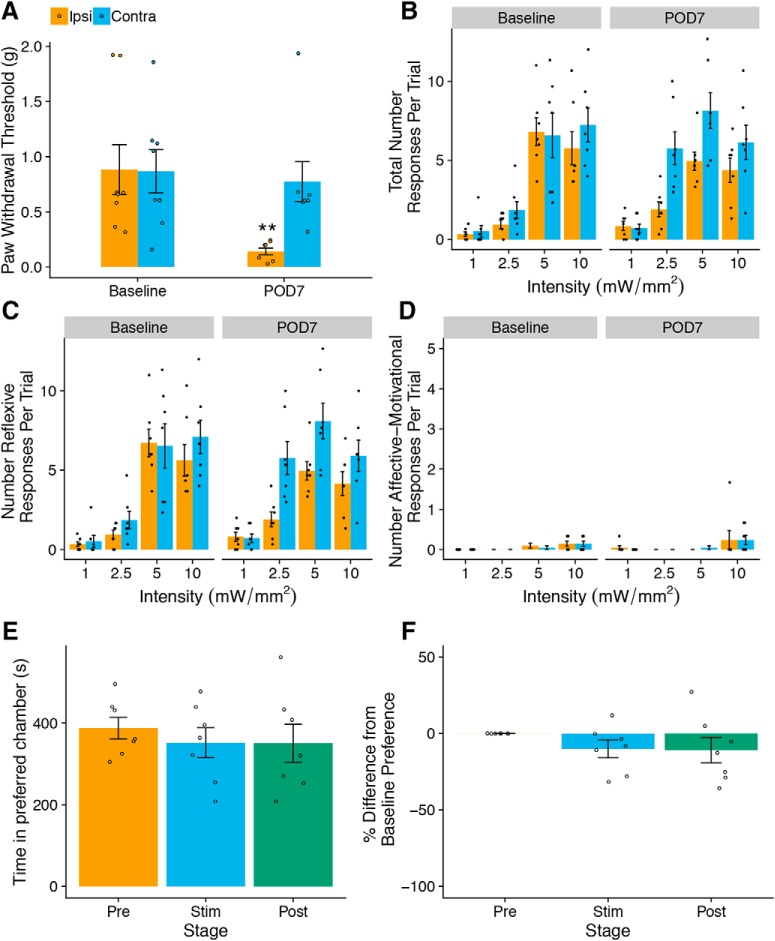
Mechanical allodynia is a cardinal feature of pathological pain. Recent work has demonstrated the necessity of Aβ-low-threshold mechanoreceptors (Aβ-LTMRs) for mechanical allodynia-like behaviors in mice, but it remains unclear whether these neurons are sufficient to produce pain under pathological conditions. We generated a transgenic mouse in which channelrhodopsin-2 (ChR2) is conditionally expressed in vesicular glutamate transporter 1 (Vglut1) sensory neurons (Vglut1-ChR2), which is a heterogeneous population of large-sized sensory neurons with features consistent with Aβ-LTMRs. In naive male Vglut1-ChR2 mice, transdermal hindpaw photostimulation evoked withdrawal behaviors in an intensity- and frequency-dependent manner, which were abolished by local anesthetic and selective A-fiber blockade. Surprisingly, male Vglut1-ChR2 mice did not show significant differences in light-evoked behaviors or real-time aversion after nerve injury despite marked hypersensitivity to punctate mechanical stimuli. We conclude that optogenetic activation of cutaneous Vglut1-ChR2 neurons alone is not sufficient to produce pain-like behaviors in neuropathic mice.SIGNIFICANCE STATEMENT Mechanical allodynia, in which innocuous touch is perceived as pain, is a common feature of pathological pain. To test the contribution of low-threshold mechanoreceptors (LTMRs) to nerve-injury-induced mechanical allodynia, we generated and characterized a new transgenic mouse (Vglut1-ChR2) to optogenetically activate cutaneous vesicular glutamate transporter 1 (Vglut1)-positive LTMRs. Using this mouse, we found that light-evoked behaviors were unchanged by nerve injury, which suggests that activation of Vglut1-positive LTMRs alone is not sufficient to produce pain. The Vglut1-ChR2 mouse will be broadly useful for the study of touch, pain, and itch.

Keywords: allodynia; neuropathic; optogenetics; pain.


Figures

Figure 1.
Figure 1.
Cellular distribution of ChR2-EYFP in dorsal root ganglia. A, ChR2-EYFP coexpression with selected markers in DRG. Scale bar, 50 μm. B, C, Quantification of coexpression of ChR2-EYFP with selected markers (mean ± SEM, n = 4 animals, 3–4 sections/animal). D, Size distribution of all (total) and ChR2-EYFP-positive DRG neurons expressed as probability density. E, Proportion of ChR2-EYFP-positive neurons in each size class of DRG neuron. Small: <300 μm; medium, 300–600 μm; large, >600 μm. Values inside bars represent the number of ChR2-EYFP-positive (green) and ChR2-EYFP-negative (gray) neurons in each size class (n = 6 animals, 2–3 sections/animal).
Figure 2.
Figure 2.
Coexpression with Aβ-LTMR markers. A, B, Coexpression of ChR2-EYFP with Nefh and Ret (A) and Tlr5 (B). Scale bar, 50 μm. Arrows indicate cells that coexpress all markers. C, Venn diagram of ChR2-EYFP, Nefh, and Ret. D, E, Quantification of coexpression for ChR2-EYFP, Nefh, and Ret represented as a percentage of the population (mean ± SEM, n = 6 animals, 2–3 sections/animal).
Figure 3.
Figure 3.
Expression of TrkB in Vglut1-Chr2 DRG. Left, Coexpression of ChR2-EYFP transcript by ISH. Arrow indicates a ChR2-EYFP-positive neuron coexpressing low levels of TrkB. Asterisk indicates highly expressing TrkB-positive neurons that lack ChR2-EYFP expression, which are likely Aδ-LTMRs. Note the expression of TrkB around the circumference of ChR2-EYFP-positive neurons, likely in satellite glia cells. Scale bar, 50 μm. Right, Magnification of inset.
Figure 4.
Figure 4.
Spinal and cutaneous projections of ChR2-EYFP-positive neurons in Vglut1-ChR2. A, Low magnification of ChR2-EYFP-positive afferents in the lumbar spinal cord (top). Scale bar, 500 μm. High-magnification images of ChR2-EYFP-positive, CGRP-positive, and IB4-positive afferents in the dorsal horn (bottom). Scale bar, 100 μm. Laminar borders (white) are represented in the merged image. B, Cutaneous projections of ChR2-EYFP-positive afferents in glabrous (top and middle) and hairy (bottom) skin. In the top panel, ChR2-EYFP-positive afferents make direct contacts with TROMA1-positive (red) Merkel cells in glabrous skin. Scale bar, 10 μm.
Figure 5.
Figure 5.
Patch-clamp electrophysiology of ChR2-EYFP-positive and ChR2-EYFP-negative DRG neurons. A, Continuous exposure to 470 nm light for 1 s resulted in depolarization and light-evoked action potentials in ChR2-EYFP-positive DRG neurons (black) but not ChR2-EYFP-negative neurons (red). B, Exposure to light at 10 Hz drove phase-locked action potential firing in ChR2-EYFP-positive DRG neurons (black) but not ChR2-EYFP-negative controls (red). C, D, Success rate at 5 Hz and 10 Hz photostimulation of ChR2-EYFP-positive (n = 7) and ChR2-EYFP-negative (n = 4) neurons. E, Representative action potential waveforms from ChR2-EYFP-positive (top) and ChR2-EYFP-negative (bottom) DRG neurons. F, Width of the action potential waveform at half-maximum amplitude of ChR2-EYFP-positive and ChR2-EYFP-negative DRG neurons (Student's two-tailed t test, *p < 0.05). G, Action potential threshold of ChR2-EYFP-positive and ChR2-EYFP-negative DRG neurons (Student's two-tailed t test, **p < 0.005). H, Number of spikes under continuous photostimulation in ChR2-EYFP positive and ChR2-EYFP-negative neurons. C, D, and FH are shown as means ± SEM.
Figure 6.
Figure 6.
Light-evoked withdrawal behaviors in naive Vglut1-ChR2 mice. A, Response frequency (i.e., the fraction of all trials with at least one response per trial) increases with the intensity and frequency of light stimulation (n = 14). B, Total number of all behavioral responses increases with intensity and frequency of light stimulation (n = 14). C, Dot plot representation of individual scored behaviors at each intensity and frequency combination. The size of each dot represents the percent of trials in which the behavior was observed, and the color represents the total number of a given behavior per trial, with red indicating higher numbers and blue indicating lower numbers. D, E, Number of affective–motivational and reflexive responses per trial. A, B, D, and E are shown as means ± SEM.
Figure 7.
Figure 7.
Local anesthestic and A-fiber selective blockade abolishes light-evoked paw withdrawal. A, Intraplantar ropivacaine (0.5%, 20 μl) blocked light-evoked paw withdrawal in 8/9 mice (n = 9) in the ipsilateral (left) paw, but all mice (9/9) responsed to stimulation of the uninjected, contralateral paw. B, Light-evoked response frequency was strongly attenuated in the ipsilateral paw of Vglut1-ChR2 mice that received A-fiber blockade with QX-314/flagellin (60 mm/1 μg, 20 μl, intraplantar, ipl) but not vehicle control (PBS, 20 μl, ipl) (treatment: F(1,12) = 13.58, p = 0.0031, paw: F(1,54) = 8.00, p = 0.0066, treatment × paw: F(1,54) = 20.3, p < 0.0001). C, Number of light-evoked responses was also strongly attenuated by QX-314/flagellin (treatment: F(1,12) = 12.88, p = 0.0037, paw: F(1,54) = 1.05, p = 0.31, treatment × paw: F(1,54) = 9.97, p = 0.0026). For B and C, in both treatment groups, the contralateral uninjected paw was stimulated after ipsilateral stimulation to demonstrate the localized nature of A-fiber blockade and to confirm the responsiveness of each subject (n = 7/group, stimulation: 5 mW/mm2, 10 Hz). Statistical analysis: two-factor linear mixed effects (LME) model, Tukey's post hoc test. B and C are shown as means ± SEM. Post hoc test: **p < 0.01, ***p < 0.001.
Figure 8.
Figure 8.
Comparison of light-evoked withdrawal behaviors in Vglut1-ChR2 and Nav1.8-ChR2 mice. A, Response frequency of Vglut1-ChR2 is lower than that of Nav1.8-ChR2 at all intensities (genotype: F(1,59) = 51.99, p < 0.001. intensity: F(3,59) = 11.07, p < 0.001, genotype × intensity F(3,59) = 3.57, p = 0.02). B, Total number of responses is substantially lower in Vglut1-ChR2 compared with Nav1.8-ChR2 (genotype: F(1,59) = 2034.68, p < 0.001, intensity: F(3,59) = 169.50, p < 0.001, genotype × intensity: F(3,59) = 282.0273, p < 0.001). C, Behavioral signatures of Vglut1-ChR2 and Nav1.8-ChR2 differ markedly. Dot plot representation of individual scored behaviors at each intensity and frequency combination. The size of each dot represents the percentage of trials in which the behavior was observed, and the color represents the total number of a given behavior per trial, with red indicating higher numbers and blue indicating lower numbers. D, Affective–motivational behaviors increase with intensity in Nav1.8-ChR2 but are absent in Vglut1-ChR2 (genotype: F(1,59) = 176.01, p < 0.001, intensity: F(3,59) = 13.03, p < 0.001, genotype × intensity: F(3,59) = 31.75, p < 0.001). E, Number of reflexive responses is higher at all intensities in Nav1.8-ChR2 (genotype: F(1,59) = 964.03, p < 0.001, intensity: F(3,59) = 86.67, p < 0.001, genotype × intensity: F(3,59) = 127.67, p < 0.001). Statistical analysis: two-factor linear mixed effects (LME) model, Tukey's post hoc tests. Vglut1-Chr2, n = 14, and Nav1.8-ChR2, n = 6, for all panels. Post hoc tests: Vglut1-ChR2 versus Nav1.8-ChR2 at each intensity, **p < 0.01, ***p < 0.001. A, B, D, and E are shown as means ± SEM. The data presented here for Vglut1-ChR2 (2 Hz) are replotted from Figure 6.
Figure 9.
Figure 9.
RT-PEA in non-nociceptive and nociceptive ChR2-expressing mouse line. A, Schematic of RT-PEA assay. The assay is divided into three 10 min stages: prestimulation (Pre), stimulation (Stim), and poststimulation (Post). During the Pre period, mice are allowed to freely explore both sides of the chamber apparatus. During the Stim period, mice are stimulated with blue light in their preferred chamber and with yellow light in their nonpreferred chamber. During the Post period, mice freely moved between chambers without stimulation. B, C, Blue light stimulation causes strong aversion in nociceptive (Nav1.8-ChR2 and Npy2r-ChR2) but not non-nociceptive mice (Vglut1-ChR2 and Vglut1-EYFP). (Vglut1-ChR2, stage: F(2,26) = 2.44, p = 0.11, n = 14. Vglut1-EYFP, stage: F(2,12) = 0.17, p = 0.85, n = 7. Nav1.8-ChR2, stage: F(2,10) = 96.39, p < 0.0001, n = 6, Npy2r-ChR2, stage: F(2,12) = 33.27, p < 0.0001, n = 7). D, E, RT-PEA assay results represented as change from baseline (Pre) preference (%).(Vglut1-ChR2, stage: F(2,26) = 2.40, p = 0.11. Vglut1-EYFP, stage: F(2,12) = 0.25, p = 0.78. Nav1.8-ChR2, stage: F(2,10) = 144.8, p < 0.0001, Npy2r-ChR2, stage: F(2,12) = 38.39, p < 0.0001). F, Representative spatial heat maps for each mouse line. Yellow indicates more time spent in the area and blue indicates less time spent in the area. NP, Nonpreferred chamber; P, preferred chamber. Statistical analysis: one-factor linear mixed effects (LME) model for each line, with Tukey's post hoc test. Post hoc tests: **p < 0.01, ***p < 0.001, NS, not significant (p > 0.05). BE are shown as means ± SEM.
Figure 10.
Figure 10.
Optogenetic stimulation of SNI mice does not elicit pain-like behaviors or aversion. A, SNI causes decreased PWTs in the ipsilateral paw on POD7 but not in the contralateral paw (n = 7 mice/group); two-factor linear mixed effects (LME), Tukey's post hoc test: paw: F(1,18) = 8.27, p = 0.01, time point: F(1,18) = 11.92, p = 0.003, paw × time point: F(1,18) = 13.99, p = 0.002, post hoc: **p < 0.01). B, Total number of light-evoked responses is not significantly different between the ipsilateral and contralateral paws on POD7 (three-factor LME, paw: F(1,90) = 18.08, p = 0.0001, time point: F(1,90) = 7.16, p = 0.009, intensity: F(3,90) = 32.45, p < 0.0001, paw × time point: F(1,90) = 0.28, p = 0.60, paw × intensity: F(3,90) = 2.10, p = 0.11, time point × intensity: F(3,90) = 1.59, p = 0.20, paw × time point × intensity: F(3,90) = 1.43, p = 0.24). C, Number of reflexive responses is not different between ipsilateral and contralateral paws on POD7 (three-factor LME: paw: F(1,90) = 18.24, p < 0.0001, time point: F(1,90) = 7.32, p = 0.008, intensity: F(3,90) = 32.14, p < 0.0001, paw × time point: F(1,90) = 0.31, p = 0.58, paw × intensity: F(3,90) = 2.12, p = 0.10, time point × intensity: F(3,90) = 1.61, p = 0.19, paw × time point × intensity: F(3,90) = 1.50, p = 0.22). D, Number of affective–motivational responses is not different between ipsilateral and contralateral paws on POD7 (three-factor LME, paw: F(1,90) = 0.09, p = 0.77, time point: F(1,90) = 0.0, p = 1.00, intensity: F(3,90) = 5.71, p = 0.001, paw × time point: F(1,90) = 0.08, p = 0.77, paw × intensity: F(3,90) = 0.60, p = 0.61, time point × intensity: F(3,90) = 0.29, p = 0.83, paw × time point × intensity: F(3,90) = 0.26, p = 0.85). E, F, Ipsilateral stimulation on POD7 did not produce more aversion compared with contralateral stimulation in a modified RT-PEA assay. One-factor LME, stage: F(1,12) = 0.98, p = 0.40 (E) and F(2,12) = 1.06, p = 0.38 (F). All plots are shown as means ± SEM.

Similar articles

Cited by

References

    1. Abraira VE, Ginty DD (2013) The Sensory Neurons of Touch. Neuron 79:618–639. - PMC - PubMed
    1. Abdus-Saboor I, Fried NT, Lay M, Dong P, Burdge J, Lu M, Ma M, Dong X, Long D, Luo W (2018) High-speed imaging of paw withdrawal reflex to objectively Assess pain state in mice. bioRxiv. Advance online publication. Retrieved February 12, 2018. doi:10.1101/263400. - DOI
    1. Agarwal N, Offermanns S, Kuner R (2004) Conditional gene deletion in primary nociceptive neurons of trigeminal ganglia and dorsal root ganglia. genesis 38:122–129. 10.1002/gene.20010 - DOI - PubMed
    1. Alvarez FJ, Villalba RM, Zerda R, Schneider SP (2004) Vesicular glutamate transporters in the spinal cord, with special reference to sensory primary afferent synapses. J Comp Neurol 472:257–280. 10.1002/cne.20012 - DOI - PubMed
    1. Arcourt A, Gorham L, Dhandapani R, Prato V, Taberner FJ, Wende H, Gangadharan V, Birchmeier C, Heppenstall PA, Lechner SG (2017) Touch receptor-derived sensory information alleviates acute pain signaling and fine-tunes nociceptive reflex coordination. Neuron 93:179–193. 10.1016/j.neuron.2016.11.027 - DOI - PubMed

Publication types

Substances

LinkOut - more resources