. 2019 Jun 18;116(25):12452-12461.
doi: 10.1073/pnas.1818521116. Epub 2019 May 31.

Hypoxia-induced switch in SNAT2/SLC38A2 regulation generates endocrine resistance in breast cancer

Affiliations

Hypoxia-induced switch in SNAT2/SLC38A2 regulation generates endocrine resistance in breast cancer

Matteo Morotti et al. Proc Natl Acad Sci U S A. .

Abstract

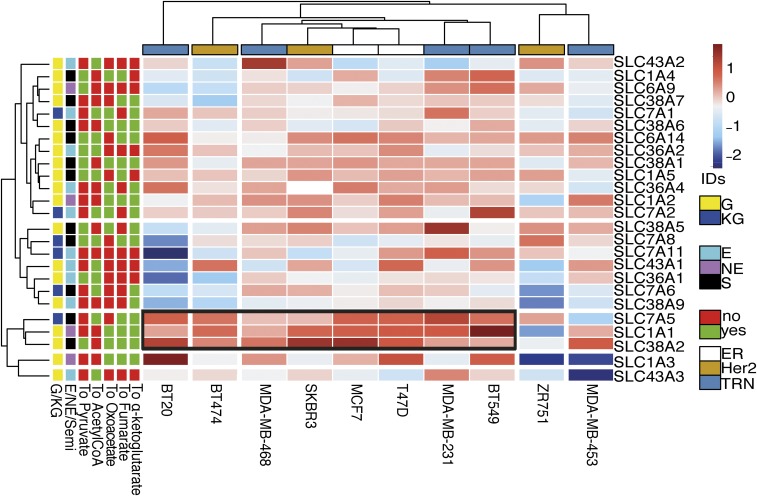
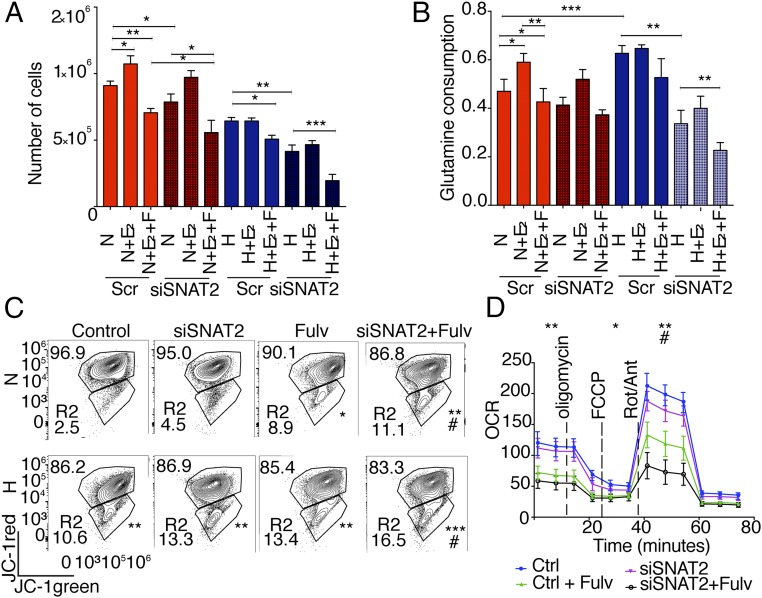
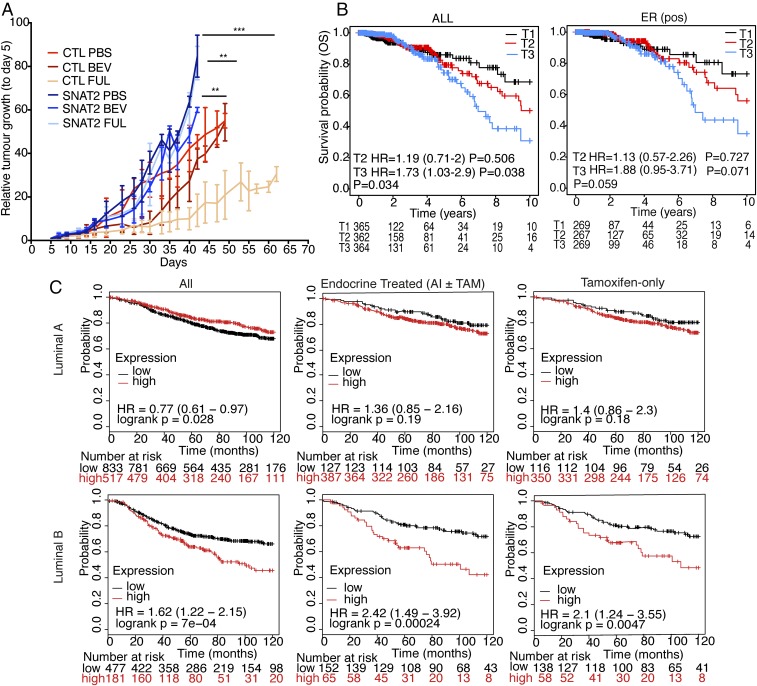
Tumor hypoxia is associated with poor patient outcomes in estrogen receptor-α-positive (ERα+) breast cancer. Hypoxia is known to affect tumor growth by reprogramming metabolism and regulating amino acid (AA) uptake. Here, we show that the glutamine transporter, SNAT2, is the AA transporter most frequently induced by hypoxia in breast cancer, and is regulated by hypoxia both in vitro and in vivo in xenografts. SNAT2 induction in MCF7 cells was also regulated by ERα, but it became predominantly a hypoxia-inducible factor 1α (HIF-1α)-dependent gene under hypoxia. Relevant to this, binding sites for both HIF-1α and ERα overlap in SNAT2's cis-regulatory elements. In addition, the down-regulation of SNAT2 by the ER antagonist fulvestrant was reverted in hypoxia. Overexpression of SNAT2 in vitro to recapitulate the levels induced by hypoxia caused enhanced growth, particularly after ERα inhibition, in hypoxia, or when glutamine levels were low. SNAT2 up-regulation in vivo caused complete resistance to antiestrogen and, partially, anti-VEGF therapies. Finally, high SNAT2 expression levels correlated with hypoxia profiles and worse outcome in patients given antiestrogen therapies. Our findings show a switch in the regulation of SNAT2 between ERα and HIF-1α, leading to endocrine resistance in hypoxia. Development of drugs targeting SNAT2 may be of value for a subset of hormone-resistant breast cancer.

Keywords: ERα; amino acid transporter; breast cancer; cancer metabolism; hypoxia.


Conflict of interest statement

The authors declare no conflict of interest.

Figures

Fig. 1.
Fig. 1.
SLC38A2 (SNAT2), SLC7A5, and SLC1A1 are the hypoxic-induced AA transporters in breast cancer cell lines. Ten breast cancer cell lines (columns) cultured in normoxia and hypoxia and submitted to RNA-seq were arranged by supervised average-linkage hierarchical clustering. Heatmap colors represent relative mRNA expression of the selected AA transporters (rows), with higher (red) or lower (blue) expression in hypoxia compared with normoxia. AA transporters that mediate the uptake of gluconeogenic (G) or ketogenic (KG) essential (E) or nonessential (NE) AAs that enter specific steps of the TCA cycle (α-ketoglutarate, fumarate, oxaloacetate, and pyruvate) were clustered. The black box represents the cluster composed of three AA transporters (SLC1A1, SLC7A5, and SLC38A2) in eight cell lines. S, semiessential; TRN, triple receptor-negative.
Fig. 2.
Fig. 2.
SNAT2 is a hypoxia-induced gene and is mainly regulated by HIF-1α. (A) Immunoblot of four breast cancer cell lines from different histotypes showing the heterogeneity in basal SNAT2 expression and their response to 48 h of hypoxia. (B) N-linked deglycosylation assay using PNGase in MCF7 cell lysate in normoxia and hypoxia. (C) MCF7 parental and MCF7-HIF1α knockout cells (−/−) were cultured in normoxia (red) or in hypoxia (blue, 0.1% O2) for 8, 24, and 48 h. mRNAs were analyzed by RT-qPCR and normalized to 21% O2. SNAT2 mRNA was normalized to the mean of β-actin and RPL11. Ctrl, control; KO, knockout. (D) Immunoblot validation in the same experiment described above. β-Actin is shown as a loading control. (E) MCF7 parental and MCF7-HIF1α (−/−) cells were transfected with scrambled control or siRNAs against HIF-2α (siHIF2α) or treated with PT2779 (HIF-2α inhibitor, 1 μM) and cultured in normoxia (red) or in hypoxia (blue, 0.1% O2) for 48 h. mRNAs were analyzed by RT-qPCR. SNAT2 mRNA was normalized to the mean of β-actin and RPL11. (F) Immunoblot of SNAT2, HIF-1α, and HIF-2α in the same experiment described above (E). β-Actin is shown as a loading control. Error bars indicate SD. *P < 0.05 vs. 21% O2, **P < 0.01 vs. 21% O2, ****P < 0.0001 vs. 21% O2; one-way ANOVA (n = 3 for all experiments).
Fig. 3.
Fig. 3.
SNAT2 is up-regulated in vivo by hypoxia. (A) Representative SNAT2 immunostaining in MDA-MB-231 (first row) and MCF7 (second row) xenografts treated with phosphate-buffered saline (PBS; n = 5) or bevacizumab (Beva; n = 5). (Scale bars: 100 μm.) SNAT2 protein expression quantification by ImageJ in the same xenografts is shown. N, necrosis. (B) Representative SNAT2 and CA9 (hypoxia) immunostaining in MDA-MB-231 and MCF7 xenografts treated with bevacizumab, showing colocalization of SNAT2 in hypoxic areas of the tumors. (Scale bars: 100 μm). (C) Xenograft growth curves of MCF7 parental (n = 6) and MCF7-HIF1α KO cells (n = 7). CRTL, control. (D) Representative immunohistochemical images of SNAT2 staining in MCF7 parental and MCF7-HIF1α-o xenografts and a bar chart of scoring. (Scale bars: 100 μm.) Error bars indicate SD. *P < 0.05, ***P < 0.01; nonparametric Mann–Whitney test (n = 5 per group).
Fig. 4.
Fig. 4.
SNAT2 expression is independently modulated by ERα and HIF-1α, and is up-regulated in a tamoxifen-resistant cell line. (A) RNA-seq and ChIP-seq genome-browser tracks illustrating occupancy of HIF-1α (Top), HIF-2α (Middle), and ERα (Bottom) at the same genomic coordinates on chromosome 12. The same plots for H3K4me3 are shown. Peaks (red box) represent the areas where transcription factors interact with DNA. (B) Western blotting for SNAT2, ERα, HIF-1α, and HIF-2 in MCF-7 and T47D cells treated with 10 nM E2 in normoxia and hypoxia (0.1% O2) for 48 h. β-Actin is shown as a loading control. (C) Confocal microscopy of SNAT2 (green), phalloidin (F-actin, red), and DAPI (blue) in MCF7 in normoxia (N) and hypoxia (H; 0.1% O2) with or without E2 treatment (E; 10 nM) for 24 h. (D) MCF7 cells were grown in a charcoal-stripped, phenol-free medium for 3 d and then incubated with or without fulvestrant (Fulv; 10 μM) and with or without 10 nM E2 in normoxia and hypoxia (0.1% O2) for 48 h. β-Actin is shown as a loading control. (E) MCF7 control and MCF7-HIF1α-o cells were treated with or without 10 nM E2 in normoxia and hypoxia (0.1% O2) for 48 h. β-Actin is shown as a loading control. (F) Representative Western blots of parental (MCF7-par) and MCF7 tamoxifen-resistant cells (MCF7-TamR) cultured in normoxia and hypoxia (0.1% O2) for 48 h. (G) Graph of the effect of MeIAB (10 mM) treatment on MCF7 and MCF7-TamR spheroid growth. Error bars indicate SD. **P < 0.05, ***P < 0.01; two-way ANOVA (n = 4).
Fig. 5.
Fig. 5.
SNAT2 knockdown sensitizes MCF7 cells to fulvestrant treatment in hypoxia and reduces glutamine intake. (A) Total of 105 cells were seeded in charcoal-stripped medium and treated with or without E2 (10 nM), fulvestrant (10 μM), and SNAT2 knockdown for 5 d in normoxia (N; red) and hypoxia (H; blue, 1% O2) (n = 4). Scr, scrambled control. (B) Glutamine consumption was calculated as reported from cells grown in the experiment above. (C) Determination of mitochondrial membrane potential in MCF7 cells by JC-1 staining in normoxia and hypoxia (0.1% O2, 48 h) with or without SNAT2 knockdown and with or without fulvestrant (Fulv; 10 μM). Values in the trapeziform regions indicate the proportion of cells compared with the total number of cells. The percentage of depolarized green mitochondria is shown in the R2 box. (AC) *P < 0.05, **P < 0.01, ***P < 0.001, #P < 0.05 (compared with Fulv treatment) by χ2 test compared with controls (n = 3). (D) Representative plot of O2 consumption with or without SNAT2 knockdown with or without Fulv (10 μM) in normoxia (21% O2). *P < 0.05, **P < 0.01, #P < 0.05 (compared with Fulv treatment); unpaired t test (n = 3). Ant, antimycin A; Ctrl, control; FCCP, carbonyl cyanide-4-(trifluoromethoxy)phenylhydrazone; OCR, oxygen consumption rate; Rot, rotenone.
Fig. 6.
Fig. 6.
SNAT2 expression is related to poor outcomes in endocrine-treated breast cancer patients. (A) Xenograft growth curves of MCF7 parental and SNAT2-o clones ± bevacizumab (BEV) or ± fulvestrant (FULV) treatment. CTL, control. ***P < 0.001, **P < 0.01, *P < 0.05; linear regression followed by Student’s t test (n = 5). (B) Kaplan–Meier plot for patients from the TGCA breast cancer invasive cohort (ALL and ER+ cohorts) stratified according to the expression of SNAT2 mRNA expression (T1, lower tertile; T2, middle tertile; T3, upper tertile). Overall survival (OS) was evaluated. The graph shows that high tumor SNAT2 levels are associated with increased patient mortality. Subanalysis based on tertile expression showed that the higher SNAT2 mRNA expression (upper tertile) cohort has a lower survival compared with the lower tertile cohort (T3 vs. T1). HR, hazard ratio. (C) Kaplan–Meier plots for luminal A and B ER+ breast cancer patients (Left) and for same subgroups that received endocrine [aromatase inhibitor (AI) or tamoxifen (TAM), Center] or tamoxifen only (Right). Patients were stratified according to the expression of SNAT2 mRNA [above (red) versus below (black) third quartile]. Recurrence-free survival was evaluated.

References

    1. Siegel R. L., Miller K. D., Jemal A., Cancer statistics, 2017. CA Cancer J. Clin. 67, 7–30 (2017). - PubMed
    1. Harbeck N., Gnant M., Breast cancer. Lancet 389, 1134–1150 (2017). - PubMed
    1. Tryfonidis K., Zardavas D., Katzenellenbogen B. S., Piccart M., Endocrine treatment in breast cancer: Cure, resistance and beyond. Cancer Treat Rev. 50, 68–81 (2016). - PubMed
    1. Musgrove E. A., Sutherland R. L., Biological determinants of endocrine resistance in breast cancer. Nat. Rev. Cancer 9, 631–643 (2009). - PubMed
    1. Osborne C. K., Schiff R., Mechanisms of endocrine resistance in breast cancer. Annu. Rev. Med. 62, 233–247 (2011). - PMC - PubMed

Publication types

Substances