. 2019 Jun 18;116(25):12410-12415.
doi: 10.1073/pnas.1905675116. Epub 2019 May 31.

TOX and TOX2 transcription factors cooperate with NR4A transcription factors to impose CD8+ T cell exhaustion

Affiliations

TOX and TOX2 transcription factors cooperate with NR4A transcription factors to impose CD8+ T cell exhaustion

Hyungseok Seo et al. Proc Natl Acad Sci U S A. .

Erratum in

Abstract

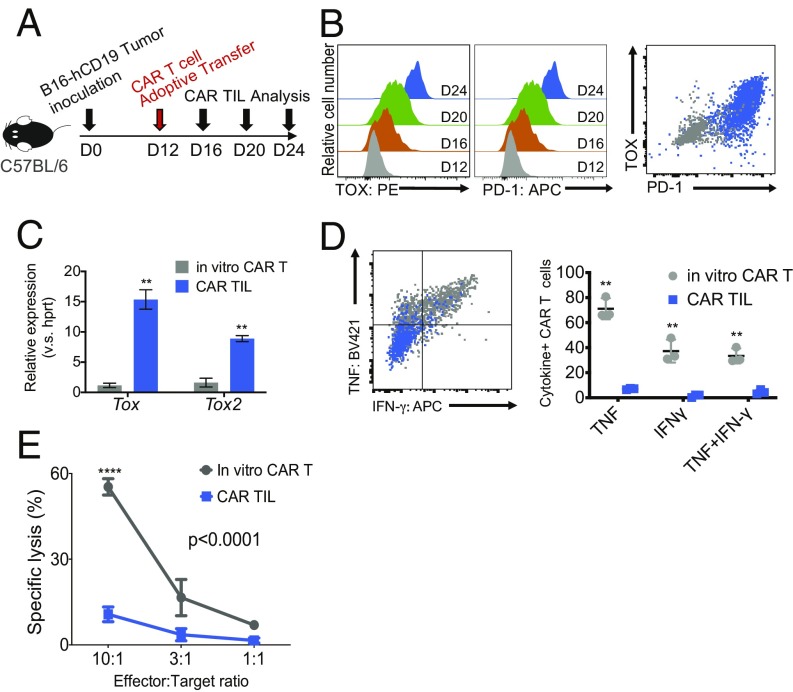
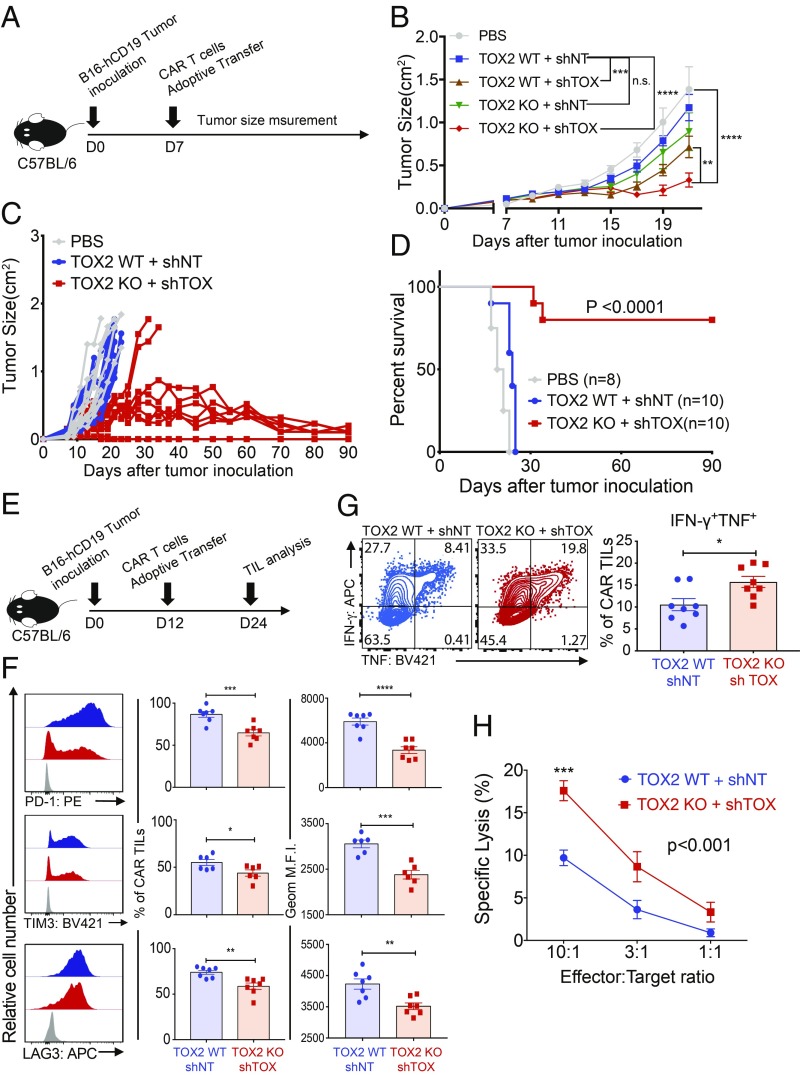
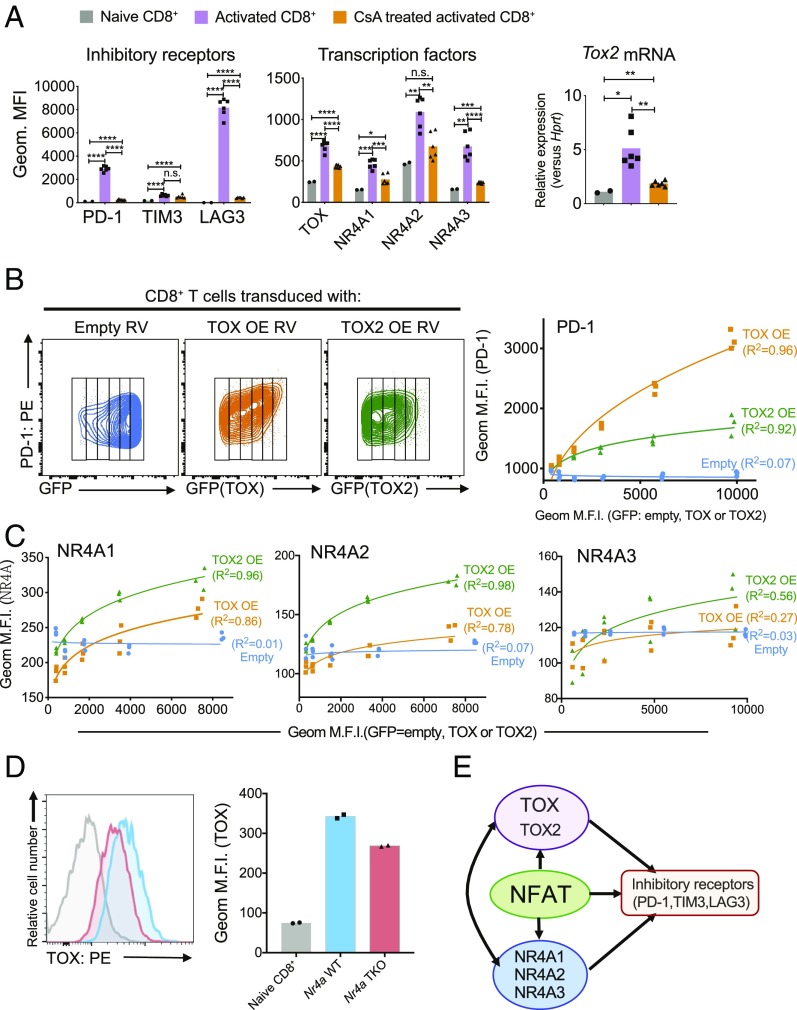
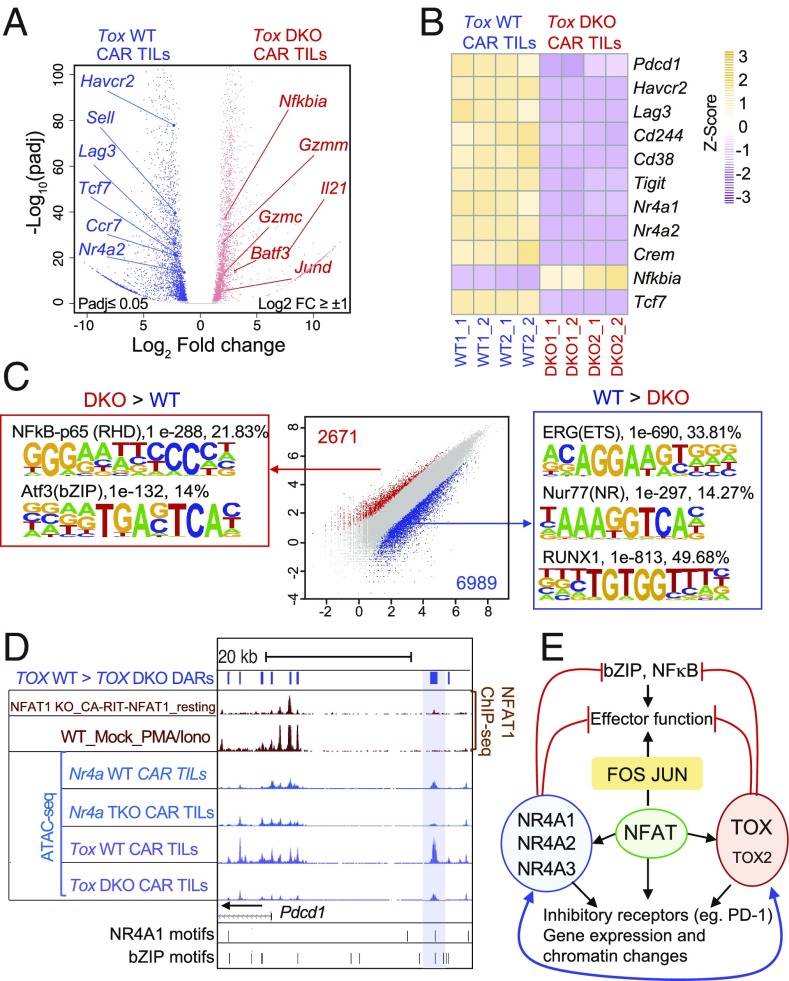
T cells expressing chimeric antigen receptors (CAR T cells) have shown impressive therapeutic efficacy against leukemias and lymphomas. However, they have not been as effective against solid tumors because they become hyporesponsive ("exhausted" or "dysfunctional") within the tumor microenvironment, with decreased cytokine production and increased expression of several inhibitory surface receptors. Here we define a transcriptional network that mediates CD8+ T cell exhaustion. We show that the high-mobility group (HMG)-box transcription factors TOX and TOX2, as well as members of the NR4A family of nuclear receptors, are targets of the calcium/calcineurin-regulated transcription factor NFAT, even in the absence of its partner AP-1 (FOS-JUN). Using a previously established CAR T cell model, we show that TOX and TOX2 are highly induced in CD8+ CAR+ PD-1high TIM3high ("exhausted") tumor-infiltrating lymphocytes (CAR TILs), and CAR TILs deficient in both TOX and TOX2 (Tox DKO) are more effective than wild-type (WT), TOX-deficient, or TOX2-deficient CAR TILs in suppressing tumor growth and prolonging survival of tumor-bearing mice. Like NR4A-deficient CAR TILs, Tox DKO CAR TILs show increased cytokine expression, decreased expression of inhibitory receptors, and increased accessibility of regions enriched for motifs that bind activation-associated nuclear factor κB (NFκB) and basic region-leucine zipper (bZIP) transcription factors. These data indicate that Tox and Nr4a transcription factors are critical for the transcriptional program of CD8+ T cell exhaustion downstream of NFAT. We provide evidence for positive regulation of NR4A by TOX and of TOX by NR4A, and suggest that disruption of TOX and NR4A expression or activity could be promising strategies for cancer immunotherapy.

Keywords: CD8+ T cell hyporesponsiveness; NFAT; NR4A; TOX; TOX2.


Conflict of interest statement

Conflict of interest statement: The La Jolla Institute of Immunology has a pending patent, PCT/US2018/062354, covering the use and production of engineered immune cells to disrupt NFAT-AP1 pathway transcription factors, including TOX and NR4A family members, with H.S., J.C., and A.R. listed as inventors.

Figures

Fig. 1.
Fig. 1.
TOX transcription factors are highly expressed in exhausted CAR TILs in solid tumors. (A) Experimental scheme for analyzing tumor-infiltrating CAR T cells (CAR TILs); 5 × 10⁵ B16-hCD19 tumor cells were inoculated subcutaneously into C57BL/6 mice. Twelve days later, 1.5 × 10⁶ CAR T cells were adoptively transferred into the tumor-bearing mice by intravenous injection. CAR TILs were isolated every 4 d after CAR T cell transfer. (BE) Gray color (dots, histograms, and shading) indicates T cells retrovirally transduced with the CAR and analyzed in vitro, and the orange, green, and blue colors indicate CAR TILs analyzed the indicated number of days after CAR T cell transfer. (B, Left and Center) Expression of TOX and PD-1 was analyzed by flow cytometry (PE: phycoerythrin, APC: allophycocyanin). Shown are histograms for TOX and PD-1 expression of CAR TILs on days 12, 16, 20, and 24 after tumor inoculation; “in vitro CAR T” refers to CAR T cells before adoptive transfer. (B, Right) Combined flow cytometry plot showing PD-1 and TOX expression on in vitro-transduced CAR T cells (gray) as well as CAR TILs isolated on day 24 (blue). (C) mRNA expression levels of Tox and Tox2 (relative to Hprt) in bulk CAR TILs on day 24. (D, Left) Representative flow cytometry plot showing TNF and IFN-γ expression after EL4-hCD19 cells restimulation in in vitro-transduced CAR T cells (gray) and CAR TILs isolated on day 24 (blue). (D, Right) Quantification of cytokine production (three mice per group). The data from C and D were analyzed by Student’s t test. **P ≤ 0.01. (E) In vitro-transduced CAR T cells and CAR TILs were cocultured with tumor cells expressing MC38-hCD19, and target cell lysis was measured 5 h later. The data are representative of two biologically independent experiments. The data from the two groups in E were analyzed by two-way ANOVA with a Bonferroni multiple comparisons test. ****P ≤ 0.0001.
Fig. 2.
Fig. 2.
CAR TILs with combined deficiency of TOX and TOX2 (Tox DKO CAR TILs) promote tumor regression and prolong survival of tumor-bearing mice. (A) Experimental scheme for monitoring tumor growth and survival; 5 × 10⁵ B16-hCD19 tumor cells were inoculated, and 3 × 10⁶ CAR T cells were adoptively transferred 7 d later. Tumor sizes were measured by calipers every 2 d. (B) CAR T cells deficient in both TOX and TOX2 were the most efficient at controlling tumor growth. (C) Time course of tumor growth in individual mice adoptively transferred with WT or Tox DKO CAR T cells. (D) Kaplan–Meier curves showing survival of each group of mice over time. The data from D were analyzed using a log rank Mantel–Cox test. (E) Experimental scheme for phenotypic analysis; 5 × 10⁵ tumor cells were inoculated into C57BL/6 mice, the mice were adoptively transferred with the indicated CAR T cells (1.5 × 10⁶) 12 d later, and CAR TILs were isolated on day 24. (F) Expression of the inhibitory receptors PD-1, TIM3, and LAG3 was analyzed by flow cytometry. Gray histograms show staining with isotype control antibody. (G) CAR TILs were restimulated with phorbol 12-myristate 13-acetate (PMA)/ionomycin, and expression of TNF and IFN-γ was analyzed by intracellular staining and flow cytometry. The data from F and G were analyzed by Student’s t test. (H) To measure the cytolytic activity of CAR TILs in vitro, the indicated CAR TILs were pooled from 10 Rag1−/− mice bearing B16-hCD19 tumors 12 d after adoptive transfer. Cytolytic activity was assessed by coculture with MC38-hCD19 tumor cells as targets. In all bar graphs, each dot represents CAR TILs from a single recipient mouse. The data from B and H were analyzed by two-way ANOVA with a Bonferroni multiple comparisons test. The data are obtained from two independent biological experiments. *P ≤ 0.05; **P ≤ 0.01; ***P ≤ 0.001; ****P ≤ 0.0001; n.s. = not significant.
Fig. 3.
Fig. 3.
NFAT, TOX, and NR4A transcription factors cooperate to control the expression of inhibitory receptors on CD8+ T cells and positive regulatory loops connecting TOX and NR4A. (A) Splenic CD8+ T cells from C57BL/6 mice were incubated with or without CsA for 30 min and then stimulated with anti-CD3 and anti-CD28 for 60 h. The expression of (Left) inhibitory receptors PD-1, TIM3, and LAG3 and (Center) transcription factors TOX, NR4A1, NR4A2, and NR4A3 was analyzed by flow cytometry. (Right) The expression of Tox2 mRNA was measured by qPCR and normalized to the level of Hprt mRNA expression. Naïve CD8+ cell from splenic CD8+ cells are used as a control. The data were obtained from two biological experiments. (B and C) The indicated retroviruses (RVs), either empty or encoding TOX or TOX2 [TOX overexpression (TOX OE) and TOX2 overexpression (TOX2 OE)], were used to transduce splenic CD8+ T cells from C57BL/6 mice, after which PD-1 (B) as well as NR4A1, NR4A2, and NR4A3 (C) expression levels were analyzed by flow cytometry as a function of TOX or TOX2 expression estimated as GFP expression from an IRES-GFP cassette (B, Left). Geometric MFIs of PD-1 (B, Right) and NR4A1, NR4A2, and NR4A3 (C) were plotted in the graphs for each increment of GFP (i.e., TOX or TOX2) expression. Blue, empty RV; orange, TOX OE RV; green, TOX2 OE RV. Transduction with empty retrovirus does not change the levels of PD-1 or NR4A expression, whereas transduction with TOX or TOX2 retrovirus leads to a significant increase. The data are representative of two biologically independent experiments. (D) TOX expression was analyzed by flow cytometry in Nr4a WT (blue) or Nr4a TKO (red) CD8+ T cells. Naïve CD8+ T cells were used as a control. (E) Schematic illustrating the proposed roles of NFAT, NR4A, and TOX/TOX2 transcription factors in CD8+ T cells. Each dot is representative of CD8+ T cells from individual mice. The data are representative of two biologically independent experiments. *P ≤ 0.05; **P ≤ 0.01; ***P ≤ 0.001; ****P ≤ 0.0001; n.s. = not significant. PE = phycoerythrin.
Fig. 4.
Fig. 4.
Gene expression and chromatin accessibility profiles of Tox DKO CAR TILs compared with WT CAR TILs. (A) Volcano plots of genes differentially expressed in WT compared with Tox DKO CAR TILs. Selected differentially expressed genes with an adjusted P value ≤ 0.05 and log2 fold change >1 or −1 are indicated. (B) Heat maps (transcripts per kilobase million normalization with z score) showing expression of representative genes in WT vs. Tox DKO CAR TILs in individual replicates. (C) Scatterplot of pairwise comparisons of ATAC-seq density (Tn5 insertions per kilobase) in WT vs. Tox DKO CAR TILs. Differentially accessible regions and associated de novo motif analysis are shown. (D) Genome browser view of the Pdcd1 locus incorporating ChIP-seq (NFAT1, KO_CA-RIT-NFAT1_resting and WT_Mock_PMA_Iono; GSE64409) and ATAC-seq (Nr4a WT, Nr4a TKO CAR TILs; GSE123739 and Tox WT, Tox DKO CAR TILs) samples. The blue bar shows the “exhaustion-specific” enhancer located ∼23 kb 5′ of the Pdcd1 transcription start site. DARs = differentially accessible regions; PMA/Iono = phorbol 12-myristate 13-acetate/ionomycin. (E) Diagram illustrating the proposed involvement of NFAT, NR4A, and TOX proteins in the transcriptional program of CD8+ T cell exhaustion. The RNA-seq and ATAC-seq samples were obtained from two independent biological experiments.

References

    1. Sharma P., Allison J. P., Immune checkpoint targeting in cancer therapy: Toward combination strategies with curative potential. Cell 161, 205–214 (2015). - PMC - PubMed
    1. Topalian S. L., Drake C. G., Pardoll D. M., Immune checkpoint blockade: A common denominator approach to cancer therapy. Cancer Cell 27, 450–461 (2015). - PMC - PubMed
    1. Maude S. L., et al. , Chimeric antigen receptor T cells for sustained remissions in leukemia. N. Engl. J. Med. 371, 1507–1517 (2014). - PMC - PubMed
    1. Davila M. L., et al. , Efficacy and toxicity management of 19-28z CAR T cell therapy in B cell acute lymphoblastic leukemia. Sci. Transl. Med. 6, 224ra25 (2014). - PMC - PubMed
    1. June C. H, O’Connor R. S., Kawalekar O. U., Ghassemi S., Milone M. C., CAR T cell immunotherapy for human cancer. Science 37, 457–495 (2018). - PubMed

Publication types