. 2019 Sep;112(3):766-784.
doi: 10.1111/mmi.14319. Epub 2019 Jun 11.

The ParB homologs, Spo0J and Noc, together prevent premature midcell Z ring assembly when the early stages of replication are blocked in Bacillus subtilis

Affiliations

The ParB homologs, Spo0J and Noc, together prevent premature midcell Z ring assembly when the early stages of replication are blocked in Bacillus subtilis

Isabella V Hajduk et al. Mol Microbiol. 2019 Sep.

Abstract

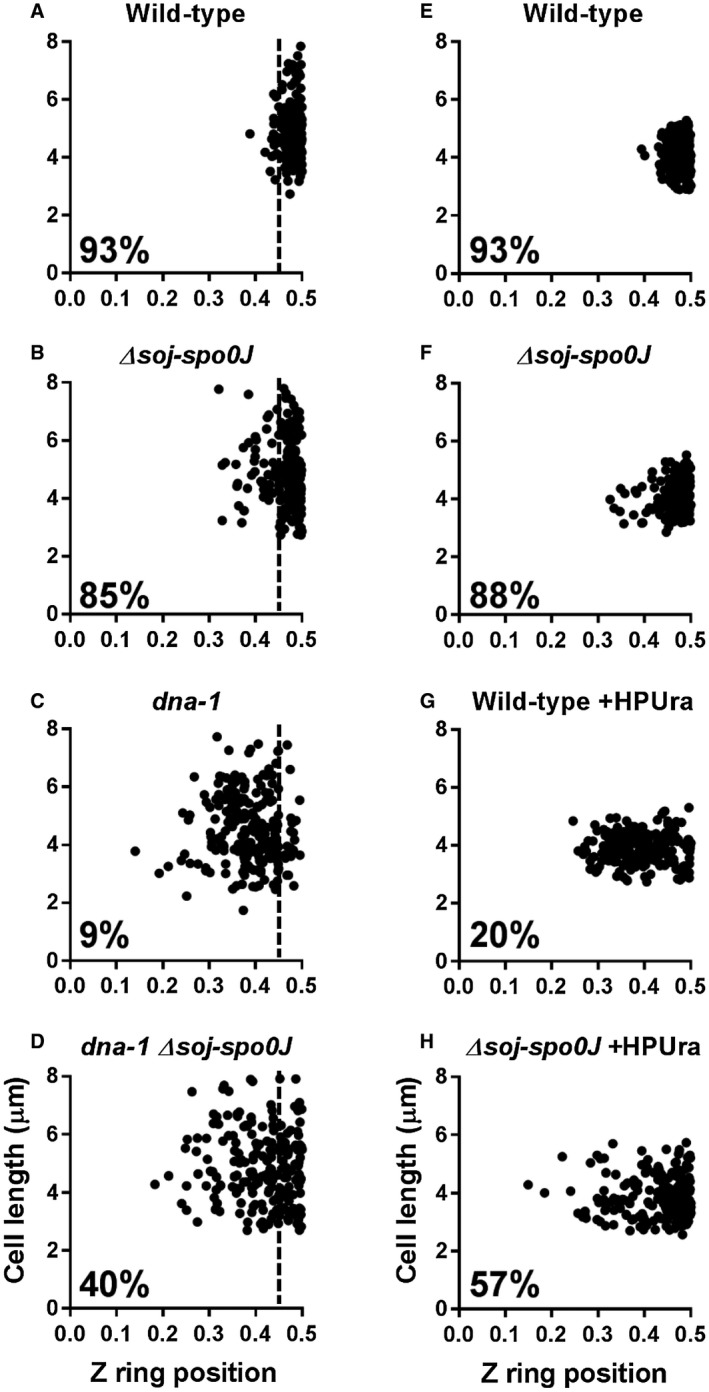
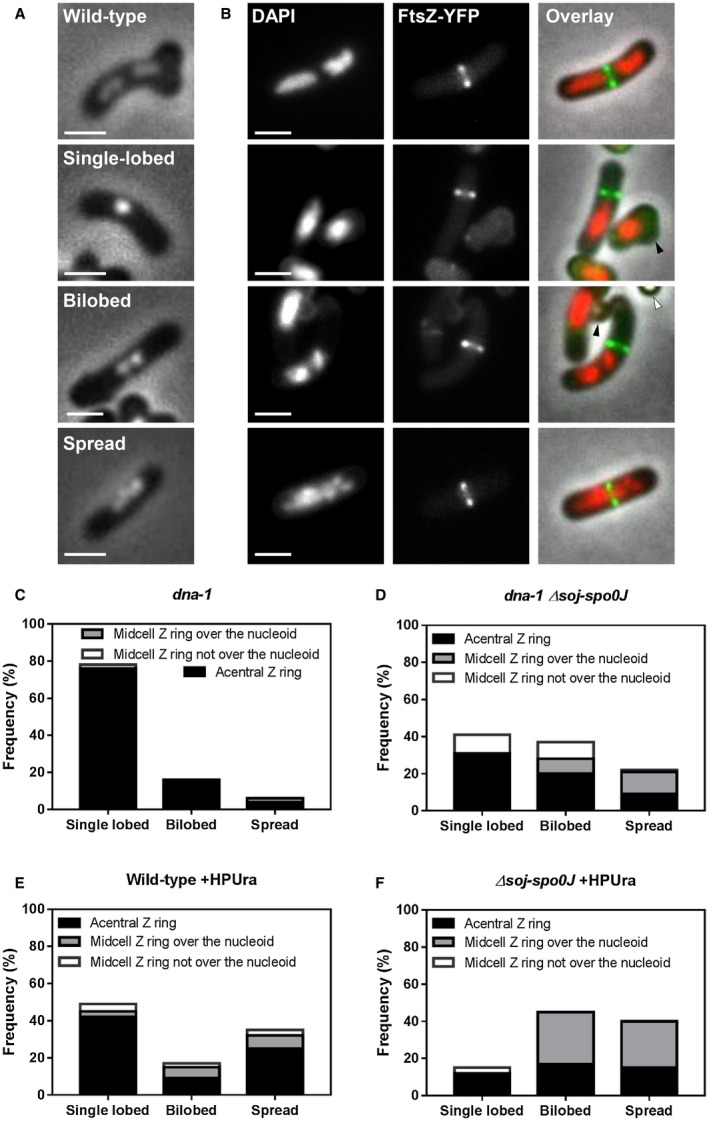
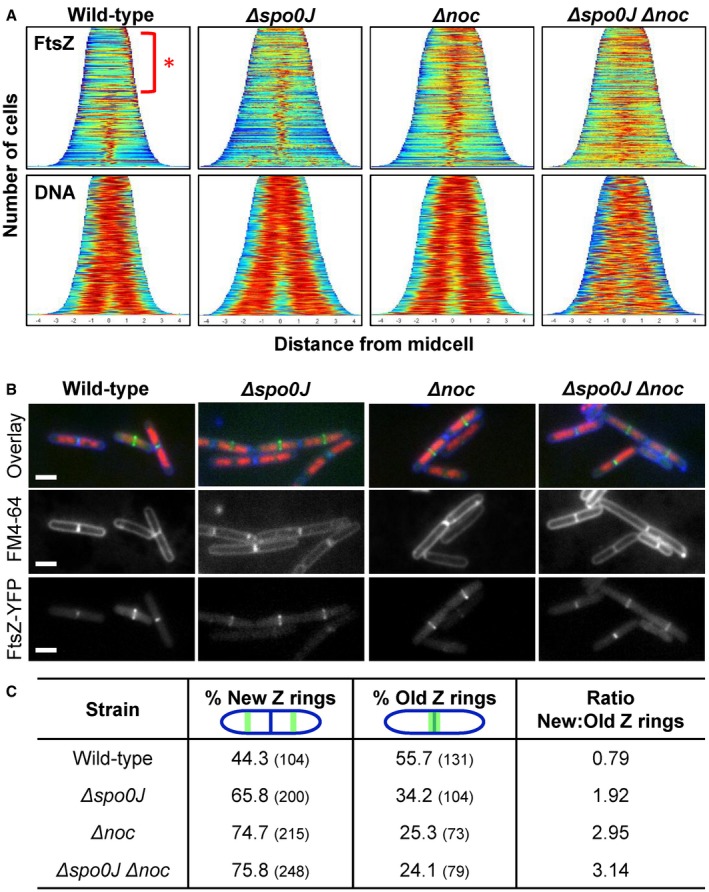
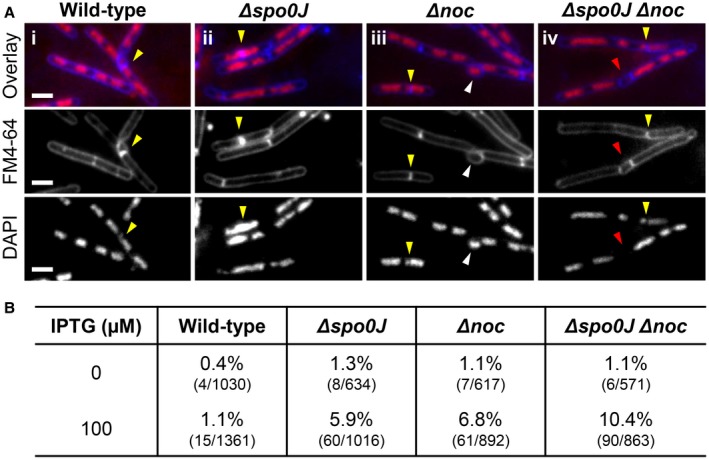
Precise cell division in coordination with DNA replication and segregation is of utmost importance for all organisms. The earliest stage of cell division is the assembly of a division protein FtsZ into a ring, known as the Z ring, at midcell. What still eludes us, however, is how bacteria precisely position the Z ring at midcell. Work in B. subtilis over the last two decades has identified a link between the early stages of DNA replication and cell division. A recent model proposed that the progression of the early stages of DNA replication leads to an increased ability for the Z ring to form at midcell. This model arose through studies examining Z ring position in mutants blocked at different steps of the early stages of DNA replication. Here, we show that this model is unlikely to be correct and the mutants previously studied generate nucleoids with different capacity for blocking midcell Z ring assembly. Importantly, our data suggest that two proteins of the widespread ParB family, Noc and Spo0J are required to prevent Z ring assembly over the bacterial nucleoid and help fine tune the assembly of the Z ring at midcell during the cell cycle.


Conflict of interest statement

The authors declare that they have no conflict of interest.

Figures

Figure 1
Figure 1
Z ring positioning when the early stages of DNA replication are blocked during spore outgrowth. Z ring positioning was examined in two conditions: in the temperature‐sensitive dna‐1 background (A–D) and with the addition of the DNA polymerase III inhibitor HPUra (E–H). A–D. Spores were germinated in GMD containing 0.02% xylose (v/v) for 20 min at the permissive temperature (34°C), then shifted to the non‐permissive temperature (48°C) for a further 90 min: (A) wild‐type; SU492, (B) dna‐1; SU746, (C) Δsoj‐spo0J; SU767and (D) dna‐1 Δsoj‐spo0J; SU768. E–H. Spores were germinated in GMD containing 0.02% xylose (v/v), in the absence or addition of HPUra (100 μM) at 34°C: (E) wild‐type; SU492, (F) Δsoj‐spo0J; SU767, (G) wild‐type +HPUra, (H) Δsoj‐spo0J HPUra). Percentages shown are the frequencies of Z rings occurring at midcell in the range of 0.45 – 0.5 on the x‐axis. The vertical dotted line on graphs A–D mark the 0.45 point on the x‐axis. Data point on the right‐hand side of this vertical dotted line are considered midcell. n > 200 for each strain.
Figure 2
Figure 2
Dual analysis of nucleoid morphologies and Z rings positions when the early stages of DNA replication are blocked in the absence of soj‐spo0J. A. Different nucleoid morphologies observed including a wild‐type cell with replication occurring normally, and when initiation of DNA replication is blocked: (top to bottom) wild‐type, single‐lobed, bilobed and spread nucleoid. B. Representative images of wild‐type cells (top image) and predominant combinations Z ring positions and nucleoid types quantified when the early stages of DNA are blocked: acentral Z ring adjacent to a single‐lobed nucleoid, central Z ring forming over a spread nucleoid, acentral Z ring adjacent to spread nucleoid and acentral Z ring forming over a spread nucleoid. Representative images above show in each column: DAPI (0.4 µg ml−1; left); FtsZ‐YFP (middle); and an overlay of the three preceding images (right). Images also show ungerminated spores (white arrows) and remnant spore coats (black arrows). Scale bar represents 2 μm. C–F. Histogram representation of Z ring position relative to different nucleoid type in (C) dna‐1; SU764, (D) dna‐1 Δsoj‐spo0J; SU768, (E) Wild‐type; SU492 +HPUra and (F) Δsoj‐spo0J; SU767 +HPUra. Spore samples were germinated and grown at either (C–D) the permissive temperature for 20 min and then shifted to the non‐permissive for a further 90 min; or (E–F) the permissive temperature for 120 min with media supplemented with HPUra (100 μM). The height of each bar represents the frequency of each nucleoid type, showing the proportion of acentral Z rings (black), midcell Z rings over the nucleoid (grey) and midcell Z rings not over the nucleoid (white). n > 200 for each strain.
Figure 3
Figure 3
Dual analysis of nucleoid morphologies and Z rings positions when the early stages of DNA replication are blocked in the absence of both soj‐spo0J and noc. A–D. Histogram representation of Z ring position relative to different nucleoid type in (A) dna‐1; SU764, (B) dna‐1 Δsoj‐spo0J Δnoc; SU836 (C) Wild‐type; SU492 +HPUra and (D) Δsoj‐spo0J Δnoc; SU835 +HPUra. E. Midcell Z ring frequencies in the two different replication blocks. n > 200 for each strain.
Figure 4
Figure 4
Left and right arm localisation when initiation of DNA replication is blocked via the temperature‐sensitive dna‐1 mutant. Distances between the +87° and −87° arm were examined in outgrown spores of dna‐1 (SU895) and dna‐1 Δsoj‐spo0J (SU897). Graphs show distance between the +87° and −87° foci in the three different nucleoid morphologies: (A) single‐lobed, (B) bilobed, and (C) spread. Asterisks indicate statistically significant (Kolmogorov‐Smirnov test) differences in focal distances between mutants at P < 0.05, as determined in from two replicate experiments. D. Representative images of +87° and −87° arm foci localisation including: (i) phase‐contrast and DAPI overlay, (ii) +87° and −87° foci overlay, and (iii) +87° and −87° foci overlaid with DAPI. Arrows highlight the positions of the +87° (cyan arrows) and −87° (yellow arrows) foci on each arm. Scale bar represents 2 μm. n > 100 for each strain.
Figure 5
Figure 5
Z ring positioning and nucleoid morphology analysis when SMC is degraded. A. Nucleoid morphologies and B. midcell Z ring frequencies when SMC is degraded in outgrown temperature‐sensitive dna‐1 mutant spores via the addition of xylose (1% v/v) 15 min prior to shifting the cells to the non‐permissive temperature. C. Immunoblot analysis of SMC and a loading control (FtsZ) in wild‐type (SU5) and the smc‐ssrA degradation strains (dna‐1; SU851, Δnoc; SU875, Δsoj‐Δspo0J; SU877, Δsoj‐Δspo0J Δnoc; SU879) under conditions in which the adaptor protein is either not induced (−) or induced (+). n > 200 for each strain.
Figure 6
Figure 6
Analysis of Z ring formation in replicating cells in the absence of both noc and spo0J. Cells were grown in media supplemented with 0.05% xylose to induce FtsZ‐YFP expression, FM4‐64 (3.3 µg ml−1) was added 30 min prior to sample collection and DAPI added at the time of collection (0.4 µg ml−1). A. Population demographs illustrating localisation of FtsZ (top) and DNA (bottom) in strains (i) wild‐type; SU492, (ii) Δspo0J; SU890, (iii) Δnoc; SU891, and (iv) Δspo0J Δnoc; SU892. n > 600 for each strain. B. Representative image and C. Frequencies of new and old Z rings observed in the aforementioned strains. Scale bars represent 2 μm. n > 200 for each strain.
Figure 7
Figure 7
Guillotining of the DNA by the division septum in the absence of both noc and spo0J. A. Representative examples of cells where the division septum guillotined the DNA (yellow arrows) and B. Frequencies of septum guillotining of the DNA when FtsZ is overexpressed in (i) wild‐type; SU504, (ii) Δspo0J; SU887, (iii) Δnoc; SU888, and (iv) Δspo0J Δnoc; SU889. Cells were grown to mid‐exponential phase, diluted down to 0.05 in duplicate and grown for a further hour with one set of duplicates supplemented with 100 µM IPTG. Representative images show in each row: DAPI (0.4 µg ml−1; bottom); FM4‐64 (3.3 µg ml−1; middle); and an overlay of the two (top). Images also show additional phenotypes including anucleate cells (red arrows) and bulging formations at the division site (white arrows). Scale bars represent 2 μm.

References

    1. Adams, D.W. , Wu, L.J. and Errington, J. (2015) Nucleoid occlusion protein Noc recruits DNA to the bacterial cell membrane. The EMBO Journal, 34, 491–501. - PMC - PubMed
    1. Autret, S. , Nair, R. and Errington, J. (2001) Genetic analysis of the chromosome segregation protein Spo0J of Bacillus subtilis: evidence for separate domains involved in DNA binding and interactions with Soj protein. Molecular Microbiology, 41, 743–755. - PubMed
    1. Bailey, M.W. , Bisicchia, P. , Warren, B.T. , Sherratt, D.J. and Mannik, J. (2014) Evidence for divisome localization mechanisms independent of the Min system and SlmA in Escherichia coli . PLoS Genetics, 10, e1004504. - PMC - PubMed
    1. Bazill, G.W. and Gross, J.D. (1972) Effect of 6‐(p‐hydroxyphenyl)‐azouracil on B. subtilis DNA polymerases. Nat New Biol, 240, 82–83. - PubMed
    1. Bernard, R. , Marquis, K.A. and Rudner, D.Z. (2010) Nucleoid occlusion prevents cell division during replication fork arrest in Bacillus subtilis . Molecular Microbiology, 78, 866–882. - PMC - PubMed

Publication types

Substances

LinkOut - more resources