

Binaural unmasking with temporal envelope and fine structure in listeners with cochlear implants
- PMID: 31153315
- PMCID: PMC6525004
- DOI: 10.1121/1.5102158
Binaural unmasking with temporal envelope and fine structure in listeners with cochlear implants
Abstract
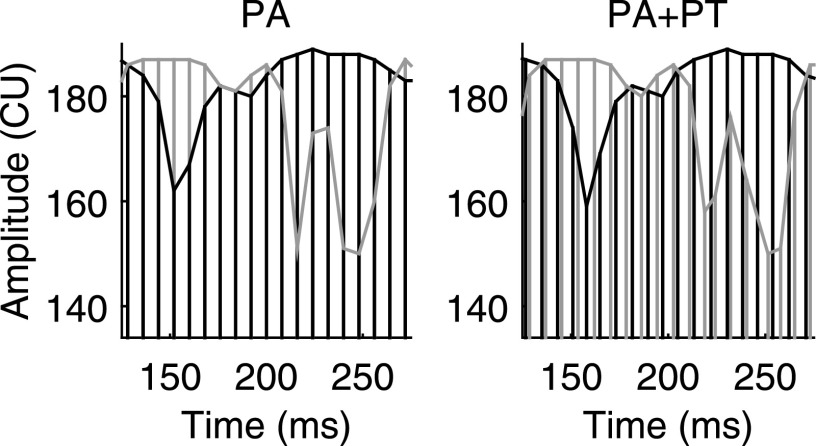
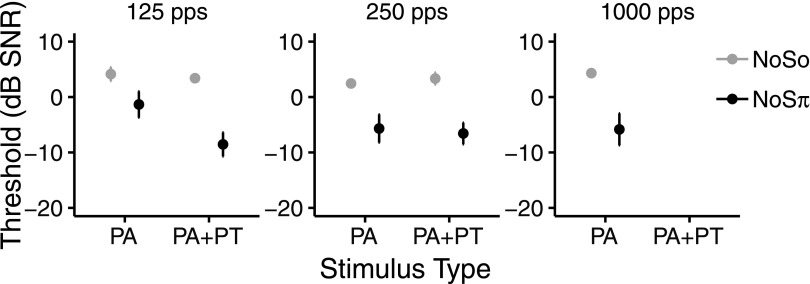
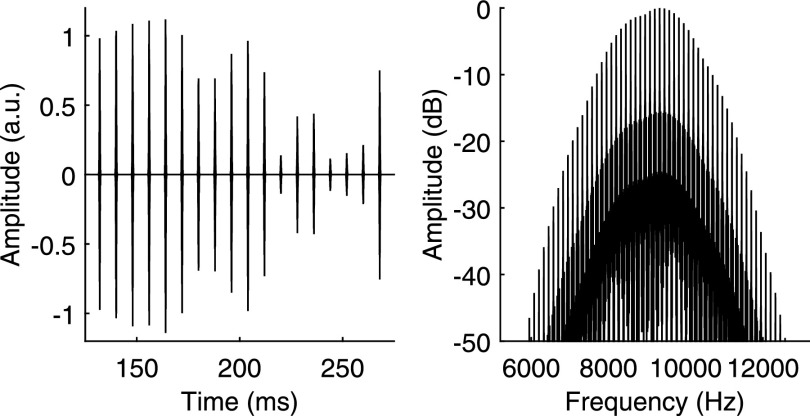
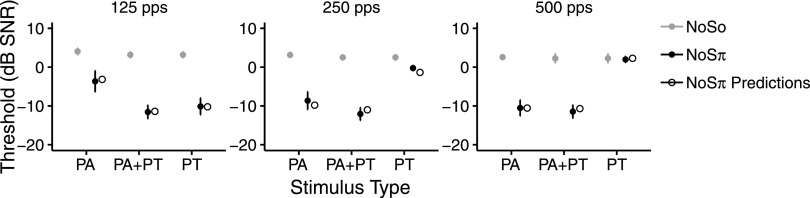
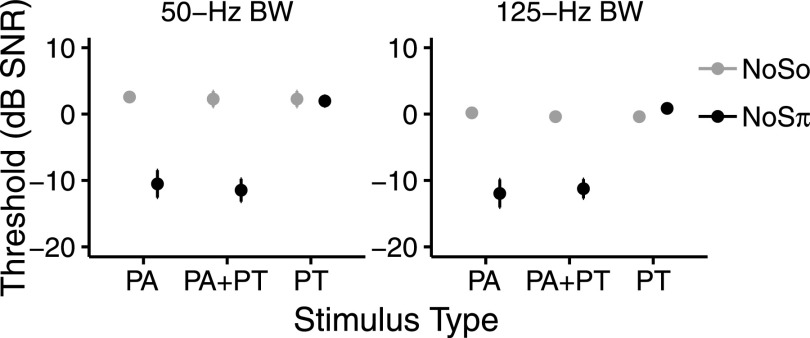
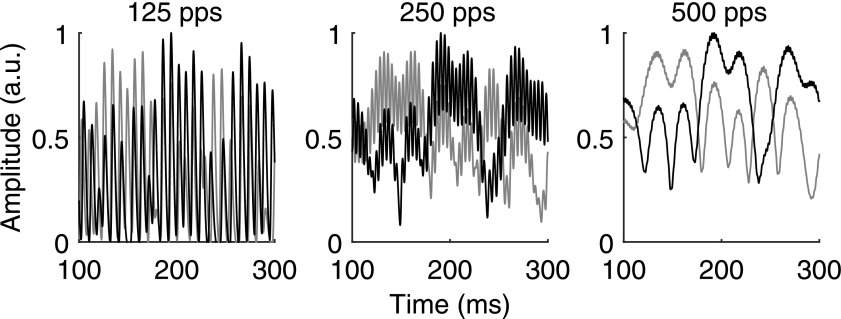
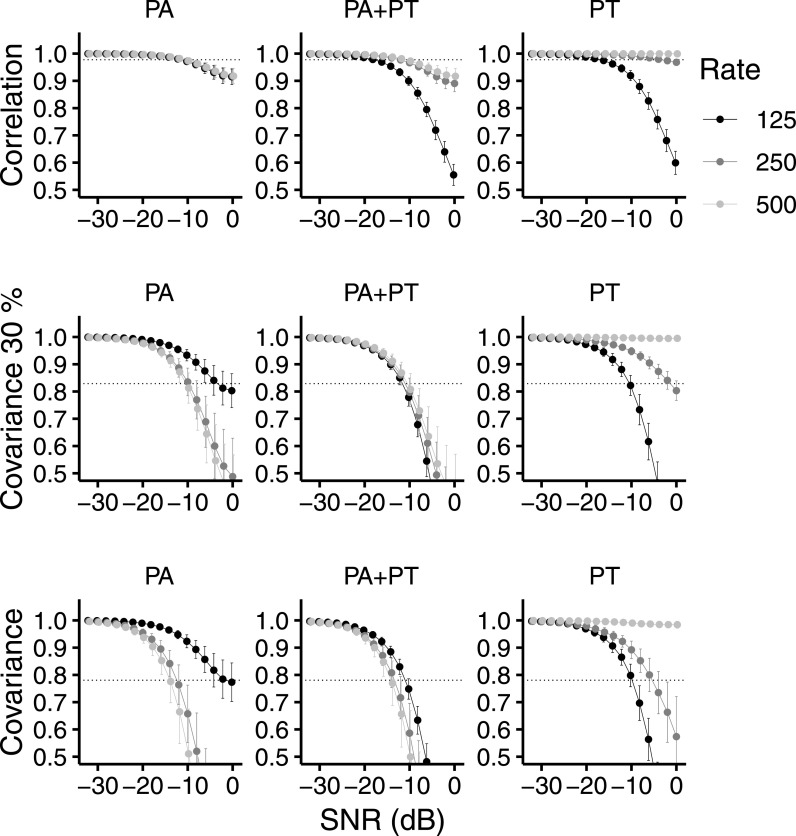
For normal-hearing (NH) listeners, interaural information in both temporal envelope and temporal fine structure contribute to binaural unmasking of target signals in background noise; however, in many conditions low-frequency interaural information in temporal fine structure produces greater binaural unmasking. For bilateral cochlear-implant (CI) listeners, interaural information in temporal envelope contributes to binaural unmasking; however, the effect of encoding temporal fine structure information in electrical pulse timing (PT) is not fully understood. In this study, diotic and dichotic signal detection thresholds were measured in CI listeners using bilaterally synchronized single-electrode stimulation for conditions in which the temporal envelope was presented without temporal fine structure encoded (constant-rate pulses) or with temporal fine structure encoded (pulses timed to peaks of the temporal fine structure). CI listeners showed greater binaural unmasking at 125 pps with temporal fine structure encoded than without. There was no significant effect of encoding temporal fine structure at 250 pps. A similar pattern of performance was shown by NH listeners presented with acoustic pulse trains designed to simulate CI stimulation. The results suggest a trade-off across low rates between interaural information obtained from temporal envelope and that obtained from temporal fine structure encoded in PT.
Figures

Similar articles
-
Pre- and Postoperative Binaural Unmasking for Bimodal Cochlear Implant Listeners.Ear Hear. 2017 Sep/Oct;38(5):554-567. doi: 10.1097/AUD.0000000000000420. Ear Hear. 2017. PMID: 28301390
-
Cortical Correlates of Binaural Temporal Processing Deficits in Older Adults.Ear Hear. 2018 May/Jun;39(3):594-604. doi: 10.1097/AUD.0000000000000518. Ear Hear. 2018. PMID: 29135686 Free PMC article.
-
Binaural cue sensitivity in cochlear implant recipients with acoustic hearing preservation.Hear Res. 2020 May;390:107929. doi: 10.1016/j.heares.2020.107929. Epub 2020 Feb 26. Hear Res. 2020. PMID: 32182551 Free PMC article.
-
Auditory Model-Based Sound Direction Estimation With Bilateral Cochlear Implants.Trends Hear. 2015 Dec 1;19:2331216515616378. doi: 10.1177/2331216515616378. Trends Hear. 2015. PMID: 26631106 Free PMC article. Review.
-
Perception and coding of interaural time differences with bilateral cochlear implants.Hear Res. 2015 Apr;322:138-50. doi: 10.1016/j.heares.2014.10.004. Epub 2014 Oct 19. Hear Res. 2015. PMID: 25456088 Review.
Cited by
-
Participation of Acoustic and Electric Hearing in Perceiving Musical Sounds.Front Neurosci. 2021 May 5;15:558421. doi: 10.3389/fnins.2021.558421. eCollection 2021. Front Neurosci. 2021. PMID: 34025335 Free PMC article.
-
Auditory Spatial Discrimination and Sound Localization in Single-Sided Deaf Participants Provided with a Cochlear Implant.Audiol Neurootol. 2024;29(3):193-206. doi: 10.1159/000534686. Epub 2023 Dec 1. Audiol Neurootol. 2024. PMID: 38043510 Free PMC article.
-
Stimulation Rate and Voice Pitch Perception in Cochlear Implants.J Assoc Res Otolaryngol. 2022 Oct;23(5):665-680. doi: 10.1007/s10162-022-00854-2. Epub 2022 Aug 2. J Assoc Res Otolaryngol. 2022. PMID: 35918501 Free PMC article.
-
Lateralization of binaural envelope cues measured with a mobile cochlear-implant research processora).J Acoust Soc Am. 2023 Jun 1;153(6):3543-3558. doi: 10.1121/10.0019879. J Acoust Soc Am. 2023. PMID: 37390320 Free PMC article.
-
Sound Localization in Single-Sided Deaf Participants Provided With a Cochlear Implant.Front Psychol. 2021 Oct 21;12:753339. doi: 10.3389/fpsyg.2021.753339. eCollection 2021. Front Psychol. 2021. PMID: 34744930 Free PMC article.
References
MeSH terms
Grants and funding
LinkOut - more resources
Full Text Sources
Medical