. 2019 May;145(5):2871.
doi: 10.1121/1.5100272.

Developing a large scale population screening tool for the assessment of Parkinson's disease using telephone-quality voice

Affiliations

Developing a large scale population screening tool for the assessment of Parkinson's disease using telephone-quality voice

Siddharth Arora et al. J Acoust Soc Am. 2019 May.

Abstract

Recent studies have demonstrated that analysis of laboratory-quality voice recordings can be used to accurately differentiate people diagnosed with Parkinson's disease (PD) from healthy controls (HCs). These findings could help facilitate the development of remote screening and monitoring tools for PD. In this study, 2759 telephone-quality voice recordings from 1483 PD and 15 321 recordings from 8300 HC participants were analyzed. To account for variations in phonetic backgrounds, data were acquired from seven countries. A statistical framework for analyzing voice was developed, whereby 307 dysphonia measures that quantify different properties of voice impairment, such as breathiness, roughness, monopitch, hoarse voice quality, and exaggerated vocal tremor, were computed. Feature selection algorithms were used to identify robust parsimonious feature subsets, which were used in combination with a random forests (RFs) classifier to accurately distinguish PD from HC. The best tenfold cross-validation performance was obtained using Gram-Schmidt orthogonalization and RF, leading to mean sensitivity of 64.90% (standard deviation, SD, 2.90%) and mean specificity of 67.96% (SD 2.90%). This large scale study is a step forward toward assessing the development of a reliable, cost-effective, and practical clinical decision support tool for screening the population at large for PD using telephone-quality voice.


Figures
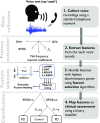
FIG. 1.
FIG. 1.
(Color online) Schematic diagram illustrating the procedure for collecting voice recordings (sustained vowel “aaah”), using a standard telephone network, along with the major steps involved in the statistical data analysis. Step 1 involves collecting voice samples from controls and participants with PD. The raw voice recordings are preprocessed in order to identify the participant prompts and discard non-usable recordings (unclear prompts or insufficient phonation length). Step 2 involves extracting features (or summary measures) that quantify key properties of voice such as: reduced loudness, breathiness, roughness, monopitch, and exaggerated vocal tremor, which are commonly associated with voice impairment in PD. Step 3 identifies the key features using four feature selection (FS) techniques. Step 4 involves mapping the key identified features onto a clinical assessment (PD/control). The out-of-sample classification accuracy is measured using a tenfold CV scheme on a balanced dataset. DFA, detrended fluctuation analysis; F0, fundamental frequency; PD, Parkinson's disease; RPDE, recurrence period density entropy.
FIG. 2.
FIG. 2.
Out-of-sample comparison of the FS algorithms obtained using all recordings (2759 recordings from 1483 PD participants and 15 321 recordings from 8300 control participants) based on learner performance (binary-class classification datasets) using random forests (RFs). The classification accuracy is computed on a balanced dataset using a tenfold CV scheme with ten repetitions. The classification accuracy is quantified using sensitivity (%) and specificity (%), whereby sensitivity = TP/(TP + FN) and specificity = TN/(TN + FP), where TP denotes true positive, TN denotes true negative, FP denotes false positive, and FN denotes false negative. The horizontal axis denotes the different number of features (10, 25, 50, 75, 100, 150, 200, 250, 307) selected across all 4 FS algorithms and the ensemble ranking scheme.
FIG. 3.
FIG. 3.
Out-of-sample comparison of the FS algorithms obtained using only female recordings (1199 recordings from 641 PD participants and 6922 recordings from 3719 control participants) based on learner performance (binary-class classification datasets) using RFs. The classification accuracy is computed on a balanced dataset using a tenfold CV scheme with ten repetitions. The classification accuracy is quantified using sensitivity (%) and specificity (%). The horizontal axis denotes the different number of features (10, 25, 50, 75, 100, 150, 200, 250, 307) selected across all 4 FS algorithms and the ensemble ranking scheme.
FIG. 4.
FIG. 4.
Out-of-sample comparison of the FS algorithms obtained using only male recordings (1560 recordings from 842 PD participants and 8399 recordings from 4581 control participants) based on learner performance (binary-class classification datasets) using RFs. The classification accuracy is computed on a balanced dataset using a tenfold CV scheme with ten repetitions. The classification accuracy is quantified using sensitivity (%) and specificity (%). The horizontal axis denotes the different number of features (10, 25, 50, 75, 100, 150, 200, 250, 307) selected across all 4 FS algorithms and the ensemble ranking scheme.
FIG. 5.
FIG. 5.
(Color online) Scatter plots to visually assess the relationship between the most strongly associated dysphonia measures with clinical outcomes (summarized in Table IV) to explore whether those could be used to assess presbyphonia.

References

    1. Arora, S. , Baig, F. , Lo, C. , Barber, T. R. , Lawton, M. A. , Zhan, A. , Rolinski, M. , Ruffmann, C. , Klein, J. C. , Rumbold, J. , Louvel, A. , Zaiwalla, Z. , Lennox, G. , Quinnell, T. , Dennis, G. , Wade-Martins, R. , Ben-Shlomo, Y. , Little, M. A. , and Hu, M. T. (2018a). “ Smartphone motor testing to distinguish idiopathic REM sleep behavior disorder, controls, and PD,” Neurology 91, e1528–e1538. 10.1212/WNL.0000000000006366 - DOI - PMC - PubMed
    1. Arora, S. , Venkataraman, V. , Zhan, A. , Donohue, S. , Biglan, K. M. , Dorsey, E. R. , and Little, M. A. (2015). “ Detecting and monitoring the symptoms of Parkinson's disease using smartphones: A pilot study,” Parkinsonism Relat Disord. 21, 650–653. 10.1016/j.parkreldis.2015.02.026 - DOI - PubMed
    1. Arora, S. , Visanji, N. P. , Mestre, T. A. , Tsanas, A. , AlDakheel, A. , Connolly, B. S. , Gasca-Salas, C. , Kern, D. S. , Jain, J. , Slow, E. J. , Faust-Socher, A. , Lang, A. E. , Little, M. A. , and Marras, C. (2018b). “ Investigating voice as a biomarker for leucine-rich repeat kinase 2-associated Parkinson's disease,” J. Parkinsons Dis. 8, 503–510. 10.3233/JPD-181389 - DOI - PubMed
    1. Åström, F. , and Koker, R. (2011). “ A parallel neural network approach to prediction of Parkinson's disease,” Expert Syst. Appl. 38, 12470–12474. 10.1016/j.eswa.2011.04.028 - DOI
    1. Bishop C. M. (2007). Pattern Recognition and Machine Learning ( Springer-Verlag, New York: ).

Publication types