Correlation between Google Trends on dengue fever and national surveillance report in Indonesia
- PMID: 31154985
- PMCID: PMC6327938
- DOI: 10.1080/16549716.2018.1552652
Correlation between Google Trends on dengue fever and national surveillance report in Indonesia
Abstract
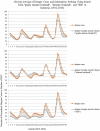
Background: Digital traces are rapidly used for health monitoring purposes in recent years. This approach is growing as the consequence of increased use of mobile phone, Internet, and machine learning. Many studies reported the use of Google Trends data as a potential data source to assist traditional surveillance systems. The rise of Internet penetration (54.7%) and the huge utilization of Google (98%) indicate the potential use of Google Trends in Indonesia. No study was performed to measure the correlation between country wide official dengue reports and Google Trends data in Indonesia. Objective: This study aims to measure the correlation between Google Trends data on dengue fever and the Indonesian national surveillance report. Methods: This research was a quantitative study using time series data (2012-2016). Two sets of data were analyzed using Moving Average analysis in Microsoft Excel. Pearson and Time lag correlations were also used to measure the correlation between those data. Results: Moving Average analysis showed that Google Trends data have a linear time series pattern with official dengue report. Pearson correlation indicated high correlation for three defined search terms with R-value range from 0.921 to 0.937 (p ≤ 0.05, overall period) which showed increasing trend in epidemic periods (2015-2016). Time lag correlation also indicated that Google Trends data can potentially be used for an early warning system and novel tool to monitor public reaction before the increase of dengue cases and during the outbreak. Conclusions: Google Trends data have a linear time series pattern and statistically correlated with annual official dengue reports. Identification of information-seeking behavior is needed to support the use of Google Trends for disease surveillance in Indonesia.
Keywords: Google Trends; Indonesia; dengue; digital epidemiology; information seeking.
Figures
References
-
- Das S, Sarfraz A, Jaiswal N, et al. Impediments of reporting dengue cases in India. J Infect Public Health [Internet]. 2017;10:494–498. - PubMed
-
- Sitepu FY, Suprayogi A, Pramono D. Evaluasi dan Implementasi Sistem Surveilans Demam Berdarah Dengue (DBD) di Kota Singkawang, Kalimantan Barat, 2010. J Litbang Pengendali Penyakit Bersumber Binatang Banjarnegara [Internet]. 2012;8:5–10. Available from: http://ejournal.litbang.depkes.go.id/index.php/blb/article/view/3259
Publication types
MeSH terms
LinkOut - more resources
Full Text Sources
Medical


