. 2019 Jun 27;178(1):176-189.e15.
doi: 10.1016/j.cell.2019.05.003. Epub 2019 May 30.

Lactate Is a Natural Suppressor of RLR Signaling by Targeting MAVS

Affiliations

Lactate Is a Natural Suppressor of RLR Signaling by Targeting MAVS

Weina Zhang et al. Cell. .

Abstract

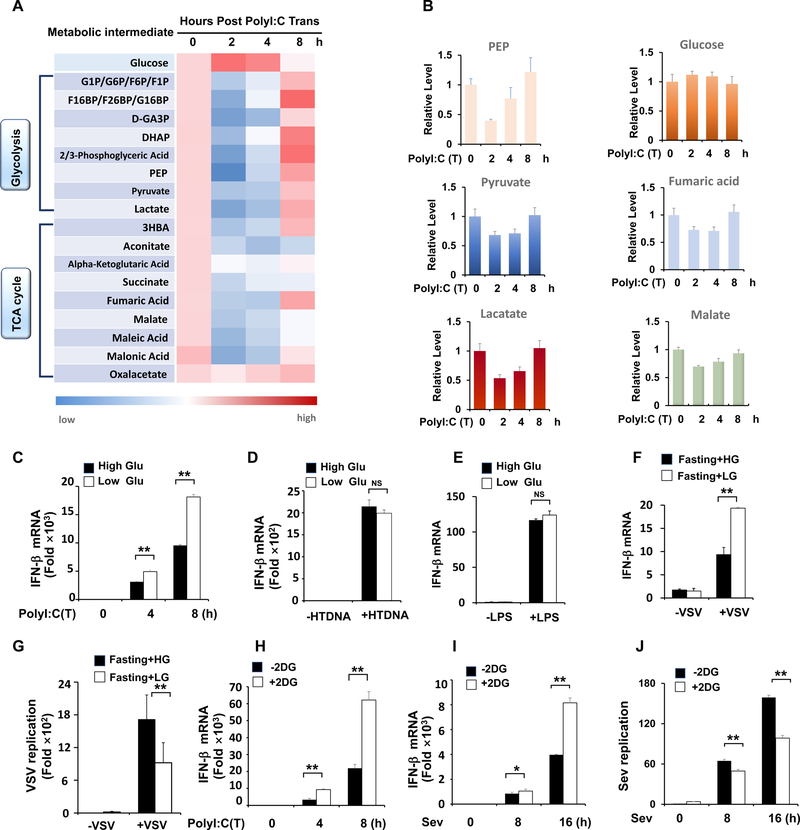
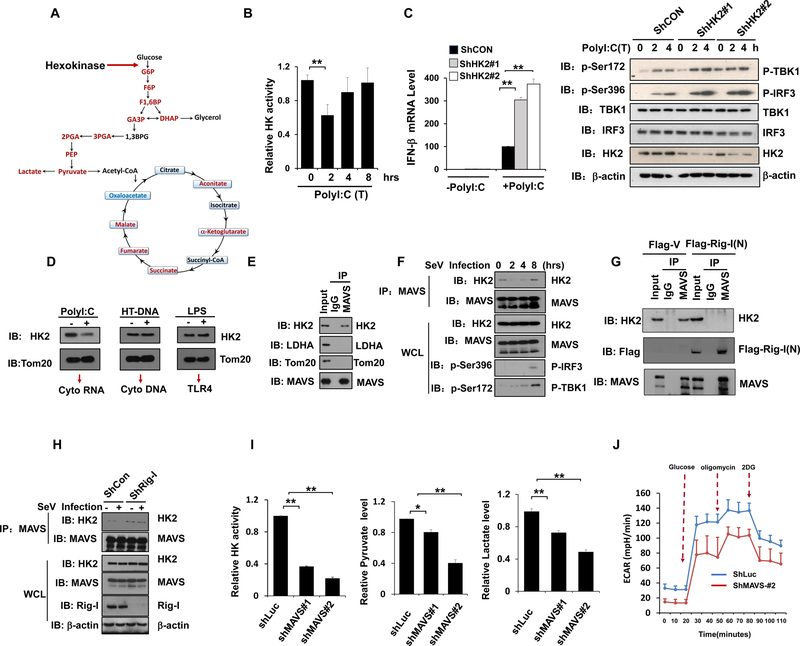
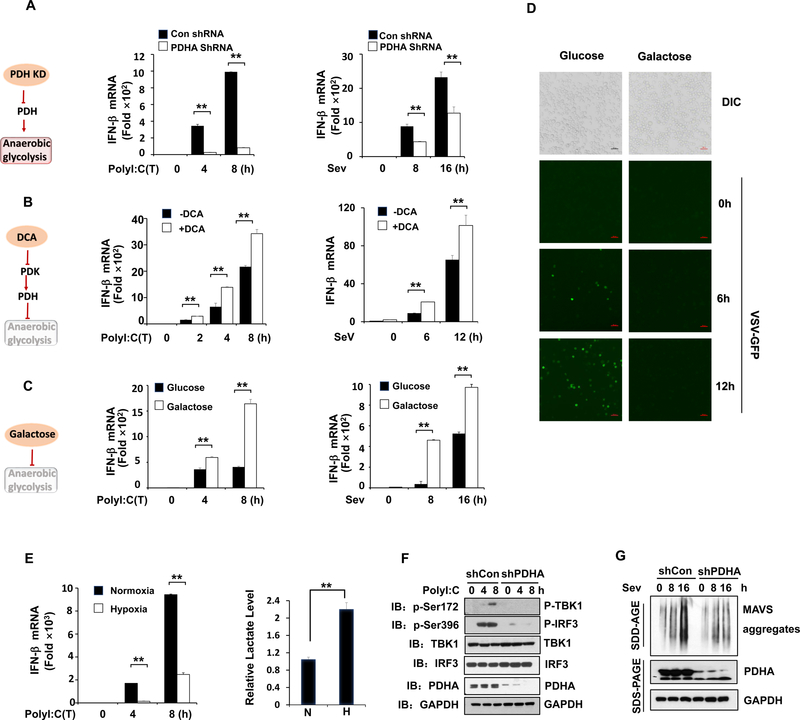
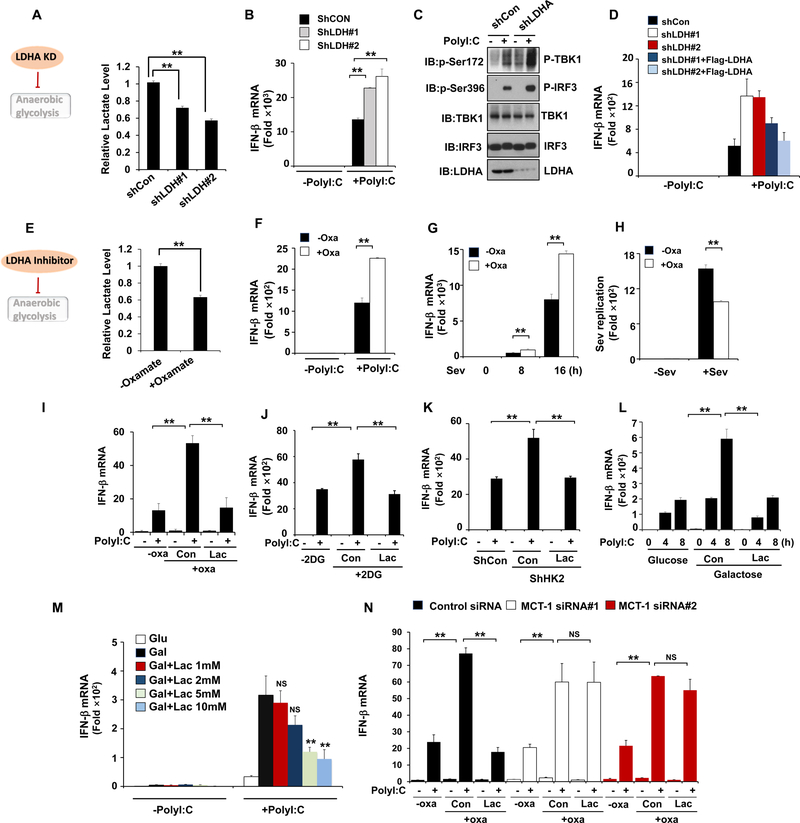
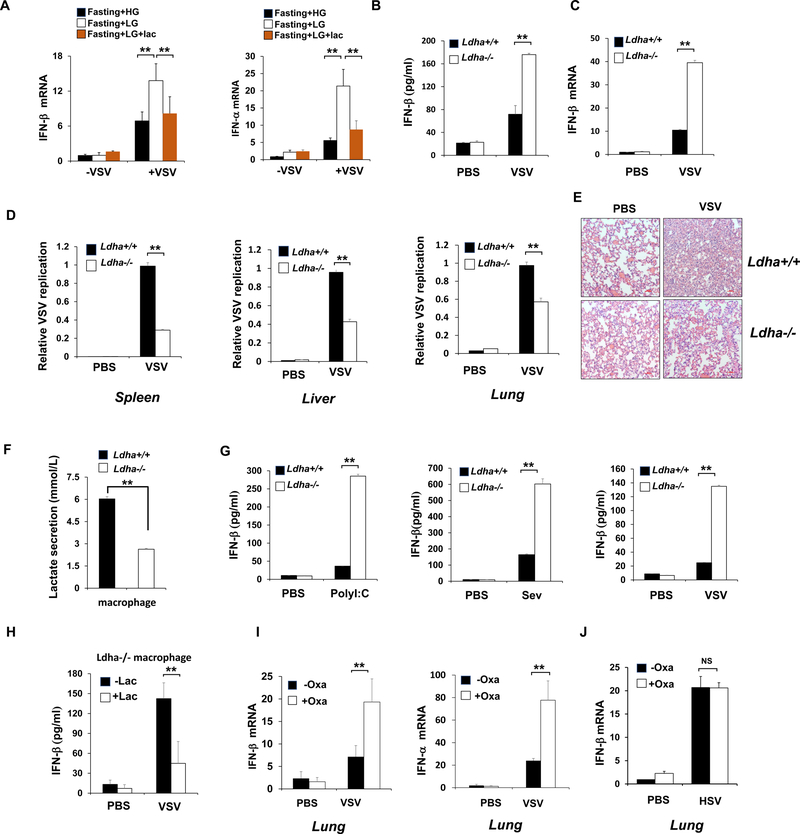
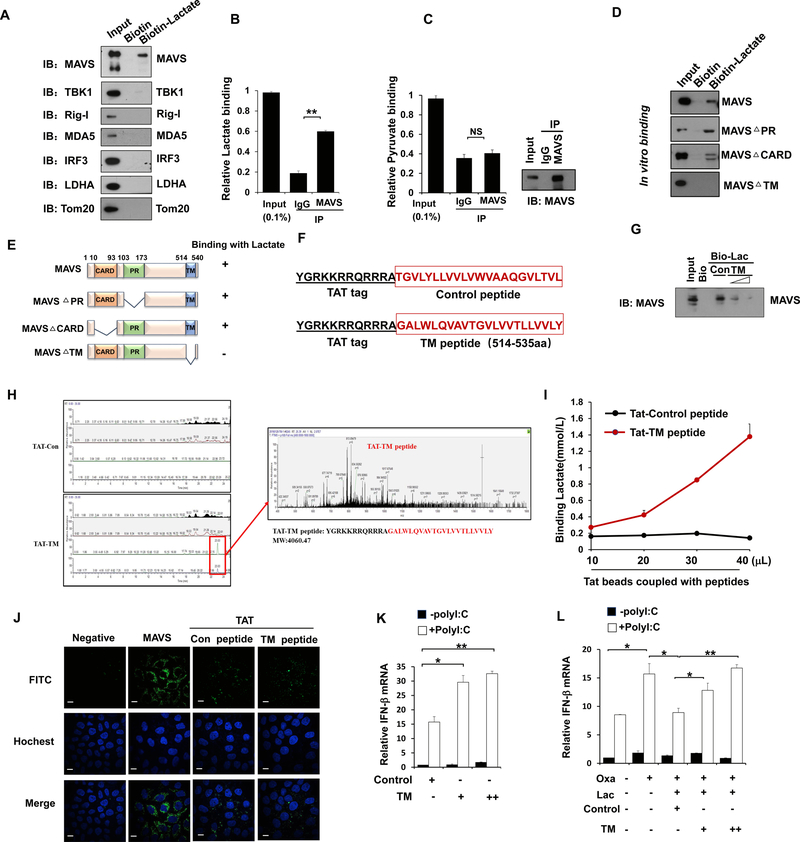
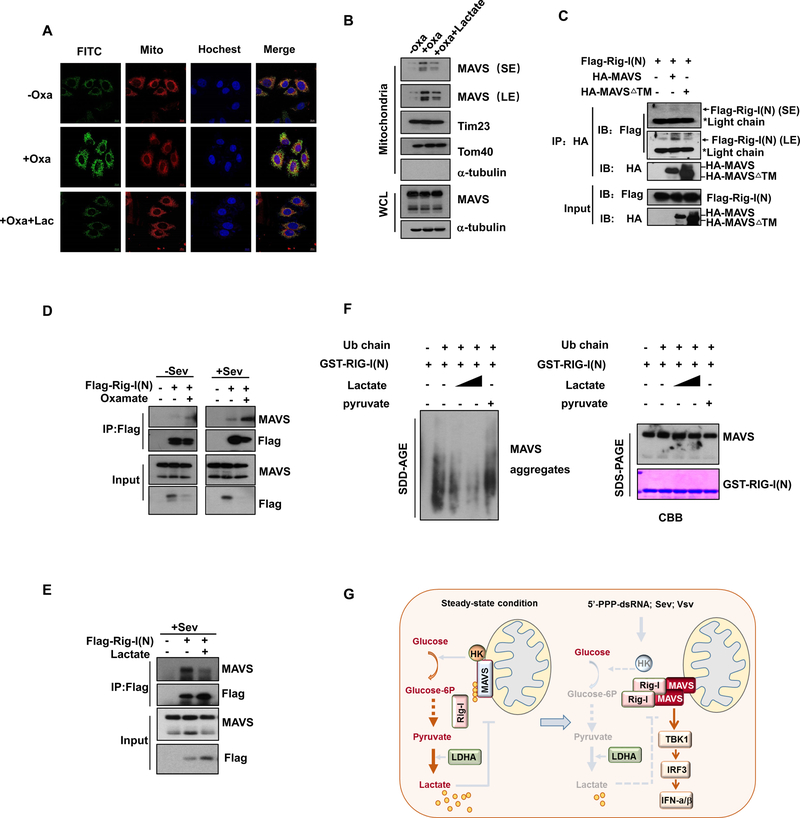
RLR-mediated type I IFN production plays a pivotal role in elevating host immunity for viral clearance and cancer immune surveillance. Here, we report that glycolysis, which is inactivated during RLR activation, serves as a barrier to impede type I IFN production upon RLR activation. RLR-triggered MAVS-RIG-I recognition hijacks hexokinase binding to MAVS, leading to the impairment of hexokinase mitochondria localization and activation. Lactate serves as a key metabolite responsible for glycolysis-mediated RLR signaling inhibition by directly binding to MAVS transmembrane (TM) domain and preventing MAVS aggregation. Notably, lactate restoration reverses increased IFN production caused by lactate deficiency. Using pharmacological and genetic approaches, we show that lactate reduction by lactate dehydrogenase A (LDHA) inactivation heightens type I IFN production to protect mice from viral infection. Our study establishes a critical role of glycolysis-derived lactate in limiting RLR signaling and identifies MAVS as a direct sensor of lactate, which functions to connect energy metabolism and innate immunity.

Keywords: MAVS; RLR signaling; glucose metabolism; interferon; lactate.


Conflict of interest statement

Declaration of Interests: The authors declare no competing interests.

Figures

Figure 1.
Figure 1.. Downregulation of glucose metabolism promotes RLR induced type-I IFN production.
A, HEK293 cells were transfected with Poly(I:C) and harvested for metabolomics analysis. Shown is the heatmap for dynamic changes of metabolites in glycolysis or oxidative phosphorylation. B, Quantification analysis of some intermediates in glycolysis and TCA cycle. C, Q-PCR analysis of IFN-β mRNA expression in HEK293 cells cultured with high glucose (25 mM) or low glucose (5 mM) and transfected with Poly(I:C)(1μg/ml). D and E, Q-PCR analysis of IFN- β mRNA expression in THP1 cells transfected with HTDNA (1 μg/ml) or stimulated with LPS (50 ng/ml). F and G, Q-PCR analysis of IFN-β or VSV mRNA expression from spleen tissue of mice fasted overnight and then treated with high glucose (1.5 g/kg) or low glucose (0.2 g/kg). H–J, Q-PCR analysis of IFN- β and Sendai viral specific gene expression in HEK293 cells pretreated with or without 2DG (2mM) and then transfected with Poly(I:C) (1 μg/ml) or infected with Sendai virus for indicated hours. Data are means±SD. * p < 0.05, **p < 0.01. See also Figure S1.
Figure 2.
Figure 2.. Mitochondria hexokinase activity is maintained by MAVS and inactivated during RLR activation.
A, Scheme of selected reactions in glucose metabolic pathway. B, Analysis of hexokinase (HK) activity in purified mitochondria isolated from HEK293 cells transfected with poly(I:C). C, Q-PCR analysis of IFN-β mRNA expression in control or HK2 knockdown Hep3B cells transfected with or without Poly(I:C) (left panel). Immunoblot analysis of Hep3B cells with control or HK2 knockdown (right panel). D, Immunoblot analysis of HK2 level in the mitochondria fraction from THP1 cells transfected with Poly(I:C), HTDNA or stimulated with LPS. Tom20 was used as a mitochondria marker. E-F, Whole cell lysis of HEK293 cells infected with or without Sev were collected for immunoprecipitation (IP) with IgG or MAVS antibody, followed by Immunoblot (IB) analysis. G, HEK293 cells transfected with Flag-V or Flag-RIG-I(N) were immunoprecipitated with indicated antibodies and IP complexes were analyzed by IB analysis. H, HEK293 cells with control or RIG-I knockdown were infected with Sev for 4 hours and whole cell lysis were collected for IP with MAVS antibody, followed by IB analysis for indicated proteins. I and J, Measurement of mitochondria hexokinase activity, total pyruvate level, lactate level and ECAR in Hep3B cells with control or MAVS knockdown. Data are means±SD. * p < 0.05, **p < 0.01. See also Figure S2.
Figure 3.
Figure 3.. Anaerobic glycolysis inhibits RLR triggered MAVS-TBK1-IRF3 activation and type-I IFN production.
A–B, Q-PCR analysis of IFN-β mRNA expression in HEK293 cells with or without PDHA knockdown (A), or pretreated with or without DCA (10 mM) (B) and then transfected with Poly(I:C) (left panel) or infected with Sendai virus (right panel) for indicated times. C, Q-PCR analysis of IFN- β mRNA expression in immortalized bone marrow macrophage (iBMM) cells cultured in mediums containing glucose (25 mM) or galactose (25 mM) and then transfected with Poly(I:C) (left panel) or infected with Sendai virus (right panel) for indicated times. D, Microscopic images of VSV-GFP-infected iBMM cells pre-cultured in the same conditions as in C and then infected with VSV-GFP (MOI=0.1) as indicated times. Scale bar, 100 μm. E, Q-PCR analysis of IFN-β mRNA expression (left panel) and measurement of lactate secretion (right panel) in HEK293 cells exposed to normoxia (20% O2) or hypoxia (1% O2) and transfected with Poly(I:C). F, Immunoblot analysis of HEK293 cells with control or PDHA knockdown and transfected with Poly(I:C) for indicated times. G, Immunoblot analysis of HEK293 cells with control or PDHA knockdown. Cell mitochondria were isolated for SDD-AGE (upper panel) and whole cell lysates were used for SDS-PAGE (lower panel). Data are means±SD. **p < 0.01. See also Figure S3.
Figure 4.
Figure 4.. LDHA-associated lactate negatively regulates RLR signaling.
A–C, Measurement of lactate secretion (A), IFN-β mRNA expression (B) or protein levels (C) in Hep3B cells with control or LDHA knockdown and transfected with Poly (I:C) for 4 hours. D, Q-PCR analysis of IFN-β mRNA expression in Hep3B cells infected with control or LDHA shRNA along with or without Flag-LDHA expression and then transfected with Poly (I:C). E, Measurement of lactate secretion in HEK293 cells pretreated with or without Sodium Oxamate (20 mM) overnight. F-H, Q-PCR analysis of IFN- μ or Sev mRNA expression in HEK293 cells treated with or without sodium oxamate (20 mM) overnight and then transfected with Poly(I:C) for 2 hours or infected with Sev as indicated. I and J, Q-PCR analysis of IFN-β mRNA expression in Hep3B cells pretreated with or without sodium oxamate (20 mM) or 2-DG (2mM) and then added with or without Lactate (10 mM) before transfecting with Poly(I:C). K, Q-PCR analysis of IFN-β mRNA expression in Hep3B cells infected with control or HK2 shRNA and then added with or without Lactate (10 mM) before transfecting with Poly(I:C). L–M, Q-PCR analysis of IFN-β mRNA expression in iBMM cells cultured in mediums containing glucose (25 mM) or galactose (25 mM) and then added with or without Lactate before transfecting with Poly(I:C). N, Q-PCR analysis of IFN-β mRNA expression in Hep3B cells with control or MCT1 knockdown and then treated with or without sodium oxamate (20mM) overnight before lactate addition (10 mM) and poly(I:C) transfection. Data are means±SD. **p < 0.01. See also Figure S4 and S5.
Figure 5.
Figure 5.. LDHA-associated lactate inhibits RLR signaling in vivo.
A, Q-PCR analysis of IFN-β and IFN-α expression in lung from mice fasted overnight and then treated with high glucose (1.5 g/kg) or low glucose (0.2 g/kg) with or without following injection of sodium lactate (1 g/kg) and infected with VSV (2×10⁷ pfu/g). B, ELISA analysis of IFN- β in sera of Ldha+/+ and Ldha−/− mice intraperitoneal injected with VSV (2×10⁷ pfu/g). C and D, Q-PCR analysis of IFN- β expression in spleen (C) and VSV replication in different organs (D) from Ldha+/+ and Ldha−/− mice infected with VSV. E, Hematoxylin and eosin (HE) staining of lung sections in Ldha+/+ and Ldha−/− mice described in D. Scale bar, 100 mm. F and G, Analysis of lactate secretion (F) and IFN-β production (G) in supernatants of peritoneal macrophages generated from Ldha+/+ and Ldha−/− mice and treated with Poly(I:C) transfection, Sev or VSV infection. H, ELISA analysis of IFN-β production in supernatants of peritoneal macrophages generated from Ldha−/− mice and then added with or without lactate (10 mM) before VSV infection. I, Q-PCR analysis of type-I IFN expression in lung from mice injected with or without sodium oxamate (750 mg/kg) and then challenged by VSV (2×10⁷ pfu/g). J, Q-PCR analysis of IFN-β mRNA expression in lung tissue from mice injected with or without sodium oxamate and infected with HSV. Data are means±SD. **p < 0.01. See also Figure S6.
Figure 6.
Figure 6.. LDHA-associated lactate negatively regulates RLR activation by targeting MAVS.
A, Immunoblot analysis of binding complexes isolated from HEK293 cell extracts incubated with biotin-labeled lactate or biotin control. B and C, Fluorescence analysis of lactate or pyruvate binding in complexes immunoprecipitated (IP) by IgG or anti-MAVS antibody from HEK293 cells. D and E, Immunoblot analysis of in vitro mapping assays among biotin-labeled lactate and various MAVS truncated protein translated in vitro by the TNT system. F, Schematic representation of the sequence for control or TM peptide of MAVS with TAT tag in N-terminal region. G, Immunoblot analysis of in vitro pulldown assays by incubating biotin-labeled lactate or biotin control with MAVS protein translated in vitro by the TNT system along with control or TM peptide. H, TM peptides identified by Mass Spectrometry through in vitro pulldown assay. I. Analysis of lactate binding with different doses of Tat-control or Tat-TM peptide. J, Immunofluorescence analysis of cellular localization of control or TM peptide in HeLa cells pretreated with each peptides, stained with MAVS or TAT antibody and imaged by confocal microscopy. Scale bar, 10 mm. K, Q-PCR analysis of IFN-β expression in Hep3B cells treated by control or TM peptide of MAVS and transfected with Poly(I:C). L, Q-PCR analysis of IFN-β expression in Hep3B cells pretreated with or without sodium oxamate overnight, then incubated with control or TM peptide of MAVS for 2 hours and addition of lactate, followed by transfection of Poly(I:C). Data are means±SD. *p < 0.05, **p < 0.01. See also Figure S7.
Figure 7.
Figure 7.. Lactate inhibits RIG-I/MAVS association and MAVS aggregation.
A, Immunofluorescence analysis of cellular localization of MAVS in Hep3B cells pretreated with or without Oxamate and added with lactate. Scale bar, 10mm. B, Immunoblot analysis of mitochondria fraction isolated from HEK293 cells treated as indicated. C-E, Cell lysates from HEK293 cells transfected or treated as indicated were immunoprecipitated with antibodies indicated, and IP complexes were analyzed by immunoblot analysis. F, Immunoblot analysis of in vitro MAVS aggregation. GST-RIG-I(N) was incubated with K63-Ub4 and then with mitochondria isolated from HEK293 cells preincubated with or without lactate (5 mM,10 mM) or pyruvate, followed by analysis of mitochondria extracts using SDD-AGE (left panel) and SDS-PAGE (right panel). GST-RIG-(N) was shown by Coomassie blue staining (CBB). G, Illustration of how glycolysis-derived lactate inhibits RLR signaling by targeting MAVS.

Comment in

References

    1. Baker JC, Yan X, Peng T, Kasten S, and Roche TE (2000). Marked differences between two isoforms of human pyruvate dehydrogenase kinase. J Biol Chem 275, 15773–15781. - PubMed
    1. Brand A, Singer K, Koehl GE, Kolitzus M, Schoenhammer G, Thiel A, Matos C, Bruss C, Klobuch S, Peter K, et al. (2016). LDHA-Associated Lactic Acid Production Blunts Tumor Immunosurveillance by T and NK Cells. Cell Metab 24, 657–671. - PubMed
    1. Burdette DL, Monroe KM, Sotelo-Troha K, Iwig JS, Eckert B, Hyodo M, Hayakawa Y, and Vance RE (2011). STING is a direct innate immune sensor of cyclic di-GMP. Nature 478, 515–518. - PMC - PubMed
    1. Chang CH, Curtis JD, Maggi LB Jr., Faubert B, Villarino AV, O’Sullivan D, Huang SC, van der Windt GJ, Blagih J, Qiu J, et al. (2013). Posttranscriptional control of T cell effector function by aerobic glycolysis. Cell 153, 1239–1251. - PMC - PubMed
    1. Chen W, Han C, Xie B, Hu X, Yu Q, Shi L, Wang Q, Li D, Wang J, Zheng P, et al. (2013a). Induction of Siglec-G by RNA viruses inhibits the innate immune response by promoting RIG-I degradation. Cell 152, 467–478. - PubMed

Publication types

MeSH terms