. 2019 Jun 27;178(1):160-175.e27.
doi: 10.1016/j.cell.2019.05.012. Epub 2019 May 30.

Stromal Microenvironment Shapes the Intratumoral Architecture of Pancreatic Cancer

Affiliations

Stromal Microenvironment Shapes the Intratumoral Architecture of Pancreatic Cancer

Matteo Ligorio et al. Cell. .

Abstract

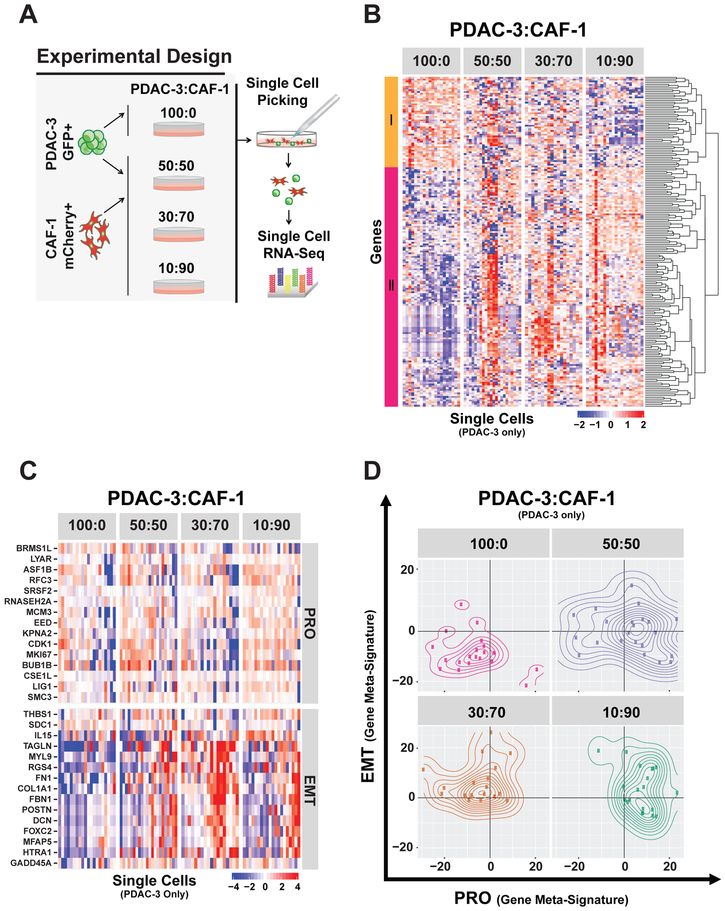
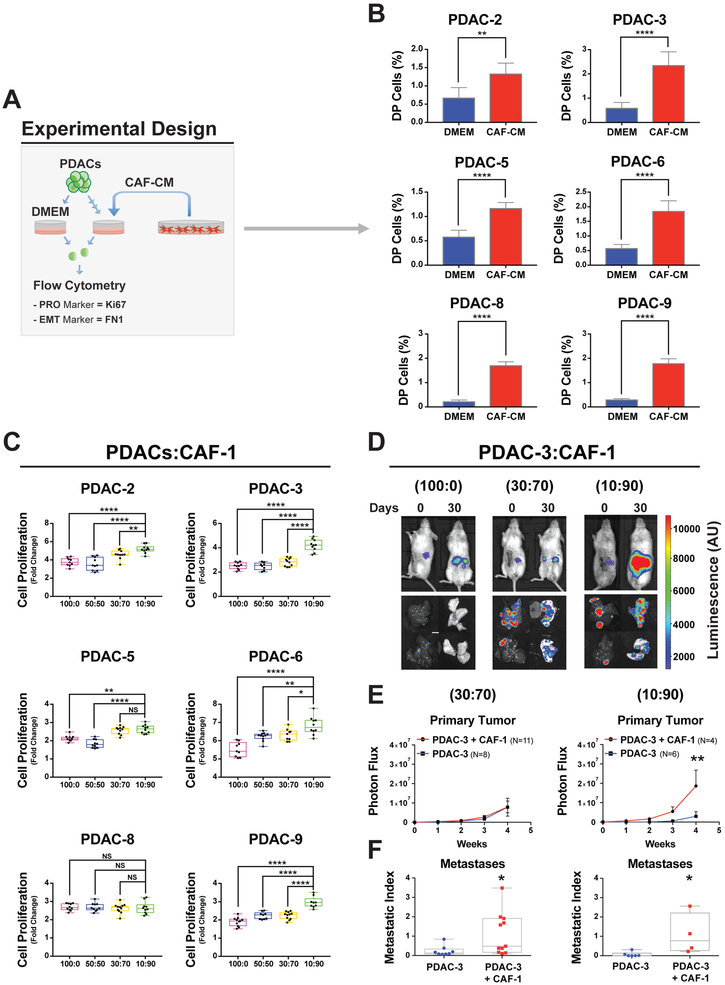
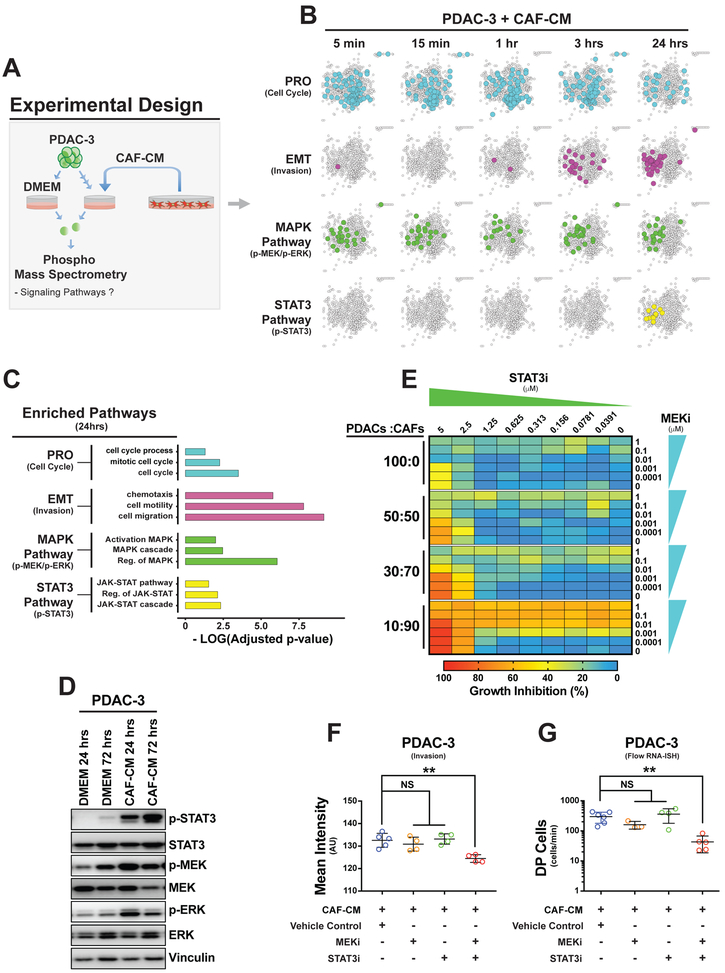
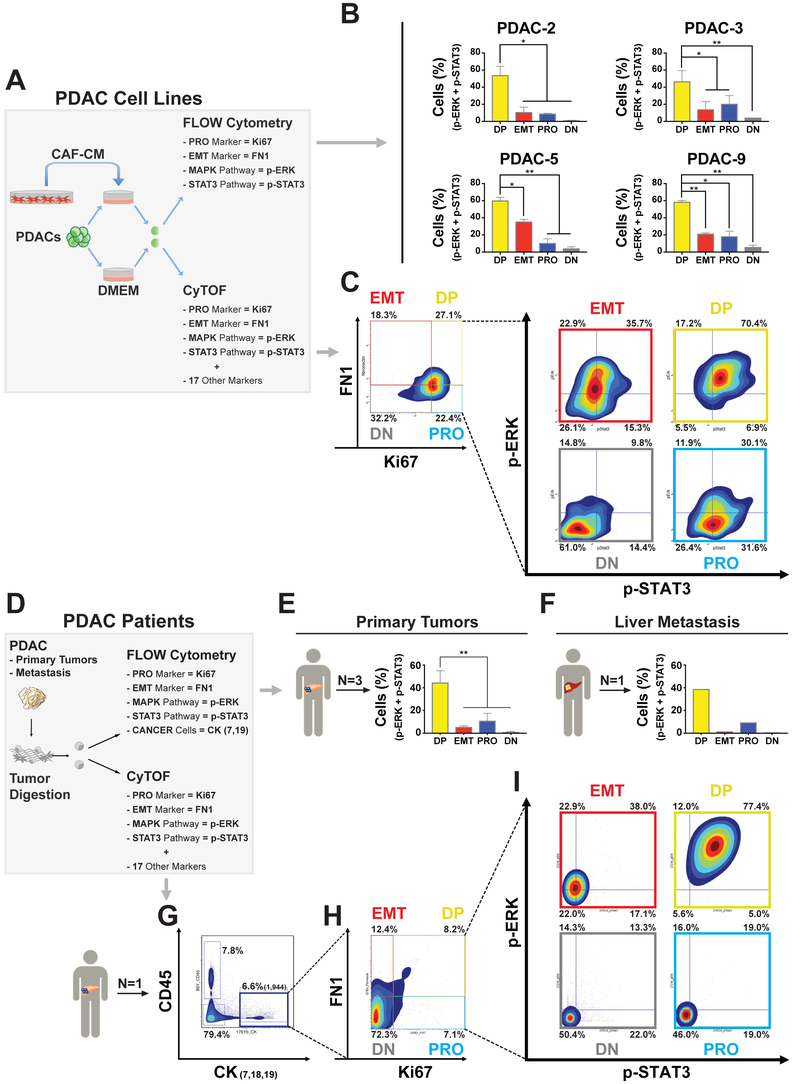
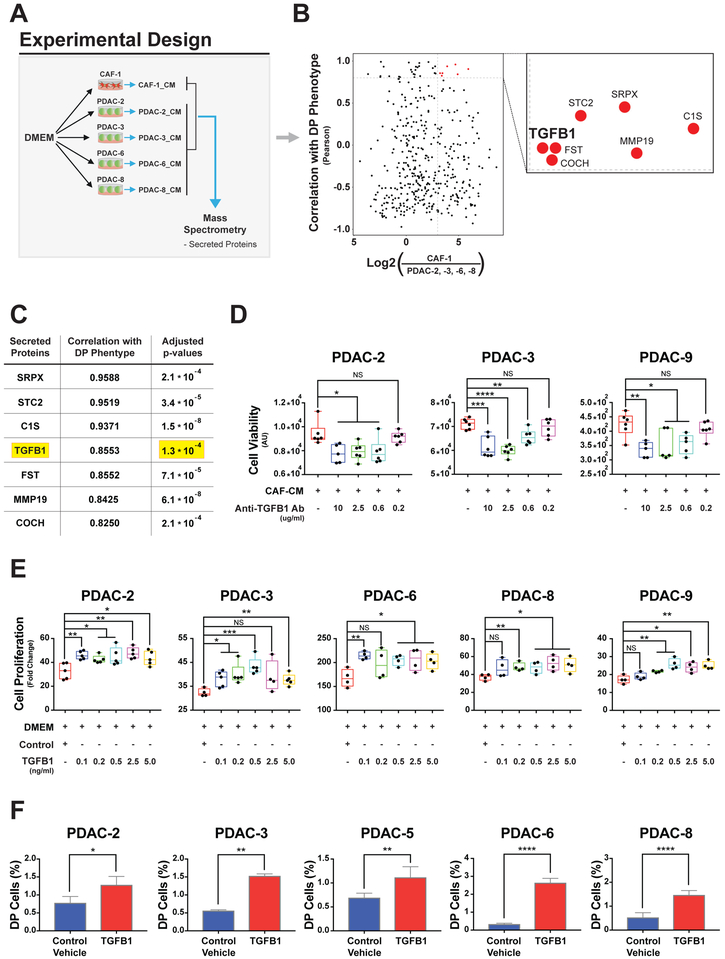
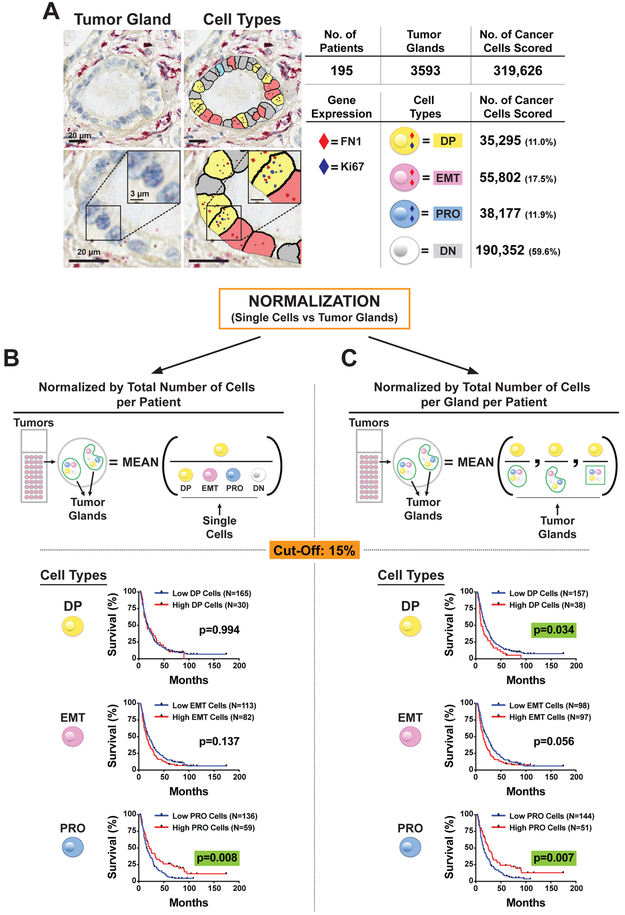
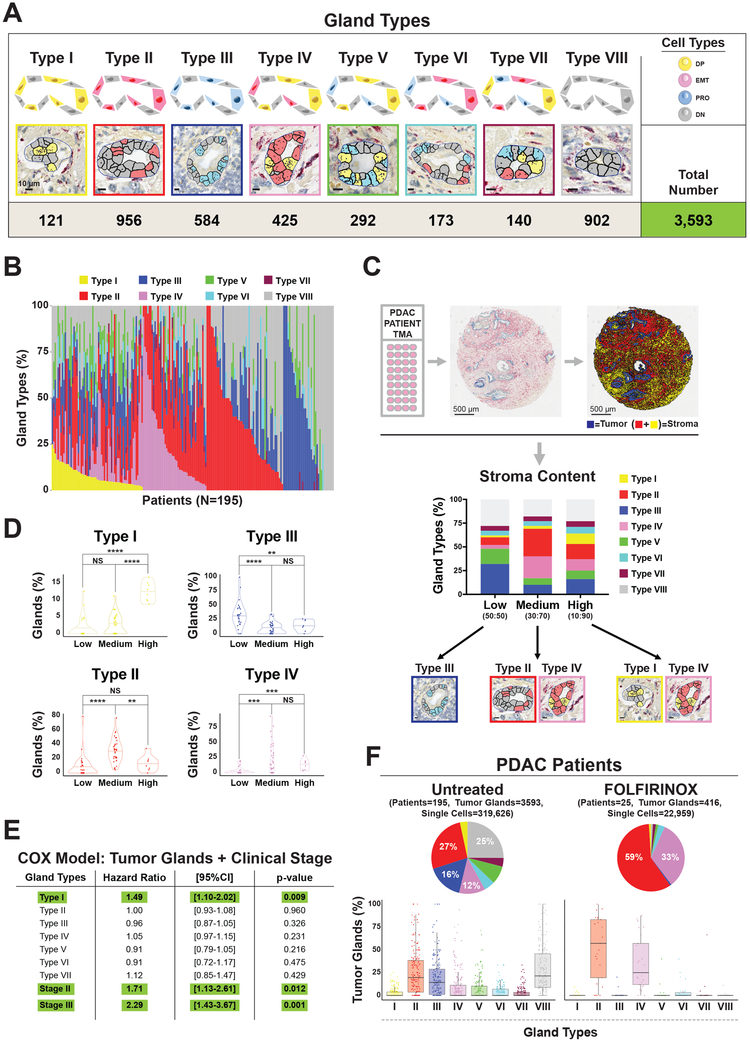
Single-cell technologies have described heterogeneity across tissues, but the spatial distribution and forces that drive single-cell phenotypes have not been well defined. Combining single-cell RNA and protein analytics in studying the role of stromal cancer-associated fibroblasts (CAFs) in modulating heterogeneity in pancreatic cancer (pancreatic ductal adenocarcinoma [PDAC]) model systems, we have identified significant single-cell population shifts toward invasive epithelial-to-mesenchymal transition (EMT) and proliferative (PRO) phenotypes linked with mitogen-activated protein kinase (MAPK) and signal transducer and activator of transcription 3 (STAT3) signaling. Using high-content digital imaging of RNA in situ hybridization in 195 PDAC tumors, we quantified these EMT and PRO subpopulations in 319,626 individual cancer cells that can be classified within the context of distinct tumor gland "units." Tumor gland typing provided an additional layer of intratumoral heterogeneity that was associated with differences in stromal abundance and clinical outcomes. This demonstrates the impact of the stroma in shaping tumor architecture by altering inherent patterns of tumor glands in human PDAC.

Keywords: mass spectrometry; pancreatic cancer; pancreatic ductal adenocarcinoma; single cell RNA-sequencing; single cell spatial analysis; stromal microenvironment; tumor architecture.


Conflict of interest statement

DECLARATION OF INTERESTS

D.T.T. has received consulting fees from Merrimack Pharmaceuticals, Ventana Roche, and EMD Millipore Sigma, which are not related to this work. D.T.T. is a founder and has equity in PanTher Therapeutics, which is not related to this work. D.T.T., V.D., and M.N.R. have a sponsored research agreement with ACD-Biotechne and previously with Affymetrix. M.J.A has received consulting income from SynapDx, BlueBird Bio, Fulcrum Therapeutics, Leap Therapeutics, NextGenJane, Progenity, Inc. and Third Rock Ventures, not related to this work. M.J.A. has financial interests in Monitor Biotechnologies (formerly known as Beacon Genomics), not related to this work. M.L. has received consulting fees from Merrimack Pharmaceuticals not related to this work. J.W.F is a paid consultant with Foundation Medicine not related to this work. All the other Authors declare no competing interests.

Figures

Figure 1
Figure 1. PDAC:CAF co-culture alters PDAC single cell heterogeneity and is associated with a DP (PRO+EMT) phenotype.
(A) Schema of single cell RNA-seq strategy in PDAC:CAF co-culture. Patient-derived GFP/Luciferase-tagged PDAC-3 cells were cultured alone (100:0) or with different proportions of mCherry-tagged CAF-1 cells, and after 72 hours, single cells were micromanipulated and subjected to RNA-seq. (B) Expression heatmap of PDAC-3 single cell RNA-seq (columns) showing 186 differentially expressed genes identified by comparing 100%pDAc-3 (100:0) with 10%PDAC-3 : 90%CAF-1 co-culture (10:90). Hierarchical gene clustering dendrogram shown (right) with two major clusters that are downregulated (I=orange) or upregulated (II=magenta) with co-culture (10:90 condition). (C) Expression heatmap of 30 genes selected for PRO and EMT gene meta-signatures. Scales in log2 normalized gene counts. (D) Contour plots representing the expression of PRO and EMT status (gene meta-signature values) in individual PDAC-3 cells for each co-culture condition.
Figure 2
Figure 2. CAF conditioned media (CAF-CM) contributes to PRO and EMT functional behavior across PDAC cell lines.
(A) Experimental schema to evaluate PRO marker (Ki67) and EMT marker (FN1) to identify single cell phenotype in other PDAC cell lines at the protein level. (B) Bar graphs of percent DP (Ki67+FN1) cells in PDAC cell line analyzed by flow cytometry after 72 hours of growth in CAF conditioned media (CAF-CM) or DMEM. Mean +/− SD shown. **= p<0.01, ****= p<0.0001, two-tailed unpaired t-test. (C) Box plots of fold change in viable PDAC cells after 72 hrs compared to day 0 of in vitro culture. Cells were seeded alone (100:0) or co-cultured with different proportions of CAF-1 cells (50:50, 30:70 and 10:90). *= p<0.05, **= p<0.01, ****=p<0.0001, NS= p>0.05, two-tailed unpaired t-test. (D) Representative bioluminescence images of orthotopic tumors (upper images) of PDAC-3 cells alone (100:0) or with different proportions of CAF-1 cells (PDAC:CAF= 30:70 or 10:90). Explanted liver and lung to quantify distant metastasis (lower images). Scale bar organ dimensions=0.5cm. Scale bar Photon Flux= Luminescence (A.U.). (E) Proliferation curves of PDAC-3 xenograft with or without CAF co-injection (**=p< 0.01, Two-way ANOVA, dots= mean values, error bars= standard error of the mean). (F) Liver and lung metastatic index: normalized to primary tumor signal (*=p<0.05, Mann-Whitney Test).
Figure 3
Figure 3. CAF-CM activates MAPK and STAT3 signaling pathways in PDAC cells.
(A) Experimental schema for identifying signaling pathways upregulated in PDAC-3 cells by CAF-CM. (B-C) Time course mass spectrometry-based phospho-proteomics experiment using PDAC-3 cells exposed to CAF-CM. (B) Protein networks showing upregulation of phospho-proteins (color circles) related to cell cycle (blue), EMT (purple), MAPK (MeK-ERK) (green) and STAT3 pathways (yellow) in PdAC-3 cells after different times of exposure to CAF-CM compared to DMEM. (C) Bar graph displaying the negative log10 q-values of the three most significant upregulated gene ontology terms enriched after 24 hours of CAF-CM. (D) Immunoblots of phosphorylated MAPK (p-MEK and p-ERK) and STAT3 (p-STAT3) proteins with paired total protein following 24 and 72 hours of exposure to CAF-CM in PDAC-3 cells. Vinculin as protein loading control. (E) Heatmap showing relative cell growth inhibition of PDAC-3 alone (100:0) or with different PDaC:CAF culture conditions 50:50, 30:70, 10:90 when treated with multiple combinations of MEKi (trametinib) and STAT3i (pyrimethamine). i = inhibitor. (F) Scatter plots showing the mean intensity (mean and standard deviation) of crystal violet staining to quantify PDAC-3 cell transwell invasion after 48 hours of exposure to CAF-CM plus MEKi (trametinib), STAT3i (pyrimethamine), combination, or vehicle (DMSO) control. **= p<0.01, NS= p>0.05, two-tailed unpaired t-test. (G) Scatter plots showing the amount of DP (MKI67+FN1) cells identified by RNA-IsH flow cytometry (mean and standard deviation) exposed to CAF-CM with MEKi (trametinib), STAT3i (SH-4-54), combination, or vehicle (DMSO) control. **= p<0.01, NS= p>0.05, two-tailed unpaired t-test.
Figure 4
Figure 4. DP cells co-upregulates MAPK and STAT3 signaling pathways in multiple PDAC lines, in human primary tumors, and in a liver metastasis.
(A) Experimental schema of patient-derived PDAC cell lines exposed to CAF-1 conditioned media (CAF-CM) and analyzed for EMT (FN1), PRO (Ki67), MAPK (p-ERK), and STAT3 (p-STAT3) pathways with multiparameter flow cytometry or mass cytometry (CyTOF). (B) Bar graph (mean +/− SD) showing the percentages of DP (Ki67+/FN1+), EMT (−/FN1+), PRO (Ki67+/−) and DN (−/−) cells that have a coupregulation of both p-ERK and p-STAT3. *= p<0.05, **= p<0.01, two-tailed unpaired t-test. (C) Contour density plots showing Ki67 and FN1 positive subpopulations in PDAC-3 cells after 72 hours of CAF-CM exposure and contour density plots showing p-ERK and p-STAT3 activation in DP, EMT, PRO and DN subpopulation. (D) Experimental schema for human PDAC samples (primary tumors and a liver metastasis) analyzed for EMT (FN1), PRO (Ki67), MAPK (p-ERK), and STAT3 (p-STAT3) pathways with multiparameter flow cytometry (FN1, Ki67, p-STAT3, p-ERK, CK-7, and CK-19) or CyTOF. (E) Bar graphs (mean +/− SD) showing the percentages of DP (Ki67+/FN1+), EMT (−/FN1+), PRO (Ki67+/−) and DN (−/−) cells in three human primary PDAC tumors and (F) in a liver metastasis. (G) Contour density plots showing epithelial cancer markers (CK7,18,19)***** compared with white blood cell marker (CD45). (H) Quadrant analysis of gated CK7,18,19 cells for Ki67 and FN1 expression. (I) Contour density plots showing p-ERK and p-STAT3 activation in each cell phenotype (DP, EMT, PRO and DN) previously identified.
Figure 5
Figure 5. CAF-secreted TGFB1 drives the DP phenotype in PDAC cell lines.
(A) Experimental schema for discovery of CAF secreted factor by comparing PDAC and CAF conditioned media (CAF-1_CM and PDAC_CM) analyzed by mass spectrometry. (B) Scatter plot showing the Log2 fold difference of each secreted protein between CAF and PDACs (x-axis; CAF/average of PDAC-2, −3, −6 and −8) and the Pearson correlation coefficient between the quantitation of secreted proteins in each PDAC line (PDAC_CM mass spectrometry) compared to DP induction (fold changes) in response to CAF-CM (Fig. 2A). The box is a magnification of the top right quadrant identifying 7 proteins with highest differential quantitation between CAF and PDAC CM (> 8-fold) and highest Pearson correlation coefficient (>0.8). (C) Enriched secreted protein ordered by decreasing values of their Pearson correlation coefficients and adjusted p-value for differential quantitation between CAF and PDAC CM. (D) Box plots showing the PDAC-2, -3, -9 cell line viability exposed to both CAF-CM and a neutralizing anti-human TGFB1 antibody after 3 days for PDAC-2 and PDAC-3 and 5 days for PDAC-9. (E) Box plots of relative cell growth in PDAC cell lines treated with different amounts of recombinant TGFB1. For box plots *= p<0.05, **= p<0.01, ***= p<0.001, ****=p<0.0001, NS= p>0.05, two-tailed unpaired t-test. (F) Bar graphs showing percentages of DP cells (Ki67+/FN1+) obtained by flow cytometry analysis across PDAC cell lines upon treatment with 0.5 ng/ml of human recombinant TGFB1. Mean +/−SD shown. *= p<0.05, **= p<0.01, ****=p<0.0001, two-tailed unpaired t-test.
Figure 6
Figure 6. Tumor glands are independent “units” in the architecture of primary PDAC tumors.
(A) Representative images of dual-color tissue RNA-ISH of primary human PDACs stained for PRO marker MKI67 (Ki67) and EMT marker FN1. Representative image analysis of tumor glands using quantitative digital pathology software to score single cancer cells in distinct cell phenotypes: DP (Ki67+/FN1+), EMT (−/FN1+), PRO (Ki67+/−) and DN (−/−). Image Bar = 20 μm, Inset Bar = 3 μm. (B-C) Kaplan-Meier survival curves for high vs low DP (Ki67+/FN1+), EMT (Ki67/FN1+), and PRO (Ki67+/FN1) cells. (B) Single cell scoring by the total number of cancer cells per tumor (left column) compared to (C) single cell scoring normalized per gland basis (right column). A uniform cutoff of 15% was applied to divide low- vs high-risk patients in each Kaplan-Meier curve.
Figure 7
Figure 7. Stromal content and cytotoxic therapies are correlated with distinct patterns of tumor glands in human primary PDAC tumors.
(A) Representative images of eight distinct tumor glands found in human primary PDACs based on their composition of DP, EMT, PRO, and DN cells. Bar = 10 μm. Number of glands scored shown at the bottom. (C) Upper panel: Representative image of dual-color RNA-ISH staining for cytokeratins (KRT 7, 8, 18, 19, blue color) and SPARC gene (red color) of tissue microarray (TMA) slides of human primary PDAC tumors and representative image of digital analysis to determine the amount of stroma (SPARC) in human primary PDAC tumors. Tumor area is represented by the total amount of the blue area (cytokeratins), while stroma is the sum of the red (cellular compartment) and yellow (extracellular compartment) area for each core. Lower panel: Bar plots depicting the differences in intratumoral glandular heterogeneity in low (<75%, PDAC:CAF=~50:50), medium (75-85%, PDAC:CAF=~30:70), and high (>85%, PDAC: CAF=~10:90) stroma PDAC tumors. Tumor glands enriched in primary PDACs in each stroma class shown below: Type III in low stroma, Type II and Type IV in medium stroma, and Type I and Type IV in high stroma tumors. (D) Violin plots showing the distribution of different types of tumor glands based on stromal content in PDAC tumors. (E) Multivariate survival analysis (COX-Regression Model) including tumor gland types and clinical stage (stage II and III). (F) Upper panel: Pie charts comparing the intratumor glandular composition of untreated patients (N=195) with FOLFIRINOX-treated patients (N=25). Lower panel: Box plots showing the distribution of each gland type in untreated (left panel) vs FOLFIRINOX-treated patients (right panel).

Comment in

References

    1. Amedei A, Niccolai E, and Prisco D (2014). Pancreatic cancer: Role of the immune system in cancer progression and vaccine-based immunotherapy. Hum. Vaccin. Immunother. 10, 3354–3368. - PMC - PubMed
    1. Apte MV, Wilson JS, Lugea A, and Pandol SJ (2013). A Starring Role for Stellate Cells in the Pancreatic Cancer Microenvironment. Gastroenterology 144, 1210–1219. - PMC - PubMed
    1. Beausoleil SA, Villén J, Gerber SA, Rush J, and Gygi SP (2006). A probability-based approach for high-throughput protein phosphorylation analysis and site localization. Nat Biotechnol 24, 1285–1292. - PubMed
    1. Bernard V, Semaan A, Huang J, San Lucas FA, Mulu FC, Stephens BM, Guerrero PA, Huang Y, Zhao J, Kamyabi N, et al. (2018). Single Cell Transcriptomics of Pancreatic Cancer Precursors Demonstrates Epithelial and Microenvironmental Heterogeneity as an Early Event in Neoplastic Progression. Clin. Cancer Res. - PMC - PubMed
    1. Biffi G, Oni TE, Spielman B, Hao Y, Elyada E, Park Y, Preall J, and Tuveson DA (2019). IL1-Induced JAK/STAT Signaling Is Antagonized by TGFβ to Shape CAF Heterogeneity in Pancreatic Ductal Adenocarcinoma. Cancer Discov 9, 282–301. - PMC - PubMed

Publication types

MeSH terms

Substances

LinkOut - more resources