. 2019 Aug 6;30(2):374-384.e6.
doi: 10.1016/j.cmet.2019.05.007. Epub 2019 May 30.

Modeling Steatohepatitis in Humans with Pluripotent Stem Cell-Derived Organoids

Affiliations

Modeling Steatohepatitis in Humans with Pluripotent Stem Cell-Derived Organoids

Rie Ouchi et al. Cell Metab. .

Abstract

Human organoid systems recapitulate in vivo organ architecture yet fail to capture complex pathologies such as inflammation and fibrosis. Here, using 11 different healthy and diseased pluripotent stem cell lines, we developed a reproducible method to derive multi-cellular human liver organoids composed of hepatocyte-, stellate-, and Kupffer-like cells that exhibit transcriptomic resemblance to in vivo-derived tissues. Under free fatty acid treatment, organoids, but not reaggregated cocultured spheroids, recapitulated key features of steatohepatitis, including steatosis, inflammation, and fibrosis phenotypes in a successive manner. Interestingly, an organoid-level biophysical readout with atomic force microscopy demonstrated that organoid stiffening reflects the fibrosis severity. Furthermore, organoids from patients with genetic dysfunction of lysosomal acid lipase phenocopied severe steatohepatitis, rescued by FXR agonism-mediated reactive oxygen species suppression. The presented key methodology and preliminary results offer a new approach for studying a personalized basis for inflammation and fibrosis in humans, thus facilitating the discovery of effective treatments.

Keywords: Wolman disease; atomic force microscopy; embryonic stem cell; fibrosis; human liver organoid; induced pluripotent stem cell; inflammation; multicellular tissue; steatohepatitis.


Conflict of interest statement

DECLARATION OF INTERESTS

There are no financial interests related to this work.

Figures

Figure 1.
Figure 1.. Generation of multicellular human iPSC-liver organoids
A) Schematic representation of HLO and sHLO induction method. B) Bright-field image of entire Matrigel drop containing day 20 HLO. Lower bright-field image is day 20 HLO after excluding from Matrigel. Scale bar, 100 μm. C) Correlation spanning tree based on SOMs analysis. Shown are representative single-cell portraits as well as the consensus portrait for each sample. Left lower panel shows a heat-colored SOM mosaic of fetal liver, HLO, and hepatocyte. The color indicates the expression strength of a gene cluster. Right lower panel showed the bar-graph display of SOM outputs associated with lipids homeostasis. D) Percentages of EpCAM, CD166, CD68, and EMR1 positive populations were determined by flow cytometry. Results represent mean ±SD, n=3. E) Whole mount immunofluorescent staining of E-cadherin, CEBPA, Vimentin, and CD68 in HLO at day 25. Arrowheads indicate the localization of CD68+/CEBPA− cells, respectively. Scale bar, 50 μm. F) tSNE plot for 4,059 successful scRNA-seq of HLO. Each dot represents one cell. A gradient of orange to red indicates low to high expression levels. Gray cell means no expression level of the gene.
Figure 2.
Figure 2.. Modeling steatohepatitis pathology using human iPSC-liver organoids
A) Live-cell imaging of lipids, membrane, and nuclear in sHLO. Scale bar, 50 μm. Results represent mean ±SD of n=10 HLO. B) Representative total lipid volume normalized by each organoid size. C) Quantification of triglycerides in HLO and sHLO. Results represent mean ±SD, n=3. D) ELISA measurement of IL-6 in HLO and sHLO. Results represent mean ±SD, n=3. E) Gene expression of TNFA and IL-8 in HLO and sHLO. Results represent mean ±SD, n=4. F) Relative THP-1 migration cells in HLO and sHLO. Results represent mean ±SD, n=3. G) ELISA measurement of P3NP in HLO and sHLO. Results represent mean ±SD, n=3. H) Images of whole mount staining of Vimentin and alpha-SMA in HLO and sHLO. Scale bar, 100 μm. The right graph represents quantification of Vimentin positive HLO and sHLO. Results represent mean ±SD, n=8-20 HLO. I) Images of Masson’s trichrome staining in HLO and sHLO. Scale bar, 50 μm. The right graph represents quantification of trichome positive HLO and sHLO. Results represent mean ±SD, n=8-20 HLO.
Figure 3.
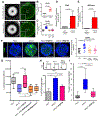
Figure 3.. Cirrhotic transition of steatohepatitis HLO measured by AFM
A) Schematic representation for measuring the stiffness of HLO by AFM. The top region of each single HLO (14×14 matrix in a 25×25 μm square) was scanned with an AFM cantilever. Scale bar, 100 μm. The heatmap represents Young’s modulus on each scanned spot. B) Young’s modulus of LPS treated HLO, visualized by the dot plot with box-and-whisker plot. The box-and-whisker represents 10, 25, 50 (median), 75 and 90th percentiles of Young’s modulus. Results represent mean ±SD, n=6-10 HLO. C) Young’s modulus of OA treated sHLO, visualized by the dot plot with box-and-whisker plot. The box-and-whisker represents 10, 25, 50 (median), 75 and 90th percentiles of Young’s modulus. Results represent mean ±SD, n=7-10 HLO. D) Bright-field image of HLO and sHLO from 8 iPSC lines. Scale bar, 50 μm. E) Young’s modulus obtained from 8 iPSC lines derived HLO and sHLO were summarized by dot plot with box-and-whisker plot indicating 10, 25, 50 (median), 75 and 90th percentiles. Results represent mean ±SD, n=5-15 HLO.
Figure 4.
Figure 4.. FGF19 treatment rescue Wolman disease like pathology in vitro
A) Bright-field images and lipids fluorescent images of over 100 organoids from Wolman disease patients and non-Wolman donors after OA treatment. Inset shows higher magnified image. B) Quantification of mean of fluorescent intensity of lipids in non-Wolman sHLO and Wolman sHLO. Each dot indicates one organoid. Result represents mean ±SEM, n=20 HLO. C) Quantification of mean of fluorescent intensity of lipids in Wolman sHLO with LAL treatment. Results represent mean ±SEM, n=15-20 HLO. D) Comparison of P3NP secretion level of non-Wolman (5 lines) and Wolman sHLO (3 lines). Results represent mean ±SEM, n=3. E) Comparison of Young’s modulus of non-Wolman (5 lines) and Wolman sHLO (3 lines). Results represent mean ±SEM, n=7-10 HLO. F) Lipids fluorescent images of Wolman HLO and sHLO with or without FGF19. Scale bar, 50 μm. Right panel showed the quantification of mean of lipids florescent intensity. Each dot indicates one organoid. Results represent mean ±SEM, n=15-20 HLO. G) Effect of FGF19 and magnesium on sHLO viability. Results represent mean ±SEM, n=6. H) Effect of FGF19 on ROS production in EpCAM positive cells of Wolman HLO and sHLO with or without FGF19. Results represent mean ±SEM, n=3. I) Effect of FGF19 on stiffness assessment. Results represent mean ±SD, n=5-10 HLO.

Comment in

  • Organoid modelling of NAFLD.
    Thomas H. Thomas H. Nat Rev Gastroenterol Hepatol. 2019 Aug;16(8):454-455. doi: 10.1038/s41575-019-0181-3. Nat Rev Gastroenterol Hepatol. 2019. PMID: 31267040 No abstract available.

References

    1. Asai A, Aihara E, Watson C, Mourya R, Mizuochi T, Shivakumar P, Phelan K, Mayhew C, Helmrath M, Takebe T, et al. (2017). Paracrine signals regulate human liver organoid maturation from induced pluripotent stem cells. Development 144, 1056–1064. - PMC - PubMed
    1. Attia YM, Tawfiq RA, Ali AA, and Elmazar MM (2017). The FXR Agonist, Obeticholic Acid, Suppresses HCC Proliferation & Metastasis: Role of IL-6/STAT3 Signalling Pathway. Sci Rep 7, 12502. - PMC - PubMed
    1. Babbs C, Smith A, Hunt LP, Rowan BP, Haboubi NY, and Warnes TW (1988). Type III procollagen peptide: a marker of disease activity and prognosis in primary biliary cirrhosis. Lancet 1, 1021–1024. - PubMed
    1. Barbara M, Scott A, and Alkhouri N (2018). New insights into genetic predisposition and novel therapeutic targets for nonalcoholic fatty liver disease. Hepatobiliary Surg Nutr 7, 372–381. - PMC - PubMed
    1. Begriche K, Igoudjil A, Pessayre D, and Fromenty B (2006). Mitochondrial dysfunction in NASH: causes, consequences and possible means to prevent it. Mitochondrion 6, 1–28. - PubMed

Publication types