

Cognitively Intact and Happy Life Expectancy in the United States
- PMID: 31155653
- PMCID: PMC7813190
- DOI: 10.1093/geronb/gbz080
Cognitively Intact and Happy Life Expectancy in the United States
Abstract
Objectives: We examined the number of years to be lived with and without cognitive impairment and with high self-assessed quality of life (i.e., happiness) among a nationally representative sample of Americans aged 65 years and older. Two key questions are addressed: Can people have a high quality of life despite being cognitively impaired? Which is longer: happy life expectancy or cognitively intact life expectancy?
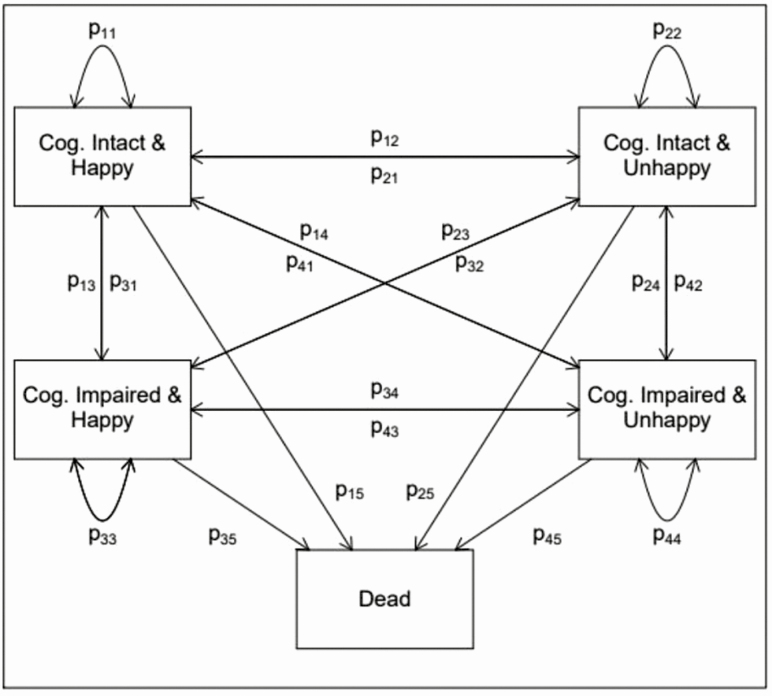
Method: Data from nine waves of the Health and Retirement Study (1998-2014) were used to estimate transition probabilities into and out of cognitively intact/impaired-un/happy states, as well as to death. Recently extended Bayesian multistate life table methods were used to estimate age-specific cognitively intact and happy life expectancy net of sex, race/ethnicity, education, and birth cohort.
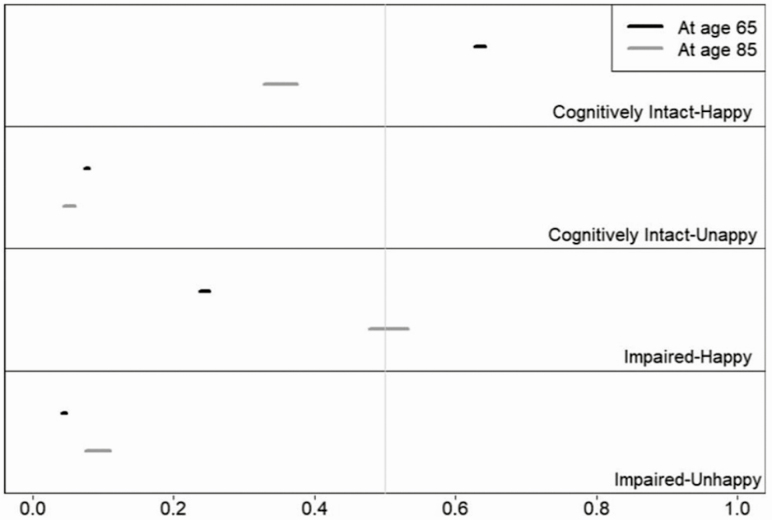
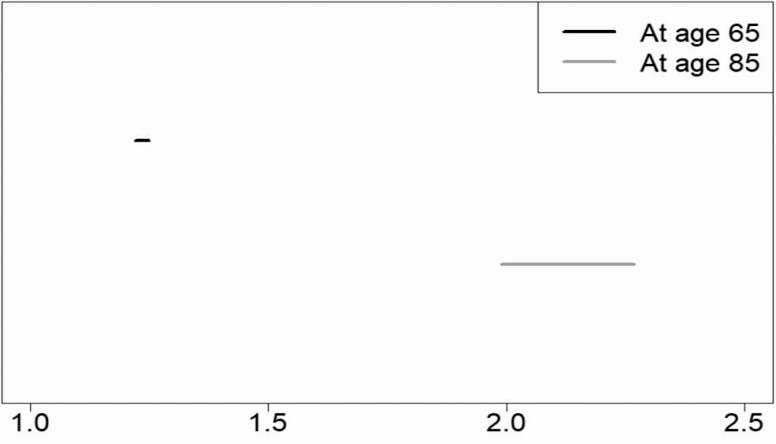
Results: Happiness and cognitive impairment were shown to coexist in both the gross cross-tabulated data and in the life tables. Happy life expectancy is approximately 25% longer than cognitively intact life expectancy at age 65 years, and by age 85, happy life expectancy is roughly double cognitively intact life expectancy, on average.
Discussion: Lack of cognitive impairment is not a necessary condition for happiness. In other words, people can have a high quality of life despite being cognitively impaired.
Keywords: Cognitive impairment; Health and Retirement Study; Mortality; Quality of life; Subjective well-being.
© The Author(s) 2019. Published by Oxford University Press on behalf of The Gerontological Society of America. All rights reserved. For permissions, please e-mail: journals.permissions@oup.com.
Figures
References
-
- Arthaud-Day M. L., Rode J. C., Mooney C. H., & Near J. P (2005). The subjective well-being construct: A test of its convergent, discriminant, and factorial validity. Social Indicators Research, 74, 445–476. doi:10.1007/s11205-004-8209-6
-
- Baltes P. B., & Baltes M. M (1990). Psychological perspectives on successful aging: The model of selective optimization with compensation. In Baltes P. B. & Baltes M. M. (Eds.), Successful aging: Perspectives from the behavioral sciences (Vol. 1, pp. 1–34). United Kingdom: Cambridge University Press.
-
- Bardo A. R. (2017). A life course model for a domains-of-life approach to happiness: Evidence from the United States. Advances in Life Course Research, 33, 11–22. doi:10.1016/j.alcr.2017.06.002
Publication types
MeSH terms
Grants and funding
LinkOut - more resources
Full Text Sources
Medical
